Laser Powder Bed Fusion - Metal
1. Roadmap Overview
This is a technology roadmap for: 3PEM - Proton Exchange Membrane This is a “Level 3” roadmap, indicating that it addresses a technology at the subsystem level. Higher level roadmaps related to this subject would address technology progression at the market level (Hydrogen Supply) and product level (Water Electrolyzer). A short video summary and introduction to this roadmap follows here.
{{#evt: service=youtube |id=https://youtu.be/JqCBwPOBRds }}
Technology Roadmap Sections and Deliverables
The clear and unique identifier for this technology roadmap is:
- 3LPB - Laser Powder Bed Fusion - Metal
This indicates that we are dealing with a “level 3” roadmap at the specific implementation level, where “level 1”and "level 2" would have indicated the over-arching roadmap and “level 4” would have indicated an individual technology roadmap.
In select sections of the roadmap, "3LPB" signifies a fictional company seeking to develop an improved LPBF-M machine.
Roadmap Overview
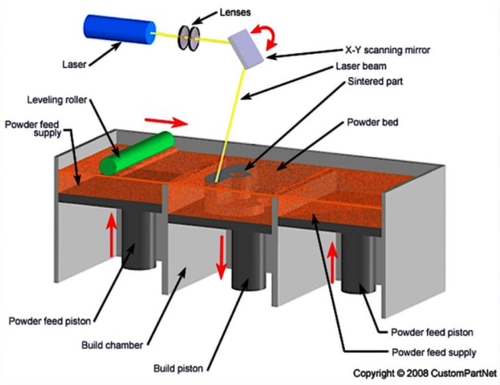
The working principle and architecture of Laser Powder Bed Fusion - Metal is depicted in the image below.
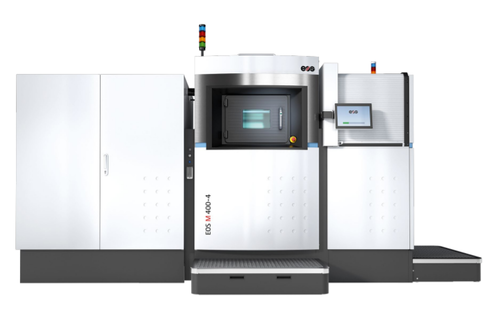
Figure: EOS M400-4 LPBF-M machine (source: EOS)
Figure: LPBF-M Process (source: CustomPartNet)
Laser Powder Bed Fusion - Metal (LPBF-M) is an additive manufacturing (AM) technology that enables the creation complex metal components directly from a digital 3D model without any tools. While the number of available materials is still limited compared to other milling and injection molding processes, LPBF-M utilizes various metals such as cobalt chrome, nickel alloys, titanium, aluminum, stainless steel and copper to generate robust functional prototypes and production parts that are capable of surviving in severe use cases. The LPBF-M technology offers comparable quality to parts made with traditional manufacturing methods, with material properties surpassing those of cast parts and approaching those of billet. It is most widely used in aerospace, medical, motorsports, energy, and molding. Beyond highly-stressed functional components, LPBF-M can be used for producing parts in cosmetic applications, manufacturing aids, small integrated structures, dental components, surgical implants.
The process shares similarities with many other layer-wise additive manufacturing technologies. A program utilizes 3D model data and mathematically slices it into 2D cross-sections. Each section will act as a template that lets the LPBF-M machine know where to precisely create perimeters and cross-hatching. The data is transferred to the LPBF-M equipment. Subsequently, a "recoater" spreads a 25-120µm thick layer of powdered metal to produce a uniform layer over the solid metal build plate. A laser then draws a 2D cross-section on the powdered material, fusing the substrate into a solid. Once a layer is complete, the base plate is lowered enough to make room for the next layer. More material is collected from the reservoir and recoated evenly on the previously sintered layer. The LPBF-M machine continues to create layer upon layer building from the bottom up as the part is built. Support structures are added to part to provide a reinforcement for overhangs, and to prevent thermally expansion from negatively impacting dimensional accuracy. Following printing, the unfused powder is vacuumed from the chamber and the build plate is removed from the machine. Thereafter, the components typically undergo a stress relief and/or heat treatment process to remove residual thermal stresses and improve material properties. Following heat treatment, the next steps are support removal, detachment from the build plate (via bandsaw or wire EDM), and media blasting for final powder removal.
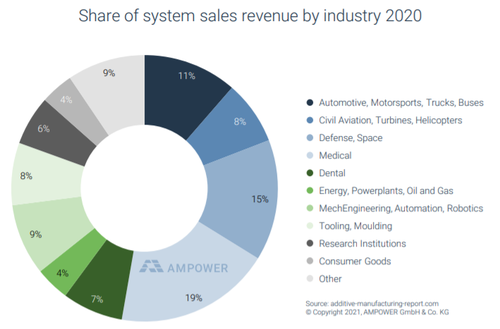
Figure: Industry breakdown for installed metal powder bed fusion machines. This figure includes non-laser powder bed machines but 85-90% of these unit sare LPBF-M. (source: Dr. Maximilian Munsch, AMPOWER 2021 Additive Manufacturing Report)
There is also an environmental advantage in the raw material efficiency of the processes. While the scrap rate for many complex milled parts is over 90%, the scrap rate for LPBF-M parts is typically less than 5%. While milled chips can be recycled, they must be processed offsite using considerable energy. In many cases, the LPBF-M powder can be immediately returned to a machine reservoir following sieving.
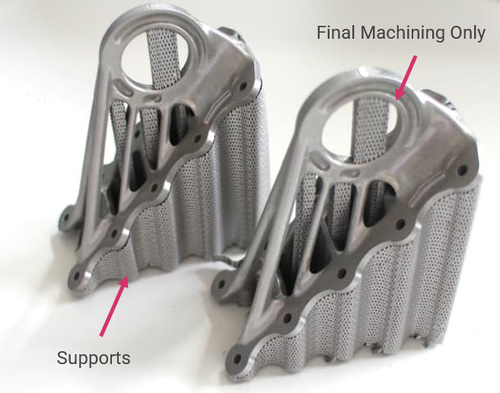
Figure: A350 XWB cabin brackets (source: Airbus)
The primary deficits of the technology in its current form are slow production rates, expensive machines, and high powder costs due to low volume requirements. The combination of these three challenges results in a high part piece cost. However, with improved performance, elimination of tooling, and reduced lead-time, there are many positive business cases for LPBF-M. In the future, the introduction of high-speed systems with more powerful lasers and larger build chambers is expected to increase the number of viable economically-viable applications that will drive increased demand and scale for LPBF-M systems.
Figure: Cost comparison for conventional manufacturing (CM), additive components, and AM-enhanced tooling. The freedom provided by AM methods like LPBF-M provides entry to design spaces that would otherwise be impractical or impossible to access. (source: Modified from John Hart and Haden Quinlan, MIT xPro "Additive Manufacturing for Innovative Design and Production course," MIT)
The LPBF-M market is maturing with breakthrough applications across multiple industries that provide the justification and institutional know-how to continue growing the technology.
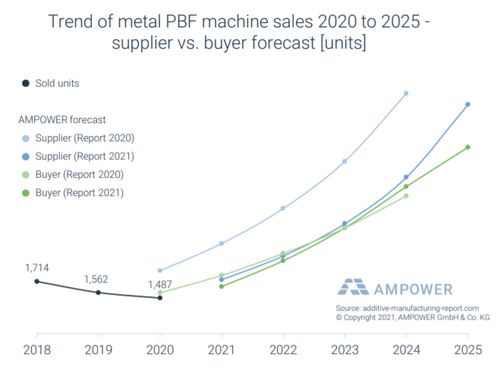
Figure: Metal powder bed fusion machines expected sales show a predicted 6000-7500 units by 2025. This figure includes non-laser powder bed machines but 85-90% of these sales are LPBF-M, bringing the predicted totals to 5100-6750. (source: Dr. Maximilian Munsch, AMPOWER 2021 Additive Manufacturing Report)
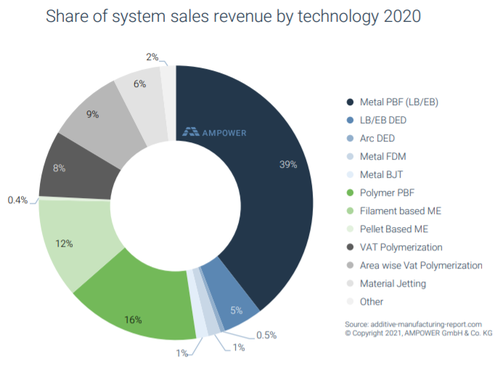
Figure: Metal powder bed fusion is responsible for 39% of sales revenue of all AM machines. While significantly more expensive than polymer systems (>2X), LPBF-M sales revenue is reflective of the technology's increasing foothold. (source: AMPOWER 2021 Additive Manufacturing Report)
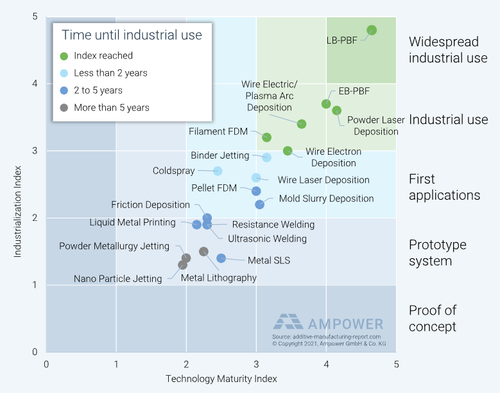
Finally, LPBF-M is the leading metal AM technology from an industrialization and technology maturity standpoint, yet it still has significant room for improvement, making it the ideal technology for roadmapping.
Figure: LPBF-M leads industrialization and technology maturity indices. (source: AMPOWER 2021 Additive Manufacturing Report)
Design Structure Matrix (DSM) Allocation[edit]
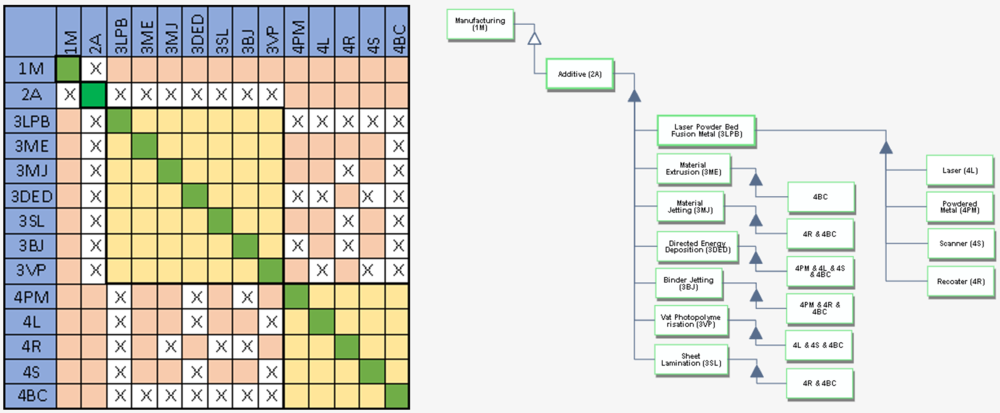
The classification tree below shows us that LPBF-M is part of the larger Additive system. The DSM and tree both show that LPBF-M requires the following technologies at subsystem level 4: Laser (4L), Powdered Metal (4PM), Scanner (4S), Recoater (4R), and Build Chamber (4BC). Each level 3 subsystem also requires enabling technologies shown as level 4 systems.
Roadmap Model using OPM
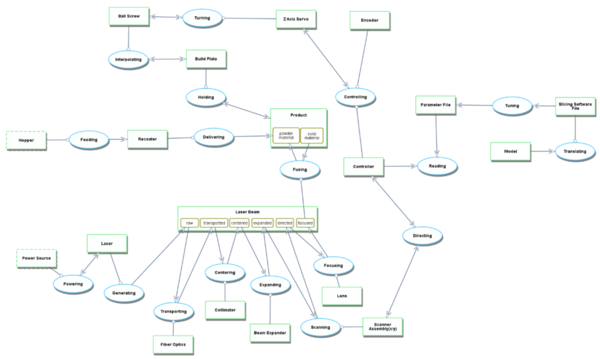
An Object-Process-Diagram (OPD) of LPBF-M is provided in the figure below. This diagram captures the main object of the roadmap (LPBF-M), its various instances including development projects, its decomposition into subsystems, its characterization by Figures of Merit (FOMs) as well as the primary processes.
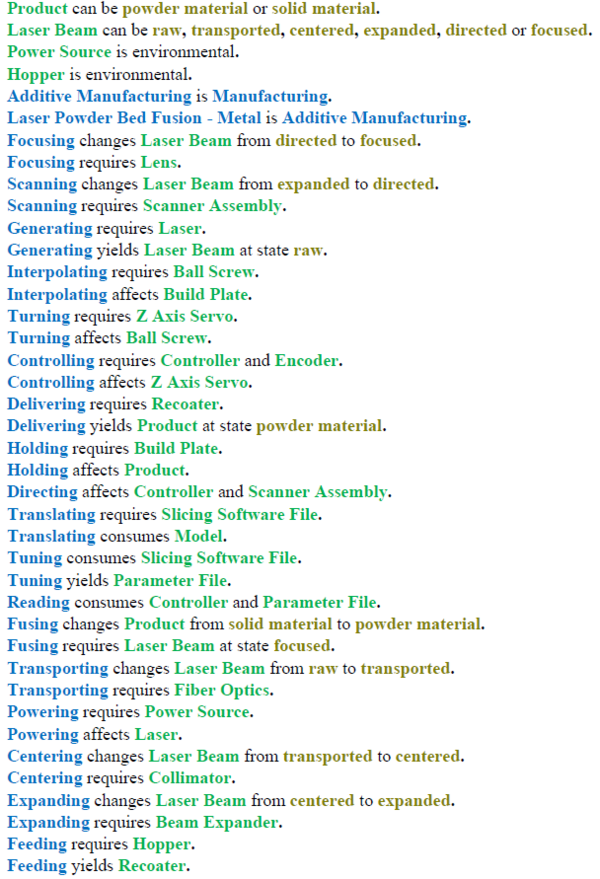
Figure: Object-Process-Diagram for LPBF-M
An Object-Process-Language (OPL) description of the roadmap scope is auto-generated and given below. It reflects the same content as the previous figure, but in a formal natural language.
Figure: Object-Process-Language for the LPBF-M OPM
Figures of Merit
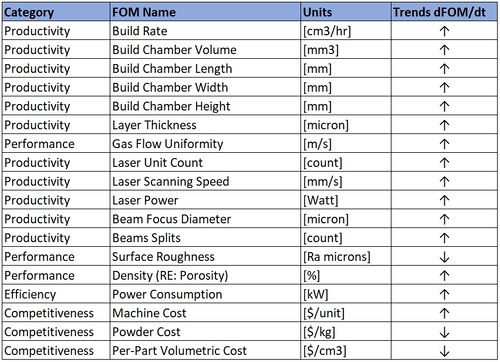
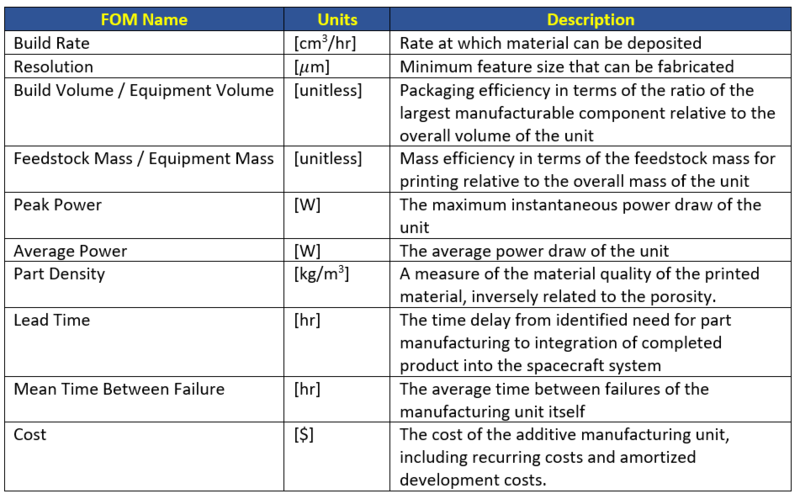
The table below shows a list of FOMs by which Laser Powder Bed Fusion – Metal, LPB can be assessed. For LPBF-M, the key FOMs for increased productivity are build rate (also called printing speed), build chamber volume, and layer thickness. Additional FOMs such as laser power, laser count, and laser scan speed play a critical role in productivity as well. FOMs on this list can be categorized into four types, productivity, performance, efficiency, and competitiveness. Most of these, including key FOMs, are explicitly related to productivity. Thus, productivity as a FOM would be a critical indicator to evaluate technological progress.
Figure: Primary figures of merit for the LPBF-M technology
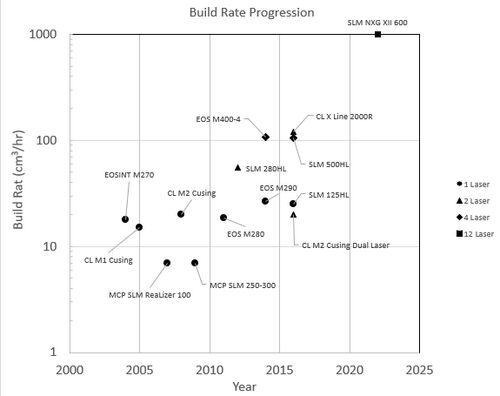
Figure: Build rate change over time. Printing speed has grown step-wise over the brief timeline of LPBF-M. Today's fastest commercial machines contain up to 12 lasers, have automation provisions for rapid changeovers, and are modularized for quick repairs. In addition to machine type, build rate varies by material, layer height, and machine parameter settings so the plotted data points are representative values. (Source: Machine manufacture datasheets)
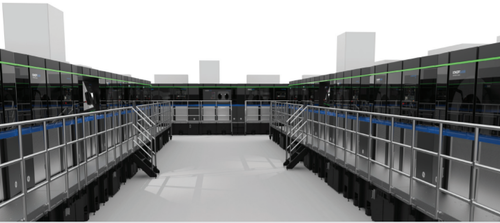
Figure: GE Additive's Concept Laser M Line system is highly modularized and scalable. (Source: GE Additive)
Alignment with Company Strategic Drivers[edit] In select sections of the roadmap, "3LPB" signifies a fictional company seeking to develop an improved LPBF-M machine.
The table below shows an example of strategic drivers and their alignment with 3LPB's Laser Powder Bed Fusion - Metal roadmap.
3LPB's roadmap is focused on meeting a wide variety of 3D printer needs, such as rapid prototyping and serial production applications, different surface qualities, and cost reduction by decreasing production time. By balancing the trade-off between surface roughness and time-to-build, and reducing production time and material costs on the part of the user, 3LPB hopes to meet the needs of a large number of users while achieving significant cost efficiencies and productivity improvements. As a result, 3LBP will be able to increase its penetration rate and significantly impact the productivity of each market on a national scale, contributing to stable and sustainable industrial growth regardless of labor shortages and economic conditions.
Positioning of Company vs. Competition
In select sections of the roadmap, "3LPB" signifies a fictional company seeking to develop an improved LPBF-M machine.
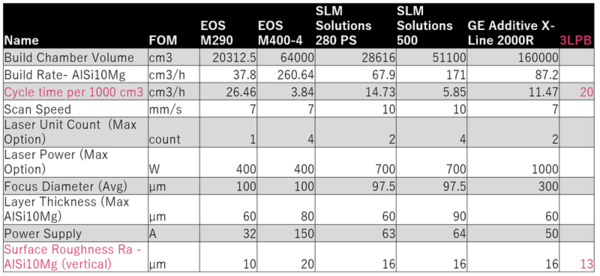
The following two figures are a table of the current competitive situation with key FOMs and a representation of our position and the situation of other companies in promoting the above strategy of 3LPB. Some key data/info is confidential, therefore it will be kept blank.
Table: Fictional company 3LPB's technical market positioning. (Source: Machine manufacture datasheets)
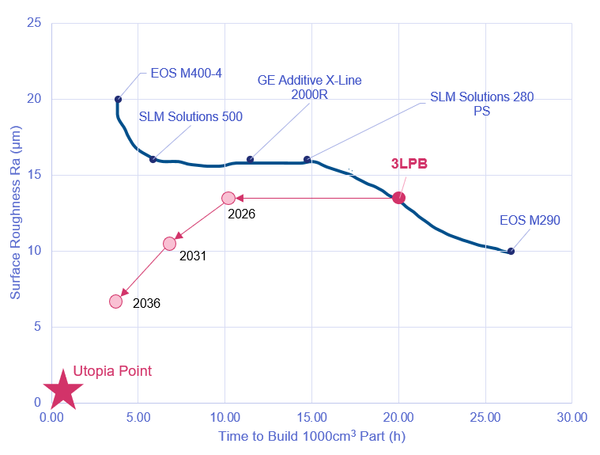
The following figure is the Pareto Front of Surface Roughness vs. Build Time for Various Additive Manufacturing Laser Powder Bed Fusion (Metal). Currently, 3LPB is right on the Pareto Front of the two FOMs; however By 2036 the company would like to achieve a surface roughness of less than 6 µm and a build time of 3 hours per 1000 cm³ part.
Figure: Current Pareto Front and fictional company 3LPB's intended destination. (Source: Machine manufacture datasheets)
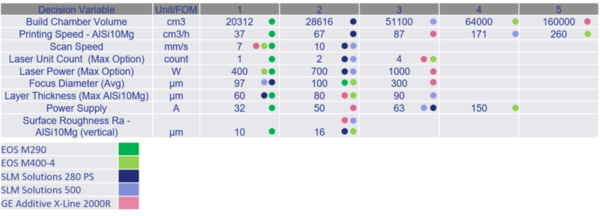
Technical Model[edit] In order to assess the feasibility of technical targets at the level of the 3LPB roadmap it is necessary to develop a technical model. The purpose of such a model is to explore the design tradespace and establish what are the active constraints in the system. The first step can be to establish a morphological matrix that shows the main technology selection alternatives that exist at the first level of decomposition, see the figure below.
Table: Technical Model: Morphological Matrix and Tradespace. (Source: Machine manufacture datasheets)
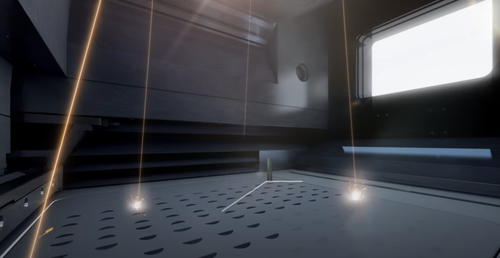
Figure: EOS M400-4 four laser system. The lasers can either be isolated to one laser per part (i.e. several small parts) or combined into multiple lasers per part (i.e. a large part). Use of more than one laser per part creates a visible seam line that can result in the need for real or perceived additional component validation. (Source: EOS)
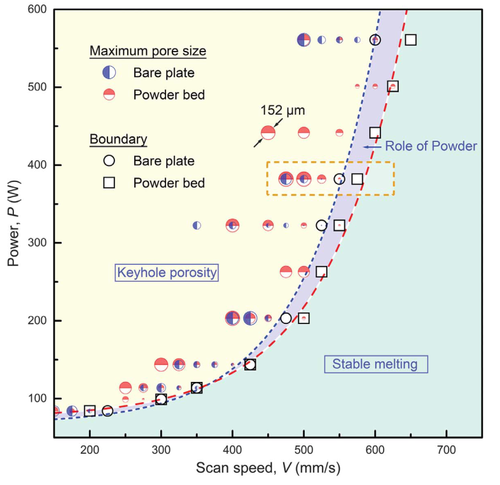
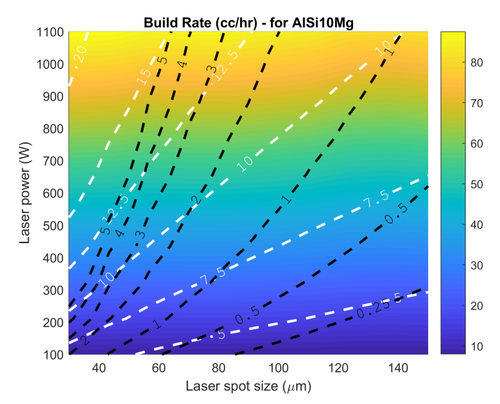
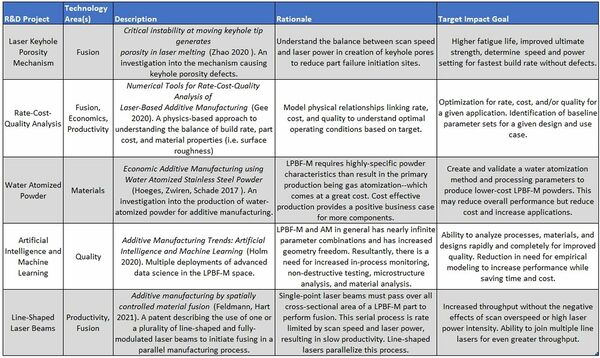
The relationship between the parameters of laser power, scan speed, and spot size, and outputs of porosity and surface roughness is viewed as a primary physics-based limiting factor (Zhao 2020, Gee 2020). This is investigated further below.
Figure: An exponential boundary is created for the threshold between stable melting and keyhole porosity in the Zhao study. Maximum power and speed--without increasing surface roughness beyond the acceptable specification--is the preferred operating window. (source: Zhao 2020)
Figure: Tradeoffs (or operating windows) for build rate as a function of laser power, spot size, scan speed. The color gradient is build rate, the black lines indicate scan speed, and the white lines can be ignored for this discussion. (source: Gee 2020)
Key Publications, Presentations and Patents
Fundamental Patents[edit]
US Patent 4863538
Date: 1989
Assignee: University of Texas
Method and apparatus for producing parts by selective sintering
The original utility patent for laser sintering powder bed polymer which expired in 2007 kicking off the revolution of 3D printing technology advancement.
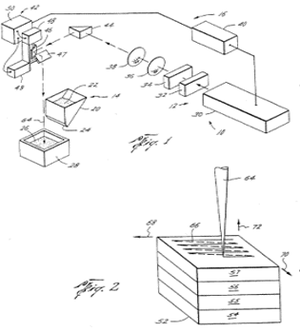
US Patent 5460758
Date: 1995
Assignee: EOS / 3D Systems
Method and apparatus for production of a three-dimensional object
The first metal laser sintering patent enabled by the work or EOS and the Fraunhofer Institute. As laser power increased, this would transform from sintering to fusing (welding). Expired in 2013, creating increased competition.
[File:EOSP.png|600px]]
State of the Art Patents
US Patent 10919090
Date: 2021
Assignee: Vulcanforms Inc.
Additive manufacturing by spatially controlled material fusion
This patent is for a LPBF-M machine with a plurality of modulated line-shaped laser systems that provide the potential to rapidly speed production and improve fusion.
[File:LINE4.png|600px]]
US Patent 10195693
Date: 2019
Assignee: Velo3D Inc.
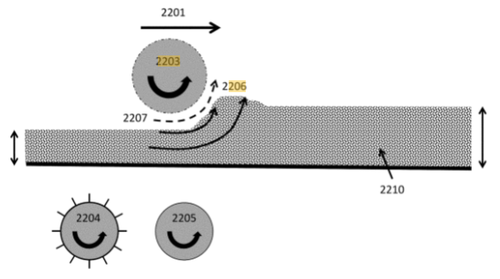
Apparatuses, systems and methods for three-dimensional printing
This patent describes low-impact recoating mechanisms like those used in the Velo3D Sapphire machine that prints with no or minimal supports, thereby reducing post-processing time and increasing productivity.
US Patent 10974456
Date: 2021
Assignee: Lawrence Livermore National Security LLC.
Additive manufacturing power map to mitigate defects
This patent includes methods for mapping laser power to select geometry for improved print quality via defect reduction. When implemented in-situ, this type of control mechanism offers significant potential in quality and productivity improvement.
US Patent 10583529
Date: 2020
Assignee: EOS Of North America Inc
Additive manufacturing method using a plurality of synchronized laser beams
This patent provides methods of using multiple laser beams and scanners in unison. Packaging and coordinating the optical systems is one of the greatest challenges of multi-laser systems. Intelligent packaging and control systems like that included in this patent will increase both quality and productivity.
Publications and Ongoing Research
These recent publications outline work being done at the forefront of LPBF-M technology.
Review of a Published Roadmap[edit]
Because there are no other publicly available roadmaps for LPBF-M, this review focuses on a straightforward project record or "roadmap" for additive manufacturing of HAYNES® 282® superalloy by laser beam powder bed fusion (PBF-LB) technology.
Source: ScienceDirect Materials and Design, Volume 204, 2021 Authors: Otto, et al
Subject: As noted, there is an absence of publicly-available roadmaps for LPBF-M. They certainly exist within the corporate knowledge banks of the machine OEMs and heavy users of the technology (i.e. Airbus, General Electric). In the absence of an exact math, a roadmap for the development of a difficult-to print nickel alloy (Haynes 282) has been selected. This superalloy has desirable mechanical and thermal properties but also has challenges that must be systematically overcome before deploying printed parts into the field. Challenges include surface crack, bulk cracks, porosity, and crystalline microstructure.
CAD model of fusion zone used for File:FEA.png
Key Inclusions:
Background on: general LPBF-M, past efforts via other printing technologies (EBM, DED), and the nickel alloy material Detailed descriptions of the physics-based parameters that affect build quality (hatch pattern, scan speed, chamber temp., etc.) Full list of the inspection equipment used to evaluate the printed specimen quality Standards used within the development process (i.e. ISO/ASTM XXXX) Detailed experimental setup Figures of merit specifically mentioned (volumetric energy density (J/cc) Digital modeling to predict material behavior Key publications used to generate the roadmap Graphical comparison of alternate possible solutions Overall roadmap structure. This document is less of a roadmap and more of an experimental report. While the methods used can be applied to other similar materials as a means of material parameter development, it is not sufficiently generalized to be considered useful in a broader sense. * Perhaps it could be considered a roadmap for the path traveled. OPM, DSM, other forms of system interaction Diagrams or photos for experimental setup. There are detailed text descriptions, but an image would convey the information without ambiguity.
Correlated Simulation and Benchmark File:Analysis.png Summary:
This was a highly-effective, well-executed experimental report. It provided clear and concise explanation of any required background information; and included rigorous technical detail and analysis. This could be used as a map or guide to developing future similar alloys, especially by the group conducting the experiment because the FE models they developed are correlated and ready to use WLOG. A high degree of care was taken to ensure the results were valid—with deep consideration on the DoE and testing methods. FOMs were specifically mentioned, with the focus being on laser volumetric energy density .png Financial Model[edit] In this section of the roadmap, "3LPB" signifies a fictional company seeking to develop an improved LPBF-M machine.
The financial model calculates the net present value (NPV) of the entire 3LPB project over 15 years. Since the financial information for this project does not already exist, the project direction from internal discussions is to use the financial information of Stratasys, a plausible case study within the industry, as a reference to create a parameterized financial model. Wherever possible, the inputs to the model are based on publicly available information, sometimes using as-is values, sometimes estimating the variability of parameters using approximate formulas, and in some cases making unsubstantiated estimates. 3LPB will analyze the impact on the financial model of focusing on R&D by preparing two cases: one that will serve as a baseline for the 3LPB to proceed with its financial and technological strategies as before, and the other in which the company invests more through R&D. Also, in order to perform this analysis in a more focused manner, some financial parameters are not considered.
Baseline Case
The assumption parameters used for 3LPB baseline case model are as below.
Revenue
- Initial sales is set as 521 million USD which is the sales of Stratasys in 2020. - Sales growth rate increases 17% for first 5 years, 12% for next 5 years and 8% for last 5 years by considering the slowing growth of the technology s-curve in the market. - Sales in each year increase based on sales growth rate.
Costs - R&D spending is set as 84 million USD which is the sales of Stratasys in 2020. - R&D Spending is calculated as sales multiplied by R&D spending per sales. The average investment is 16.1% of sales based on Stratasys data. - As for the baseline case, R&D spending growth rate is not considered, thus this is set as 0%. - SG&A expenses is set as 205 million USD which is the value of Stratasys in 2020. This expense in each year is calculated by multiplying SG&A expenses by SG&A expenses rate. SG&A expenses rate is set as -2.1% defined based on Stratasys data. Operating costs is set as 591 million USD which is the value of Stratasys in 2020. This cost in each year is calculated by multiplying operating costs by operating costs rate. Operating costs rate is set as -1.7% defined based on Stratasys data. A discount rate is defined as 8.76% based on Stratasys data. The detailed free cash flow balance sheet for the baseline case and the resulting performance financial model are shown below.
Financial Model Results in Baseline Case
The advantage is the excellent material efficiency of most additive manufacturing processes. While the scrap rate for many complex milled parts is over 90%, the scrap rate for LPBF-M parts is typically less than 5%.
With decreasing available raw materials and rising costs, this material efficiency will be a significant advantage in the long run. In the future, the introduction of high-speed systems with more powerful lasers and larger build chambers is expected to increase the share of LPBF-M in the production process, and a significant number of materials will become compatible with LPBF-M.
Design Structure Matrix (DSM) Allocation
The sentence will come here. The sentence will come here. The sentence will come here. The sentence will come here. The sentence will come here. The sentence will come here. The sentence will come here. The sentence will come here. The sentence will come here. The sentence will come here. The sentence will come here. The sentence will come here. The sentence will come here. The sentence will come here. The sentence will come here. The sentence will come here. The sentence will come here. The sentence will come here. The sentence will come here. The sentence will come here. The sentence will come here. The sentence will come here. The sentence will come here. The sentence will come here. The sentence will come here. The sentence will come here. The sentence will come here. The sentence will come here. The sentence will come here. The sentence will come here. The sentence will come here. The sentence will come here. The sentence will come here. The sentence will come here. The sentence will come here. The sentence will come here. The sentence will come here. The sentence will come here. The sentence will come here. The sentence will come here. The sentence will come here. The sentence will come here. The sentence will come here. The sentence will come here. The sentence will come here. The sentence will come here. The sentence will come here. The sentence will come here. The sentence will come here. The sentence will come here. The sentence will come here. The sentence will come here. The sentence will come here. The sentence will come here. The sentence will come here. The sentence will come here. The sentence will come here. The sentence will come here. The sentence will come here. The sentence will come here. The sentence will come here. The sentence will come here. The sentence will come here. The sentence will come here. The sentence will come here. The sentence will come here. The sentence will come here. The sentence will come here. The sentence will come here. The sentence will come here. The sentence will come here. The sentence will come here. The sentence will come here. The sentence will come here. The sentence will come here. The sentence will come here. The sentence will come here. The sentence will come here. The sentence will come here. The sentence will come here. The sentence will come here. The sentence will come here. The sentence will come here. The sentence will come here. The sentence will come here. The sentence will come here. The sentence will come here. The sentence will come here. The sentence will come here. The sentence will come here. The sentence will come here. The sentence will come here. The sentence will come here.
Roadmap Model using OPM
We provide an Object-Process-Diagram (OPD) of the 2LPBF-M roadmap in the figure below. This diagram captures the main object of the roadmap (Laser Powder Bed Fusion - Metal), its various instances including development projects, its decomposition into subsystems, its characterization by Figures of Merit (FOMs) as well as the main processes.
An Object-Process-Language (OPL) description of the roadmap scope is auto-generated and given below. It reflects the same content as the previous figure, but in a formal natural language.
Figures of Merit
The table below shows a list of FOMs by which Laser Powder Bed Fusion - Metal can be assessed. The sentence will come here. The sentence will come here. The sentence will come here. The sentence will come here. The sentence will come here. The sentence will come here. The sentence will come here. The sentence will come here. The sentence will come here. The sentence will come here. The sentence will come here. The sentence will come here. The sentence will come here. The sentence will come here. The sentence will come here. The sentence will come here. The sentence will come here. The sentence will come here. The sentence will come here. The sentence will come here. The sentence will come here. The sentence will come here. The sentence will come here. The sentence will come here. The sentence will come here. The sentence will come here. The sentence will come here. The sentence will come here. The sentence will come here. The sentence will come here. The sentence will come here. The sentence will come here.
Positioning of Company vs. Competition
We compared and organized the FOM from related/competitive companies. Some key data/info is confidential, therefore we will keep it blank.
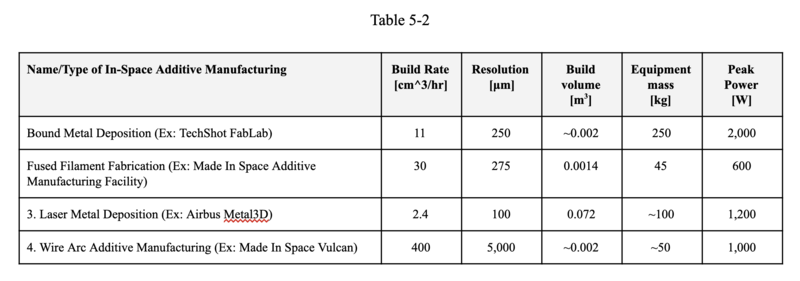
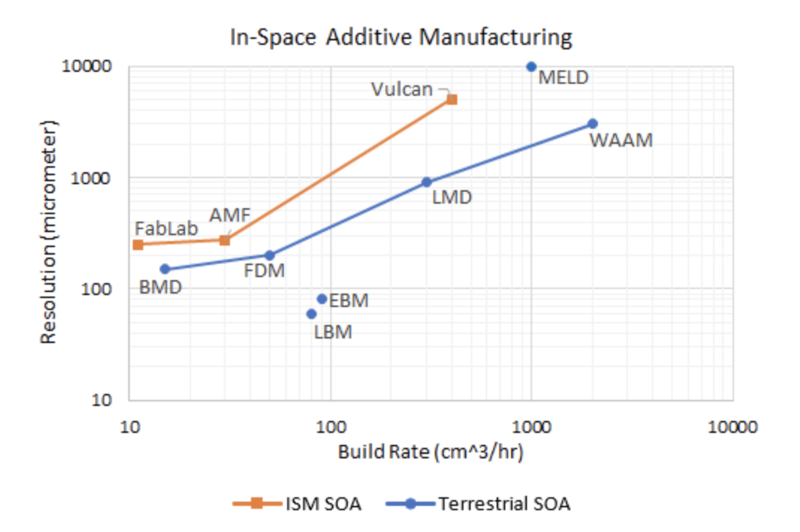
The following figure is the Pareto Front of Resolution vs. Build Rate for Various Additive Manufacturing Processes
The utopia point for the chart above is on the bottom right corner and at-present the Pareto front for Terrestrial SOA is closer to the utopia point than for ISM SOA. The parts which we will be manufacturing in space need to be of high quality and should have a reasonable manufacturing time. If the parts produced in space have a much lower resolution (higher micrometers) and have a low build rate (and consequently high build times and mean times to failure), then the manufactured parts may be unusable and provide minimal advantage over manufacturing on earth. The focus here is to shift the Pareto front for ISM SOA closer to the utopia point which can be achieved by maximizing resolution (lower micrometers) and build rate within reasonable limits. Working on improvements in both areas align with our strategic drivers and will help us achieve our goals within the target dates specified in the Technology Strategy Statement mentioned in the latter section.
While there are many technically feasible approaches to additive manufacturing of parts and systems, not all are adaptable to space. Present limitations for in-space manufacturing which contribute to the differences in the Pareto front for resolution and build rate include -
- Space systems engineering is a complex discipline with very mature methods of certification which results in the deployment of extensively tested apparatus. Due to the extensiveness of testing before sending it to space, AM technologies have been progressing faster for terrestrial applications.
- Current additive manufacturing systems deliver accurate and precise results in a 1 g, thermally controlled environment and are well understood. The same level of information is not available for ISM as there is much more testing for terrestrial AM due to less stringent certification methods.
- Current processes such as photolithography can create electric components at scales of 35 nanometers as compared to common AM resolution (>50 microns) which would produce components 1,000 times larger than the physical size of currently available parts. This disparity in performance discourages investment by organizations to conduct research in this area.
- Physics-based models of in-space additive manufacturing processes are needed to understand and predict material properties and help optimize material composition.
- The thermal effects of energy source and energy density in space has not yet been extensively researched.
- There is not enough investment in systems that produce open-system design, planning, simulation, and analysis tools for ISM.
- Design for and construction of objects in space will likely require much less mass, due to the reduced gravity, but it is difficult to predict the overall mass reduction and corresponding impact on construction time without knowing the resolution required and the impact of other environmental effects on the process.
- The impact of vacuum and thermal environments on the AM technology is not holistically understood due to a lack of data.
References:
