FemTech
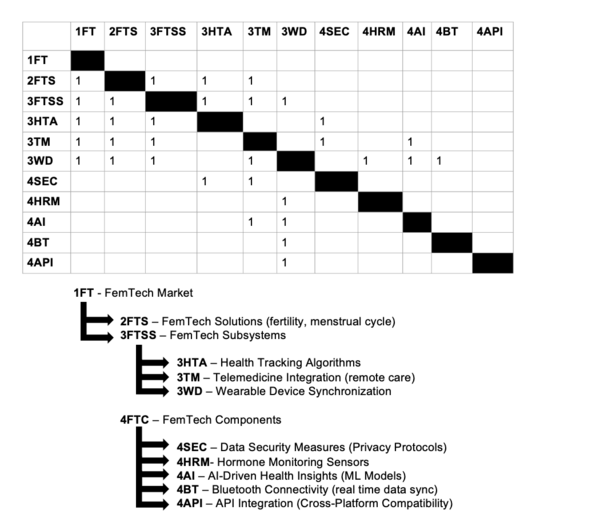
The FemTech (FT) market is a Level 1 roadmap, represents a rapidly expanding segment of the broader digital health market focused on Women's Health.Level 2 roadmaps focus on specific FemTech solutions, such as fertility tracking apps (Bable), menstrual cycle management platforms, pregnancy care, and menopause support technologies. Level 3 roadmaps delve into the subsystems within these solutions, including personalized health tracking algorithms, telehealth integration, and wearable device synchronization. Level 4 roadmaps focus on individual components such as data security measures, hormone monitoring sensors, and AI-driven health insights.
Technology Roadmap Overview
FemTech refers to a transformative category of technology designed to address a wide spectrum of health challenges, from reproductive health and pregnancy to chronic conditions and overall wellness.
Today, FemTech solutions are focused on empowering females through data-driven insights, providing personalized healthcare experiences that are accessible inclusive, and responsive to individual needs. By integrating advanced technologies such as Artificial Intelligence, telemedicine, and wearable health devices, FemTech platforms are revolutionizing the way females manage their health.
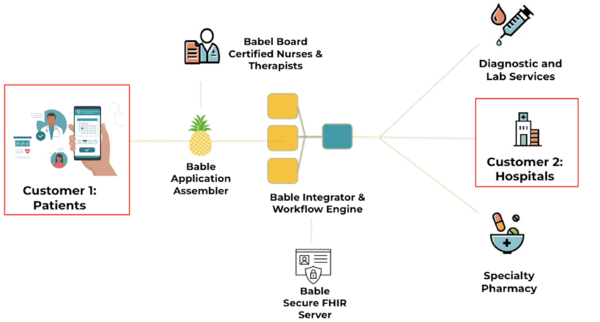
As part of this Technology Roadmap we are building a FemTech Digital Platform for patient navigation. See below for initial wireframe:
DSM Allocation
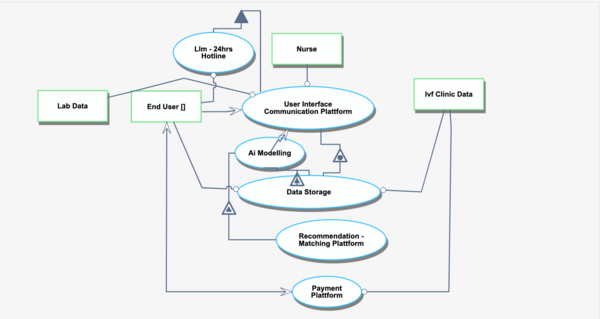
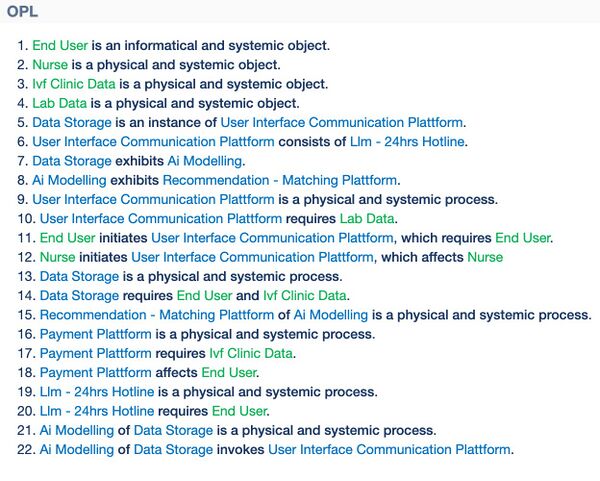
OPM Model
Below, we provide an object-process diagram (OPD) of the IVF Digital Platform roadmap. This diagram captures the main object of the roadmap, its decomposition into subsystems, its characterization by Figures of Merit (FOMs), as well as the main processes and actors involved.
Figures of Merit
This table outlines the key metrics for evaluating the performance and effectiveness of IVF Digital Platforms.
| Figure of Merit (FOM) | Unit | Description |
|---|---|---|
| Net Promoter Score | 0-10 scale | Measure the average NPS from patients and healthcare providers using the fertility AI platform. |
| Authentication Success Rate | % | Percentage of successful logins without errors. |
| Appointment Scheduling | Minutes | Time saved by patients when booking appointments. |
| Patient Follow Up | Minutes | Time saved due to automated reminders and check-ins. |
| Time Writing Clinical Notes | Minutes | Average reductio in documentation time. |
| Data Integration | Hours | Reduction in time to ingest third party diagnostic/lab data. |
| System Downtime | Seconds | Time the system is down, impacting patient access. |
| A/B Testing of Success Rate | % | Success rate improvement over a 3-year period after implementation. |
Alignment with Company Strategic Drivers
Our software platform enhances patient support through fertility treatments by focusing on three key strategic drivers:
| # | Strategic Driver | Alignment and Targets |
|---|---|---|
| 1 | To create value for users by increasing productivity | - Net Promoter Score (NPS): Target an average NPS of 8 or higher from patients and healthcare providers, indicating strong satisfaction and perceived value of productivity enhancements.
- Authentication Success Rate: Achieve a 99% authentication success rate to ensure efficient, reliable user access, which supports productivity. - Appointment Scheduling: Reduce appointment scheduling time by 50%, streamlining productivity and easing patient experiences. - Patient Follow-Up: Target a 30% reduction in time spent on patient follow-ups through automated reminders and check-ins, helping users focus on essential tasks. |
| 2 | To ensure the quality and accuracy of the generated outputs that users can trust | - A/B Testing Success Rate: Improve success rate by 10% over 3 years through continuous A/B testing, refining algorithm accuracy and trustworthiness.
- Data Integration: Target 2 hours per week saved in data ingestion, making third-party lab and diagnostic data integration faster and more reliable. - System Downtime: Limit system downtime to 30 seconds per month, maintaining continuous, dependable access that supports reliability and trust. |
| 3 | To deliver a seamless user experience with robust compatibility for business clients, ensuring smooth integration with other systems. | - Appointment Scheduling: Achieve 95% compatibility with third-party scheduling systems, enhancing integration and ease of use.
- Data Integration: Reduce time spent on data integration tasks by 50% through improved interoperability with other systems. - System Downtime: Target 99.9% system uptime, allowing a stable experience for users interacting across platforms. |
Positioning of Company vs. Competition
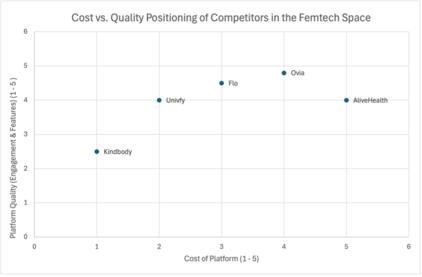
The figure below shows a comparative summary of digital health market competitors.
In our analysis of our technology against competitors, we initially aimed to use specific FOMs such as Data Breach Rate (DBR) and Average Response Time (ART) to provide a direct comparison of performance metrics that are critical for users in the femtech space. However, after review, we found that DBR and ART metrics for our competitors are not readily available through public sources. Unlike cost and feature quality, which can be inferred from published data, user reviews, or pricing models, DBR and ART metrics are often proprietary, sensitive information that companies do not disclose openly.
Given these limitations, we are unable to reliably gather accurate data for these specific FOMs across our competitor landscape. Therefore, attempting to compare Babble to competitors using DBR and ART would involve too much speculation, potentially leading to misleading conclusions. Instead, we will focus on readily available and inferable metrics such as Cost vs. Quality. This comparison allows us to provide a meaningful and transparent analysis of how Bable stands against competitors in terms of the value proposition—the balance between the cost of the platform and the quality of features and engagement it offers. By focusing on Cost vs. Quality, we can use data that is more publicly accessible, consistent, and reliable, ultimately providing a clearer picture of our positioning in the femtech space
Cost Scores (ranked 1-5) are determined based on available subscription rates, or in the case of Kindbody and Univfy, a more personalized cost structure.
Quality Scores (ranked 1-5) are based on user ratings from app stores, as well as qualitative feedback from reviews and the overall experience provided by each platform.
Cost Score (1-5):
1. Flo:
- Offers both free and premium tiers.
- Premium pricing is $7.99/month or $39.99/year
- This positions Flo in the mid-range, giving it a Cost Score of 3.
2. AliveHealth (Alive by Whitney Simmons):
- Pricing is higher at $14.99/month or $119.99/year.
- This justifies a Cost Score of 5 due to the premium pricing compared to others.
3. Ovia:
- Offers a free version with optional in-app purchases and employer-sponsored plans.
- Given the variability but availability of free features, Cost Score of 4 reflects its value relative to its market.
4. Kindbody:
- Provides personalized services, typically based on consultations, making upfront costs hard to determine.
- This variability and potential high cost give it a Cost Score of 1, indicating uncertainty.
5. Univfy:
- Like Kindbody, cost is personalized through clinic partnerships.
- Assign a Cost Score of 2 for being slightly more accessible but still highly personalized.
Quality Score (1-5):
1. Flo:
- With an iOS rating of 4.8/5 and Google Play 4.6/5, user satisfaction is very high.
- This warrants a Quality Score of 4.5.
2. AliveHealth:
- App Store rating of 4.9/5 indicates very strong user satisfaction, focusing on workout variety and motivation.
- Assign a Quality Score of 4.
3. Ovia:
- Very well-rated with 4.8/5 on the App Store.
- Due to positive reviews, assign a Quality Score of 4.8.
4. Kindbody:
- Lacks app-specific ratings and relies more on user feedback about clinic experience.
- Given the absence of direct app ratings and less broad use, a Quality Score of 2.5 reflects more mixed experiences.
5. Univfy:
- Focuses on clinic partnerships and a data-driven approach.
- Users appreciate predictive power, resulting in a Quality Score of 4.
Technical Model
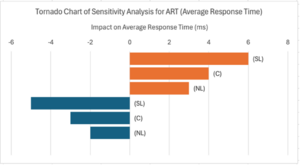
The tornado chart for ART highlights which variables have the most impact on the platform’s responsiveness. Based on our sensitivity analysis, the primary parameters influencing ART are System Load (SL), Server Capacity (C), and Network Latency (NL).The results show that:
- System Load (SL) has the highest impact on ART, indicating that as the number of concurrent users increases, response time can be significantly affected. This implies that managing server load efficiently, especially during peak usage times, will be crucial for maintaining optimal performance.
- Server Capacity (C) also plays a substantial role in reducing ART, suggesting that increasing server capacity or optimizing server allocation can enhance response efficiency.
- Network Latency (NL), while lower in impact compared to SL and C, still contributes to overall response delays. Minimizing latency by using faster network protocols or optimizing data routes can contribute to better user experience.
The primary takeaway is that managing system load is critical for maintaining fast response times, with server capacity also being a key leverage point. Investment in load balancing technologies and server scaling would therefore be prioritized for improving user satisfaction.
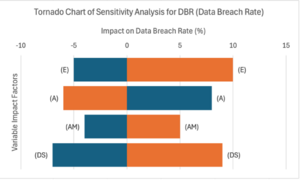
The tornado chart for DBR presents the sensitivity of data security concerning different variables, including Encryption Level (E), Access Frequency (A), Authentication Method (AM), and Data Storage (DS). The results indicate:
- Encryption Level (E) is the most sensitive factor affecting DBR, which means that stronger encryption protocols lead to a significantly reduced rate of data breaches. This reinforces the need for employing industry-standard encryption, such as AES-256, to protect sensitive user data.
- Access Frequency (A) also has a significant impact, where more frequent access points increase the risk of breaches. Implementing strategies to minimize exposure, such as limiting access to authorized users only or reducing unnecessary access frequency, is key.
- Authentication Method (AM) plays a pivotal role in enhancing security. Multi-Factor Authentication (MFA) is more effective in reducing DBR compared to single-factor methods.
- Data Storage (DS) impacts the risk depending on where and how data is stored. Utilizing encrypted cloud storage or secure on-premises databases can help mitigate risks associated with data breaches.
The analysis underscores the importance of using robust encryption and multi-factor authentication as primary defenses against data breaches. Additionally, limiting access frequency and securing storage can significantly improve the platform's security posture. This analysis can guide the prioritization of security measures to minimize breach risks effectively.
Based on the sensitivity analysis, it is evident that both performance (ART) and security (DBR) are influenced by distinct, yet interconnected factors. For ART, managing server capacity and load is critical to enhance the platform's responsiveness, while DBR is primarily determined by the robustness of encryption and access management protocols. These insights point towards an integrated approach to system optimization—where performance upgrades such as increased server capacity and load management should be complemented by security enhancements like improved encryption and access control to provide a reliable, secure experience for users.
We used the following variables for the Morphological Matrix and Tradespace Evaluation:
- Authentication Method (AM): Defines security level (MFA reduces breach likelihood more than SSO)
- Data Storage (DS): Encrypting data reduces breach risk compared to local caching
(Data Breach Rate) DBR = f (AM, DS, EL, AF)
- Encryption Level (EL): Higher levels exponentially decrease breach risk
- Access Frequency (AF): Higher frequency of access may increase breach probability
- Communication Channels (CC): Video requires more resources than text, influencing response time
- Data Storage (DS): Local caching provides faster access but may be less secure than centralized storage
(Average Response Time) ART = f (CC, DS, SL, SC)
- System Load (SL): More concurrent users increase response time
- Server Capacity (SC): Higher capacity improves response time
- DBR Model (Security Focus): DS affects breach risk based on security measures (ex: encryption vs. local storage).
- ART Model (Performance Focus): DS affects response time based on data retrieval speed (ex: local caching vs. remote database access).
R&D Projects
The R&D projects outlined below were chosen for their alignment with our FemTech strategic drivers and their contribution to key figures of merit. While not all projects have been prioritized for immediate investment, each is designed to deliver value and supports the objectives defined in earlier sections of this roadmap. The overarching goal of this roadmap is to enhance efficiency within the warehouse. Each project contributes to achieving this goal in a unique and meaningful way. To ensure continued alignment with market demands and competitive dynamics, project priorities will be reviewed and adjusted as necessary.
Additional Notes:
- TRL (Technology Readiness Level): Indicates the maturity of a technology, from 1 (basic principles observed) to 9 (proven operational capabilities).
- Additional investments like user training modules, continuous compliance updates, and cloud infrastructure optimization could be considered based on the platform's scale and roadmap.
| R&D Project | Technology Area & TRL | Description | Benefits | Challenges | Investment Decision |
|---|---|---|---|---|---|
| Integration with Clinics | System Integration (TRL 4-5) | Develop APIs and middleware to integrate the platform with EMR systems used by clinics. | * Streamlines data exchange, ensures seamless clinic-patient interactions. | * Variability in EMR standards, data security concerns, and compliance with healthcare regulations. | Yes |
| Access to Patient Data | Data Management (TRL 5-6) | Build secure frameworks to access and store patient data, ensuring HIPAA/GDPR compliance. | * Enables personalized care pathways and accurate reporting. | * Compliance with stringent data privacy laws and security risks. | Yes |
| Dual Authentication | Cybersecurity (TRL 6) | Implement two-factor authentication (2FA) for patients and clinical staff to enhance platform security. | * Strengthens user authentication and protects sensitive information. | * Usability concerns for less tech-savvy users, maintaining smooth onboarding processes. | Yes |
| Patient Front-End Development | UX/UI Design & Web Development (TRL 5-6) | Create an intuitive mobile and web interface for patients to access services and communicate with providers. | * SEnhances user experience, fosters engagement, and simplifies access to healthcare. | * Balancing usability with feature complexity. | Yes |
| Clinical Staff Front-End Development | UX/UI Design & Web Development (TRL 5-6) | *Develop a responsive dashboard for nurses and therapists to monitor and manage patient interactions. | * Streamlines clinical workflows, improves communication with patients. | * Adapting the interface for diverse clinical roles and workflows. | Yes |
| Workflow Automation Engine | Workflow Automation (TRL 4-5) | Develop a workflow engine to automate and streamline communication between all stakeholders (patients, staff, labs). | * Reduces manual workload. * Increases operational efficiency * Enables the ability for more advanced operations than navigation * Minimizes overall delays. |
* Managing exceptions and ensuring adaptability for varied use cases. | Yes |
| FHIR Server Implementation | Health IT Standards (TRL 6) | Implement a secure FHIR server to facilitate standardized data sharing across systems. | * Ensures interoperability and simplifies integration with labs and pharmacies. | * High setup and maintenance costs, ensuring compatibility with existing systems. | Yes |
| Integration with Diagnostic Labs | System Integration (TRL 4-5) | Build modules to automate lab order submission and result retrieval. | * Speeds up diagnostics, provides accurate tracking of patient lab results. | * Variability in lab systems and protocols. | Not right now The current platform is sufficient for the current application; once front end systems and security are in place we can integrate with Labs. |
Financial Model
Key Assumptions:
- Project Timeline: Define timeframes for each R&D project (e.g., 1–3 years).
- Cost Estimation: (1) Costs include personnel, software development, testing, and compliance requirements. (2) TRL-based estimates: Lower TRL projects typically incur higher costs due to increased uncertainty and effort.
- Phased Investments: Projects prioritized for immediate investment start earlier, with others phased in based on readiness and strategic importance.
- Market Impact: Benefits measured by cost reduction, efficiency gains, or improved patient and clinical outcomes.
- Contingencies: Include a percentage for unforeseen technical or regulatory challenges (e.g., 10–20%).
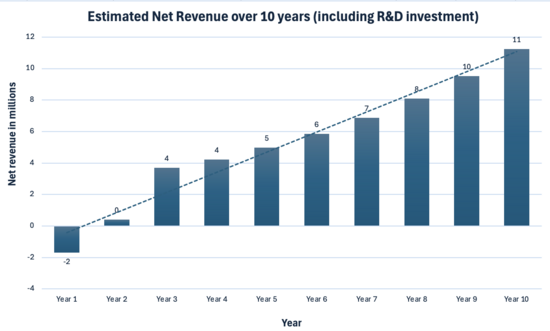
This chart illustrates the Estimated Net Revenue for this FemTech company over 10 Years, including the impact of R&D investments (see above) in the early years.
Year 1–2: Significant upfront R&D investments result in negative net revenue (-$2M in Year 1 and break-even by Year 2). Year 3: Net revenue turns positive as cumulative revenues surpass R&D costs, achieving break-even. Years 4–10: Sustained growth in patient subscriptions and hospital partnerships drives exponential revenue increases. By Year 10, net revenue reaches $11M annually, reflecting a strong return on the initial R&D investment. The dashed trend line highlights the steady upward trajectory of net revenue growth after the initial investment period, demonstrating the long-term profitability of the platform.
Technology Strategy Statement
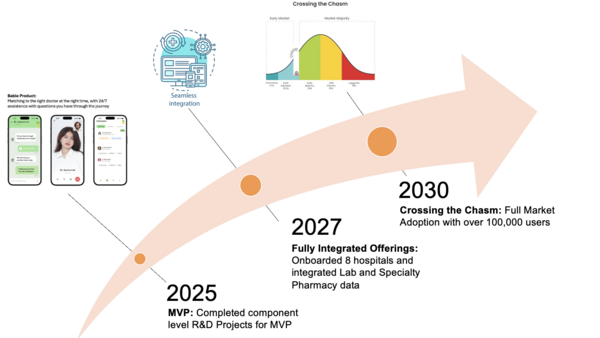
For reference, please see our summary of FemTech Navigation roadmap with swoosh chart showing future growth.
Key Patents and Publications
Chatbots:
- These patents demonstrate key trends in chatbot technology development, including Improving natural language processing and conversation abilities. The patents show ongoing innovation by major tech companies to make chatbots more capable, easier to develop, and applicable to a wider range of use cases.
Google's Patent (US9369410B2) - "Chatbots":
- Focuses on methods for operating and building chatbots using conversation data structures. Uses pattern matching and natural language processing techniques. Allows for dynamic node resolution to flexibly switch between conversation paths. The application is related to PCT Application Nos. PCT/AU2007/000912 and PCT/AU2007/000916, the content of which is incorporated herein by reference. (https://patents.google.com/patent/US9369410B2/en)
Microsoft's Patent - "Creating a conversational chatbot of a specific person"
- Describes a system to create chatbots that can mimic specific individuals, including deceased people. Uses images, voice data, social media posts, and other personal data to model a person's personality. Could potentially create 3D models for added realism
Google's Patent on Small Chatbots
- Aims to make chatbot development easier using "structured description-based" techniques
- Allows users to create fine-tuned chatbots for specific tasks using natural language inputs
- Provides a no-code solution for AI chatbot development
NCITE's Patent on Suspicious Activity Reporting Chatbot
- Designed to improve suspicious activity reporting processes
- Creates a responsive, conversational experience for users
- Collects more consistent and comprehensive information for authorities
US Patent 10,691,737B2 - "Chatbot Integration with Knowledge Base" (Microsoft)
- Focuses on integrating chatbots with knowledge bases to enhance their capabilities
US Patent 10,762,293B2 - "Chatbot Personality Adjustment" (IBM)
- Describes methods for dynamically adjusting chatbot personality based on user interactions
LLMs (Large Language Models):
- Transformer Architecture: "Attention Is All You Need" (2017) - The original paper introducing the transformer architecture.
- Large Language Models (LLMs): GPT series papers by OpenAI, including GPT-3 and GPT-4 technical reports.
- "BERT: Pre-training of Deep Bidirectional Transformers for Language Understanding" (2018) by Google.
- Liquid Neural Networks: "Liquid time-constant networks" by Hasani et al., published in Nature Machine Intelligence (2020)
- "Universal approximation with certified robustness through liquid neural networks" by Hasani et al., presented at AAAI (2021)
- Alternatives to Transformer Architecture: "Megalodon: A Large Context Model Leveraging Bidirectional Gated Attention" by Meta and USC researchers
- "Mamba: Linear-Time Sequence Modeling with Selective State Spaces" introducing the Mamba architecture
- "Hyena Hierarchy: Towards Larger Convolutional Language Models" by Poli et al., presented at ICML 2023
- Exploring LLM Capabilities: "Fluid Transformers and Creative Analogies: Exploring Large Language Models' Capacity for Augmenting Cross-Domain Analogical Creativity" by Ding et al. (2023)
