FSOC
Welcome to the Free-Space Optical Communications Technology Roadmap.
- Technology Roadmap Identified as 2FSOC - Free-Space Optical Communications
- This indicates a Level 2 Individual-Technology Level Roadmap. This page describes the functions, uses, history, present, and future development of Free Space Optical Communication.
Roadmap Overview
Free-space optical communication (FSOC) utilizes optical carriers in the visible and infrared (IR) spectrum to transmit information wirelessly. This combined spectrum is 2,000 times larger than that used in RF technologies. The narrow beam of the optical signal, along with FSOC's point-to-point architecture, enables energy-efficient and secure communication links. As 6G networks demand advancements in data rates, channel capacity, power efficiency, and low latency, FSOC emerges as a promising solution. This roadmap explores the implementation of coherent FSOC for next-generation wireless communications.
A FSOC communication link is established by a transmitter (Tx) terminal emitting data in the form of light waves through free space, and a receiver (Rx) terminal capturing the information. A communication link in which both terminals can communicate to one another is referred to as a full-duplex link, meaning that both terminals have the capability of transmitting and receiving information. The most commonly emitters used are emitting didoes (LEDs) or laser diodes (LDs). LEDs transmit light in all directions, making them less power efficient than LDs, which transmit coherent light with a set beam divergence. The light is detected at the receiver by photodetector (PDs) such as a photodiodes, avalanche photodiodes (APDs). The information is encoded in the optical signal through modulation. Common modulation schemes include: on-off keying (OOK), quadrature amplitude modulation (QAM), and pulse-position modulatoin (PPM). The modulation of the carrier phase can be detected by using an oscillator at the receiver. This is referred to as coherent FSOC, as opposed to direct detection FSOC.
The major challenge of deploying a FSOC link is to establish and maintain the link between the two terminals. The pointing acquisition and tracking (PAT) of a communication link ensures that light is incident on the receiver throughout operations.
Current research applications have shown the use of FSOC links for satellite communication, satellites to ground communication, and last mile communications. FSOC offers flexibility, security, and higher channel capacities to other wired and wireless communication alternatives.
Design Structure Matrix (DSM) Allocation
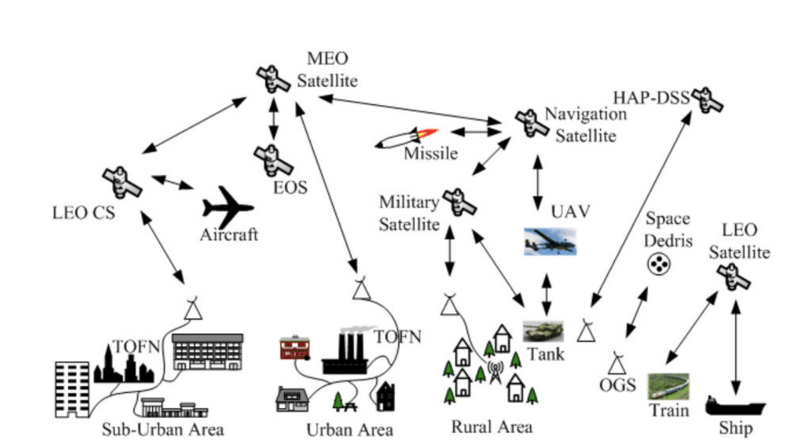
DSM Tree
This DSM tree was constructed for the FSOC technology in the context of larger wireless communication technologies.
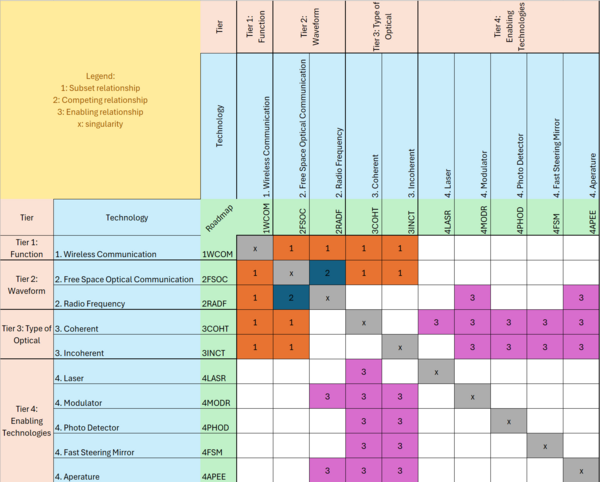
DSM Matrix
This DSM shows the relationships between FSOC and the most important technology roadmaps that are broader, competing, and enabling to FSOC.
Roadmap Model Using OPM
The Object-Process-Diagram (OPD) for FSOC visually represents the main functions and attributes of the technology which result in the transmission of data as light waves. The figures of merit (FOM) for the technology are also depicted on the OPD diagram. This diagram focuses on the main processes required to detect and communicate data. Pointing and signal generation are included as two key processes which enable the light to transmit encoded data, and to maintain the optical cross-link active.
The Object-Process-Language (OPL) presents the OPM in a list format to textually represent the dependencies between processes and attributes of the technology.
Roadmap Figures of Merit
Key FOMs
This table shows the key figures of merit used to quantify the progress of this technology over time.
The following graph contains information on trends for the main figure of merit we can trace through most communication systems: Data Rate. Whereas this graph focuses on FSOC technology, the use and mention of data rate comes as a way to quantify communication technology progress over time from centuries ago.
Alignment with Company Strategic Drivers
Free Space Optical Communication is a technology characterized by a set of goals, which can be boiled down to providing high rates of data transmission without the expense of data integrity or size, weight and power. The strategic drivers in this technology space are identified below, and the alignment of this roadmap is highlighted.
Positioning of Company vs. Competition
The following table created by NASA shows the current Laser Communication Terminals that exist in the market this roadmap is targeting.
This table shows previously mentioned Figures of Merit such as Data Rate, Mass, and Power. These are shown in the context of mission developer, platform, and launch date. The table also includes wavelength. Whereas this roadmap focuses on data rate, bit error rate, and SWaP, the table above allows us to highlight the common use of a 1550nm Wavelength, which is in the near infrared regime, which allows a lot of the players to use previously existing components from older fiber technology to carry out their innovative projects. In terms of data rate, mass, and power, the consensus seems to be a push for higher data rates. The following chart shows each player's position with respect to each of these figures of merit.
Before delving deeper into discussion, we must note that the plot shown above excludes TBIRD, which accomplished a whopping 200 Gbits of data rate with a mass of 3kgs and a power consumption of 100W. Compared to all the other players, this terminal was an outlier and is thus excluded from the plot. It remains however an interesting business case exploration, as one can question the usability cases of such high data rates with current infrastructures and integration capabilities available to the population.
The chart shows that the field of players seems to be divided amongst those who achieve higher data rates by incurring a higher weight penalty (being heavier) or by incurring a higher power penalty (using more power to function). This chart shows that amongst the main players, CubeCAT seems to be accomplishing the highest data rate with the lowest mass and power penalties, as mentioned in the previous section of this roadmap.
Technical Model
Morphological Matrix
A morphological matrix is shown for the technology introduced in the previous section. This generally outlines where different technologies lay in the given specific categories, and can be used as a tool to compare them.
Tradespace
FoM Trades and Design Space
The following tradespace graphs chart the data from existing optical terminals, outlined in the Positioning of Company vs. Competition. They show Data Rate (our key figure of merit) plotted against each Power and Mass. The gold star in the top left indicates the utopia point. Bit error rate and size information for many of these terminals could not be determined. Tradspace graphs omit MIT Lincoln Labs terminal called TBIRD because it is an extreme outlier in terms of data rate (200,000 Mbps), making the rest of the graph unreadable.
The distribution of terminals does not create a typical pareto frontier. This indicates that power and data rate are not a tradeoff. This is unlikely based on the analysis of the basic governing equations. Another explanation is that the lack of technical maturity in the optical terminal field means that terminals are not yet optimized for power consumption.
Similar to the Power vs Data Rate chart discussed above, there is not a strong pareto frontier in the Mass vs Data Rate tradespace. We expect that as optical terminals become more mature and commercially viable, a more typical tradeoff distribution will emerge. This is because terminals capable of transmitting at higher data rates will likely require larger and heavier components.
Sensitivity Analyses
A sensitivity analysis is carried out for channel capacity and BER (bit error rate). Channel capacity refers to the maximum Data Rate allowed in a given channel. The formula for channel capacity is as follows:
C = B · log2(1 + P/(EP · BW)),
where BW is the bandwidth of the system in Hz, EP is the energy per photon in Joules, and P is the optical power in Watts.
Channel capacity represents the maximum data rate of the FSOC technology. The BER for a FSOC link can be described using the equation:
The sensitivity analysis is carried out by taking the partial derivative of each FOM with respect to the parameter of interest. For channel capacity C, and bit error rate BER, the parameters differentiated over are P, and BW. For the BER partial derivatives,
The normalized percent change is then calculated by multiplying the partial derivative by a small change in the parameter of interest, and dividing it by the FOM’s response.
The percent change and tornado plots are calculated for a system with a BW of 10 MHz and a received optical power of 500e-9 W. These specifications correspond to a an optical loss of 70 dB, which is typical for links in the order of 1000's of kms.
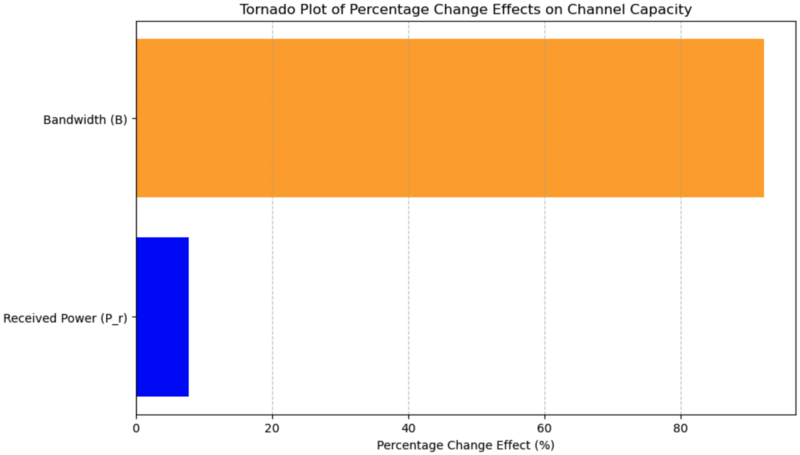
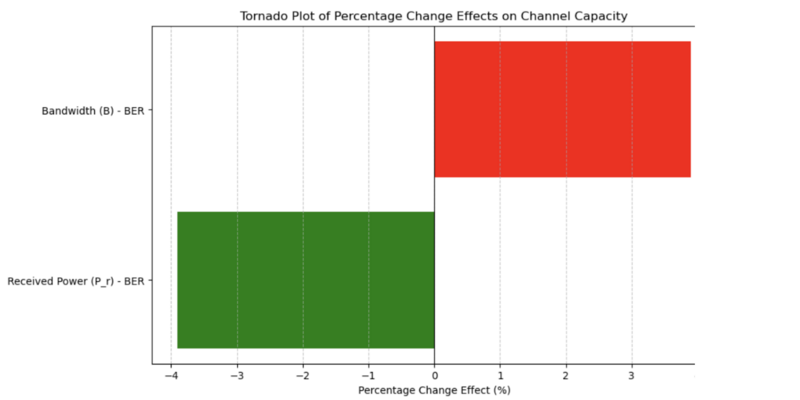
The Tornado charts are separated into two different tornado figures since BER and C vary at a different rate.
The first Tornado plot shows that the channel capacity is highly sensitive to BW. The second plot displays how the magnitude percent change for BER is the same both for BW and for received power.
Financial Model
Overview: This model estimates cash flows for an FSOC terminal project that includes development, manufacturing, and selling terminals over 20 years from 2024-2044. By applying a discount rate to all projected expenses and incomes, the net present value of the whole project is determined.
The following assumptions help us project the analysis over time: - Discount rate: 8% - Initial development Budget: $3M over 3 years - Annual budget for additional improvements: $125,000 - Initial Production Cost (per terminal): $300,000 - Learning rate (logarithmic reduction in production costs): 82.3% - Sales growth: 30% per year - Terminals sell for $75,000 each - Terminals are easily adaptable for terrestrial or space applications
The following financial model shows the first 4 years and the last 2 years included in the analysis for conciseness.
The model assumes that production costs per unit will decrease substantially as the manufacturing infrastructure and process is developed. This change over time is depicted in the following figure.
This model also assumes that sales growth will increase at 30% per year due to the effectiveness of technology and proliferation of space systems, shown by the exponential growth in terminals produced/sold per year.
Due to development costs and high initial cost of production per unit, the project will not be profitable early on. As sales increase and per unit production cost decreases, the profitability of the project increases drastically. Although this project is definitely a long term pay back, the NPV is positive and establishing our company in the optical terminal market will pay off in the years after the financial model ends. The following graph depicts the profitability of the company over time.
List of R&D Projects
Free Space Optical Communication is an evolving field with many players developing the technologies in all possible directions. The main projects focus on data rate, power consumption, and affordability optimization. In the research and development there are many players of interest that can be highlighted. An overview of the most interesting and relevant projects taking place currently in an R&D capacity for FSOC technology are shown in the following table.
Key Publications and Patents
Publication Review
Free-space optical communication (FSOC) terminals transmit data across a line-of-sight (LOS) path via light waves. The main components of the technology are the emitter light source, the free space optics, the photodetector receiver optics, and the steering mechanism used to align both terminals. FSOC is used in space, terrestrial, and underwater applications. The most common use cases currently are inter-satellite crosslinks, downlinks to ground stations on Earth, and uplinks from ground stations to space. The lack of atmospheric disturbances makes propagation losses negligible in space, which explains the recent boom in inter-satellite crosslinks. However, clear wind turbulence, precipitation, clouds, and scattering pose challenges when deploying FSOC systems in terrestrial or underwater environments. The Consultative Committee for Space Data Systems published the “Orange Book” to standardize the practice of optical communications, covering everything from the coding and synchronization schemes applied at specific wavelengths to various fine and coarse pointing acquisition and tracking techniques[4]. The Orange Book should be referenced during the development of FSOC terminals to aid in designing the system’s architecture.
The current state of FSOC is described by Toyoshima, who presents the evolution of RF communication technologies and the data limitations this technology will face due to a crowded spectrum[5]. The paper introduces the advantages in SWaP and channel capacity when using FSOC as an alternative to typical RF, as well as the different agencies and countries involved in the development of FSOC technology demonstrators. Different mission architectures and communication schemes are discussed as well as the direction in which the technology is currently going. This offers an introduction to the joint effort space agencies around the world are making to implement FSOC in space .
Similarly to Toyoshima, Chow et. al. present the advantages and technology architecture of optical wireless communications[6]. Both Toyoshima and Chow agree that the implementation of optical wireless communication is the key to enabling higher channel capacities and avoiding the current limitations of RF. This paper mentions novel technologies used for beam steering as well various standardizations, challenges, and perspectives of the technology. This paper focuses on the application of optical wireless communication not just in space, but also on Earth.
Patent Review
Patent: " Free Space Optical Communication "
Patent #: US 7,920,794 B1
Date of Patent: Apr. 5 2011
CPC Classification: NA
International Classification: H04B 10/00
US Classification: 398/125; 398/129; 398/122
The US 7,920,7941 B1 Patent filed in Apr. 5th, 2011 by the Lockheed Martin Corporation describes the use of a FSOC system for communications between ground stations and planes. This patent describes a system with a standard transmit (1550nm), beacon (850nm), and receive architecture. The key challenge that this patent addresses is implementing a pointing acquisition and tracking sequence via feedback from a quadrant photodetector to establish and maintain a crosslink between the ground station and the plane during flight.
Patent: " Method and Apparatus for Omnidirectional Optical Communication "
Patent #: US 10,581,525 B2
Date of Patent: Mar. 3, 2020
CPC Classification: H04B 10/118; G01S 3/782; G02B 26/0833
International Classification: H04B 7/185
US Classification: H04B 10/118 ( 2013.01 ) ; GOIS 3/782
( 2013.01 ) ; G02B 26/0833 ( 2013.01 ) ; H04B
7/18502 ( 2013.01 ) ; H04B 10/27 ( 2013.01 )
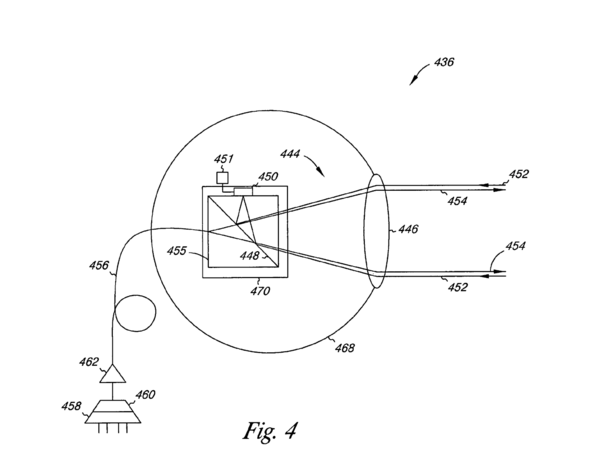
On the other hand, the more recent US 10,581,525, B2 patent addresses the PAT challenge between communication terminals by implementing an omnidirectional receive and transmit optical bench. The multifaceted structure shown in Figure 1 can receive and transmit data from multiple angles. This innovative solution allows for simultaneous communication to multiple terminals as well as decreased constraints on the pointing requirements for the satellite BUS.
Technology Strategy Statement
Free Space Laser Communication (FSOC) brings reliable communication strategies to remote areas, including outer space but also areas on earth where laying down fiber optic cables, or using radio frequency communication is not an option. FSOC does not only aim to improve communication reliability but also accessibility for populations living in remote, low-resource areas.
In 2024, FSOC is entering the communication market as a solution for remote areas. We expect this technology to become reliable, and widely accessible in the upcoming decade, with it dominating the market by 2035. Furthermore, we expect to see most communication to be carried out by free-space optical technologies due to the ease-of-installation, and affordability in the future, with Radio Frequency options being pushed out of the market completely by 2040. We expect Optical Communication to continue to co-exist with wired fiber optics technology, as the current infrastructure would remain viable in places where it's already established as a working system.
This Roadmap highlights the ways in which the FSOC technology has come to exist, and how it has evolved over time to become a realistic and competitive option for the future of communications. The following Swoosh chart depicts the future of FSOC technology visually.
Citations
[1] Chow, Chi-Wai. "Recent advances and future perspectives in optical wireless communication, free space optical communication and sensing for 6G." Journal of Lightwave Technology 42.11 (2024): 3972-3980.
[2] Raj, Arockia Bazil, and Arun K. Majumder. "Historical perspective of free space optical communications: from the early dates to today's developments." Iet Communications 13.16 (2019): 2405-2419.
[2] NASA. State-of-the-Art of Small Spacecraft Technology: 9.0 communications. https://www.nasa.gov/smallsat-institute/sst-soa/soa-communications/
[3] Optical High Data Rate (HDR) Communication 1550 nm. CCSDS 141.10-O-1 ed., The Consultative Committee for Space Data Systems, 2022, https://public.ccsds.org/Pubs/141x10.pdf.
[4] Toyoshima, Morio. "Recent trends in space laser communications for small satellites and constellations." Journal of Lightwave Technology 39.3 (2021): 693-699.
[5] Chow, Chi-Wai. "Recent advances and future perspectives in optical wireless communication, free space optical communication and sensing for 6G." Journal of Lightwave Technology 42.11 (2024): 3972-3980.
[6] Background Image Inspiration: https://news.viasat.com/newsroom/viasat-debuts-mercury-expeditionary-free-space-optical-communications-terminal

