Smart 3D Cameras
Work in Progress
Technology Roadmap Sections and Deliverables
The Smart 3D Camera roadmap is a level 2 roadmap as it enables the level 1 roadmaps for autonomous navigation of robots, drones and cars.
- 2S3DC - Smart 3D Camera
Roadmap Overview
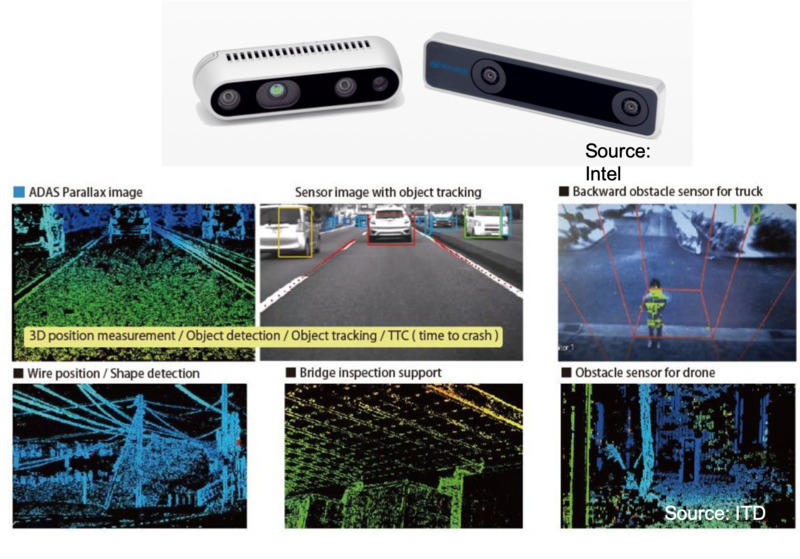
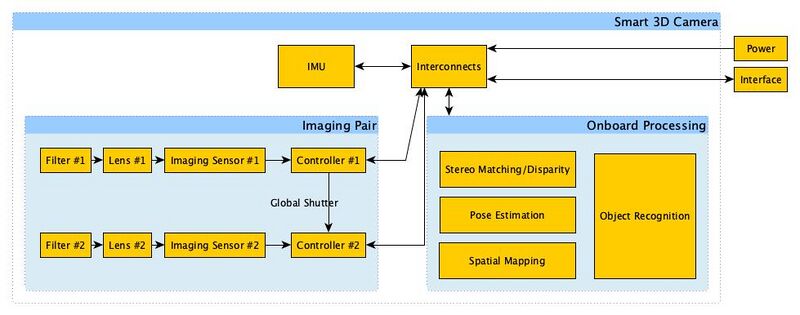
Smart 3D Cameras use a pair of identical optical imaging sensors and IR projectors (in certain use-cases) to capture stereo images of the environment. These images are then processed to calculate the disparity and then extract depth information for all pixels. In addition to the depth map, the scene is segmented to extract objects of interest and to identify them using training neural nets. Note that this roadmap will focus on passive stereo vision cameras that DO NOT use structured light.
Design Structure Matrix (DSM) Allocation
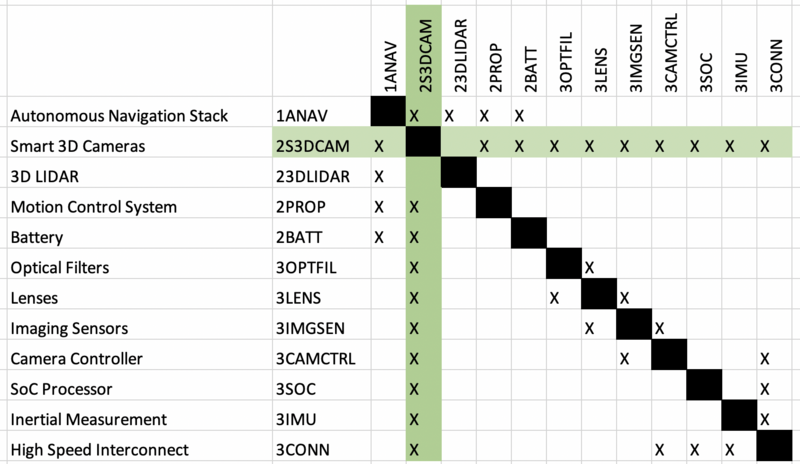
The 2S3DCAM roadmap is part of the larger company effort to develop an autonomous navigation stack as it enables 1ANAV.
The following tree can be discerned: 1ANAV
- 2S3DCAM
- 3OPTFIL
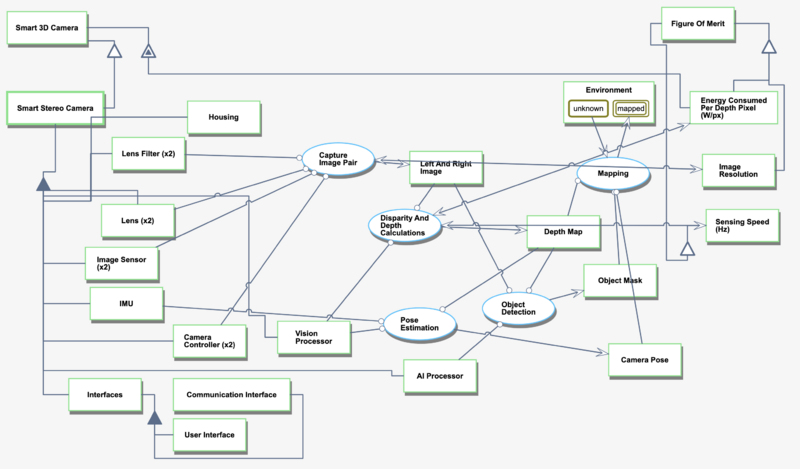
Roadmap Model using OPM
Figures of Merit
| Figure of Merit | Units | Description |
|---|---|---|
| Million Disparity Estimations Per Second (MDE/s) (10^6) | - | Comparison metric defined as:
MDE/s = Image resolution * disparities * sensing speed |
| Power Consumption | Watts (W) | Power consumed by the entire stereo camera and image processing pipeline to produce a depth map |
| Image resolution | Pixel (px) | Number of pixels in the captured image |
| Range (m) | m | The maximum sensing distance |
| Accuracy (m) | m | The measuring confidence in the depth data point |
| Sensing Speed (fps or Hz) | fps or Hz | The scanning frame rate of the entire system |
| Depth Pixels (px) | px | The number of data points in the generated depth map |
| Cost ($) | $ | The commercial price for a customer, at volume |
| Energy Consumed per Depth Pixel, E_dpx | W/px | The total power consumed by the sensing and processing pipeline divided by the number of depth pixels |
Besides defining what the FOMs are, this section of the roadmap should also contain the FOM trends over time dFOM/dt as well as some of the key governing equations that underpin the technology. These governing equations can be derived from physics (or chemistry, biology ..) or they can be empirically derived from a multivariate regression model. The table below shows an example of a key governing equation governing (solar-) electric aircraft.
Alignment with Company Strategic Drivers
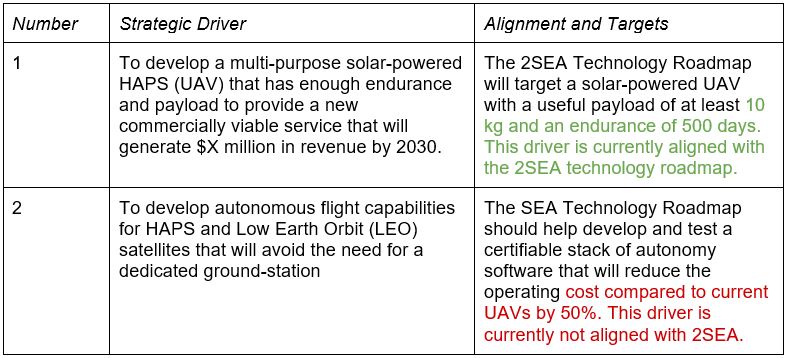
The table below shows an example of potential strategic drivers and alignment of the 2SEA technology roadmap with it.
The list of drivers shows that the company views HAPS as a potential new business and wants to develop it as a commercially viable (for profit) business (1). In order to do so, the technology roadmap performs some analysis - using the governing equations in the previous section - and formulates a set of FOM targets that state that such a UAV needs to achieve an endurance of 500 days (as opposed to the world record 26 days that was demonstrated in 2018) and should be able to carry a payload of 10 kg. The roadmap confirms that it is aligned with this driver. This means that the analysis, technology targets, and R&D projects contained in the roadmap (and hopefully funded by the R&D budget) support the strategic ambition stated by driver 1. The second driver, however, which is to use the HAPS program as a platform for developing an autonomy stack for both UAVs and satellites, is not currently aligned with the roadmap.
Positioning of Company vs. Competition
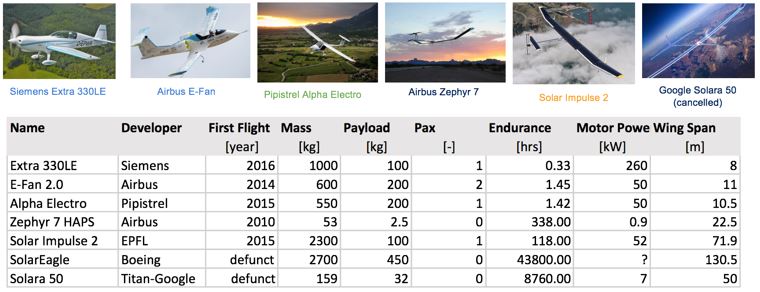
The figure below shows a summary of other electric and solar-electric aircraft from public data.
The aerobatic aircraft Extra 330LE by Siemens currently has the world record for the most powerful flight certified electric motor (260kW). The Pipistrel Alpha Electro is a small electric training aircraft which is not solar powered, but is in serial production. The Zephyr 7 is the previous version of Zephyr which established the prior endurance world record for solar-electric aircraft (14 days) in 2010. The Solar Impulse 2 was a single-piloted solar-powered aircraft that circumnavigated the globe in 2015-2016 in 17 stages, the longest being the one from Japan to Hawaii (118 hours).
SolarEagle and Solara 50 were both very ambitious projects that aimed to launch solar-electric aircraft with very aggressive targets (endurace up to 5 years) and payloads up to 450 kg. Both of these projects were canceled prematurely. Why is that?
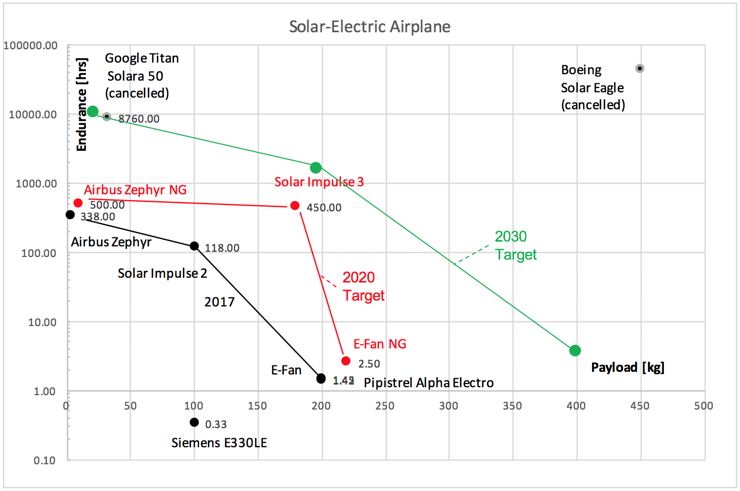
The Pareto Front (see Chapter 5, Figure 5-20 for a definition) shown in black in the lower left corner of the graph shows the best tradeoff between endurance and payload for actually achieved electric flights by 2017. The Airbus Zephyr, Solar Impulse 2 and Pipistrel Alpha Electro all have flight records that anchor their position on this FOM chart. It is interesting to note that Solar Impulse 2 overheated its battery pack during its longest leg in 2015-2016 and therefore pushed the limits of battery technology available at that time. We can now see that both Solar Eagle in the upper right and Solara 50 were chasing FOM targets that were unachievable with the technology available at that time. The progression of the Pareto front shown in red corresponds to what might be a realistic Pareto Front progression by 2020. Airbus Zephyr Next Generation (NG) has already shown with its world record (624 hours endurance) that the upper left target (low payload mass - about 5-10 kg and high endurance of 600+ hours) is feasible. There are currently no plans for a Solar Impulse 3, which could be a non-stop solar-electric circumnavigation with one pilot (and an autonomous co-pilot) which would require a non-stop flight of about 450 hours. A next generation E-Fan aircraft with an endurance of about 2.5 hours (all electric) also seems within reach for 2020. Then in green we set a potentially more ambitious target Pareto Front for 2030. This is the ambition of the 2SEA technology roadmap as expressed by strategic driver 1. We see that in the upper left the Solara 50 project which was started by Titan Aerospace, then acquired by Google, then cancelled, and which ran from about 2013-2017 had the right targets for about a 2030 Entry-into-Service (EIS), not for 2020 or sooner. The target set by Solar Eagle was even more utopian and may not be achievable before 2050 according to the 2SEA roadmap.
Technical Model
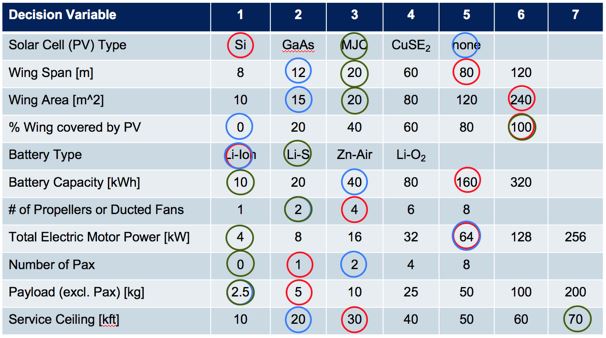
In order to assess the feasibility of technical (and financial) targets at the level of the 2SEA roadmap it is necessary to develop a technical model. The purpose of such a model is to explore the design tradespace and establish what are the active constraints in the system. The first step can be to establish a morphological matrix that shows the main technology selection alternatives that exist at the first level of decomposition, see the figure below.
It is interesting to note that the architecture and technology selections for the three aircraft (Zephyr, Solar Impulse 2 and E-Fan 2.0) are quite different. While Zephyr uses lithium-sulfur batteries, the other two use the more conventional lithium-ion batteries. Solar Impulse uses the less efficient (but more affordable) single cell silicon-based PV, while Zephyr uses specially manufactured thin film multi-junction cells and so forth.
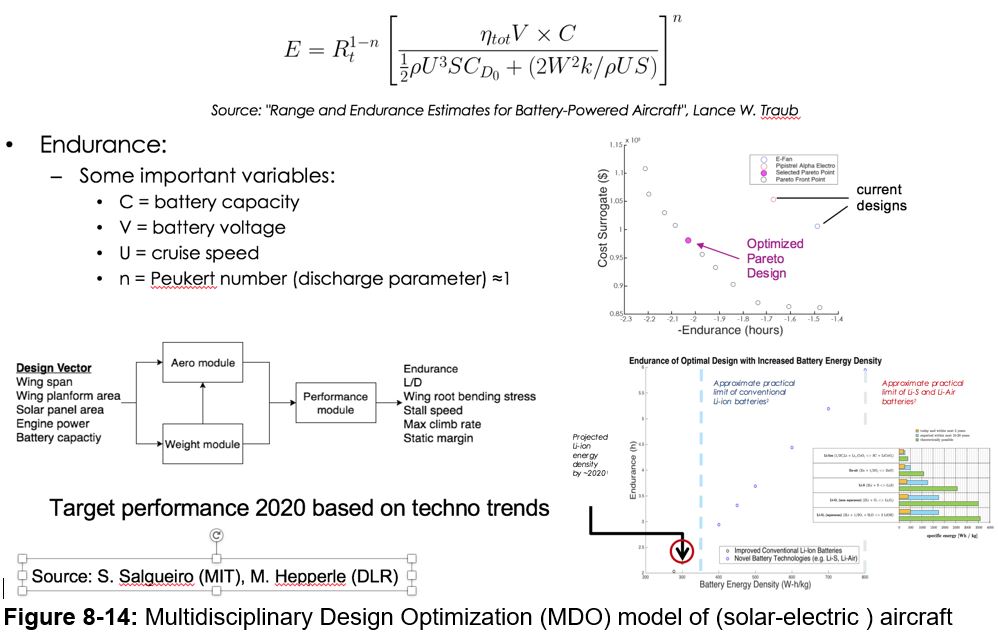
The technical model centers on the E-range and E-endurance equations and compares different aircraft sizing (e.g. wing span, engine power, battery capacity) taking into account aerodynamics, weights and balance, the performance of the aircraft and also its manufacturing cost. It is important to use Multidisciplinary Design Optimization (MDO) when selecting and sizing technologies in order to get the most out of them and compare them fairly (see below).
Financial Model
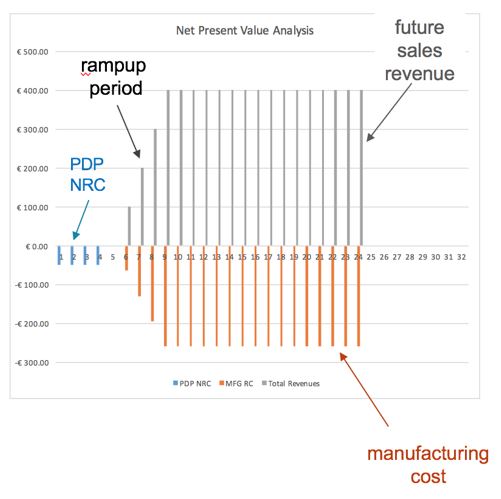
The figure below contains a sample NPV analysis underlying the 2SEA roadmap. It shows the non-recurring cost (NRC) of the product development project (PDP), which includes the R&D expenditures as negative numbers. A ramp up-period of 4 years is planned with a flat revenue plateau (of 400 million per year) and a total program duration of 24 years.
List of R&T Projects and Prototypes
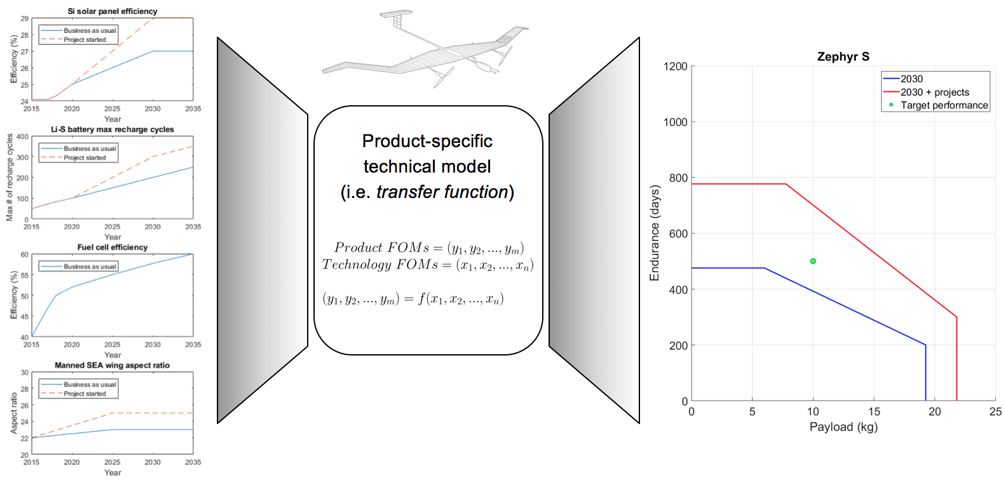
In order to select and prioritize R&D (R&T) projects we recommend using the technical and financial models developed as part of the roadmap to rank-order projects based on an objective set of criteria and analysis. The figure below illustrates how technical models are used to make technology project selections, e.g based on the previously stated 2030 target performance and Figure 8-17 (see the Chapter 8 of the text) shows the outcome if none of the three potential projects are selected.
Key Publications, Presentations and Patents
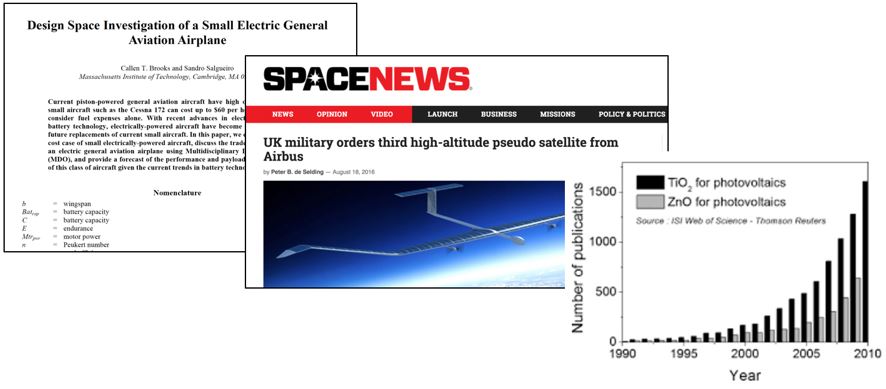
A good technology roadmap should contain a comprehensive list of publications, presentations and key patents as shown in Figure 8-19. This includes literature trends, papers published at key conferences and in the trade literature and trade press.
Technology Strategy Statement
A technology roadmap should conclude and be summarized by both a written statement that summarizes the technology strategy coming out of the roadmap as well as a graphic that shows the key R&D investments, targets and a vision for this technology (and associated product or service) over time. For the 2SEA roadmap the statement could read as follows:
Our target is to develop a new solar-powered and electrically-driven UAV as a HAPS service platform with an Entry-into-Service date of 2030. To achieve the target of an endurance of 500 days and useful payload of 10 kg we will invest in two R&D projects. The first is a flight demonstrator with a first flight by 2027 to demonstrate a full-year aloft (365 days) at an equatorial latitude with a payload of 10 kg. The second project is an accelerated development of Li-S batteries with our partner XYZ with a target lifetime performance of 500 charge-discharge cycles by 2027. This is an enabling technology to reach our 2030 technical and business targets.
