In-Space Additive Manufacturing
Technology Roadmap Sections and Deliverables
The clear and unique identifier for this technology roadmap is:
- 2ZGAM - Zero Gravity Additive Manufacturing
This indicates that we are dealing with a “level 2” roadmap at the specific implementation level (see Fig. 8-5), where “level 1” would indicate the over branching roadmap and “level 3” or “level 4” would indicate an individual technology roadmap.
Roadmap Overview
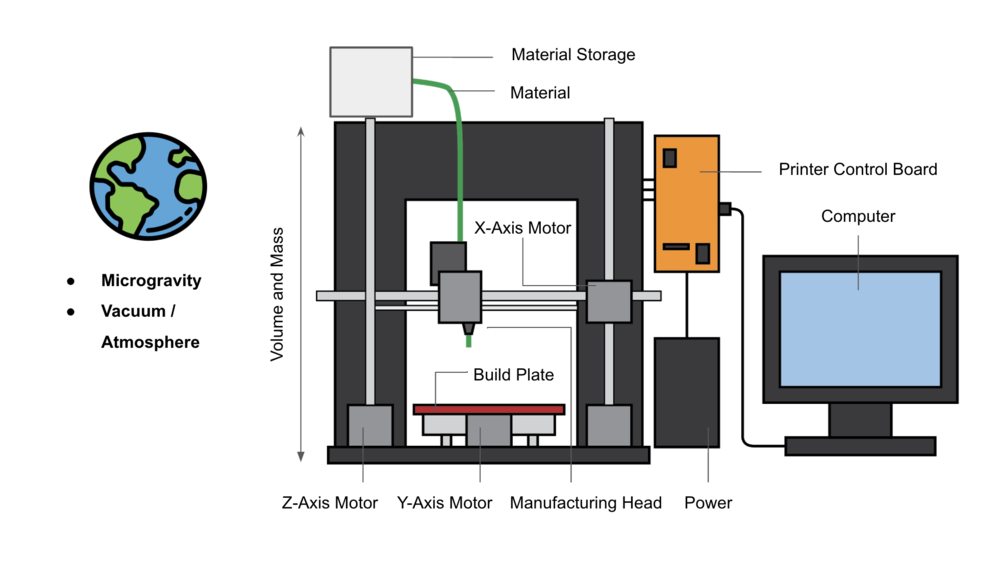
The working principle and architecture of in-space additive manufacturing is depicted in the below.
In-space additive manufacturing involves the fabrication, assembly, and integration of components beyond Earth’s atmosphere. Technologies in this area focus on fabricating a product with improved performance or reduced cost compared to existing Earth-fabricated products using manufacturing equipment with a rapid production rate, long life, and low size, weight, and power (SWaP). The additive manufacturing units use the layer-wise deposition of material to build up required component geometries. The energy source for the addition of material can either be mechanical, thermal, electrical, or chemical. For in-space additive manufacturing to prove viable, it must be possible to fabricate a variety of components in the required materials and geometries while meeting requirements on tolerances, surface roughness, and lead time. The reference case in the technology roadmap is the manufacturing of spare parts for a roundtrip Mars mission.
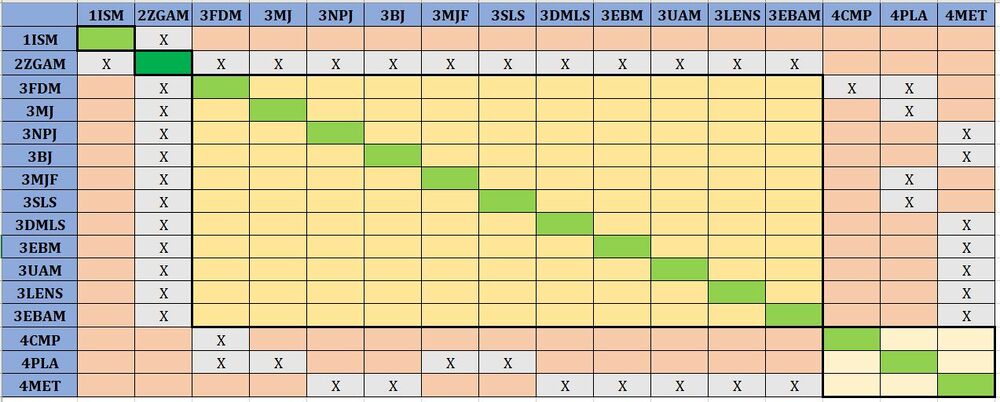
Design Structure Matrix (DSM) Allocation
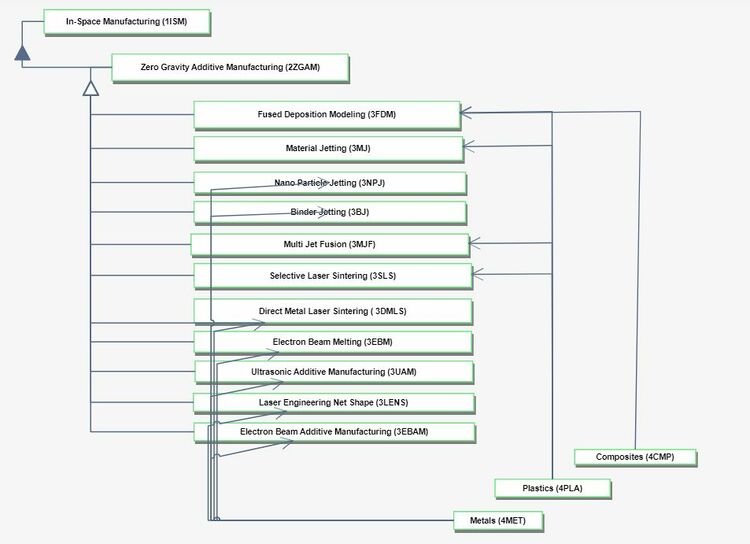
Zero Gravity Additive Manufacturing (2ZGAM) is part of an umbrella of In-Space Manufacturing (1ISM) techniques which includes In-Space Surface Manufacturing as well. Due to the nature of zero gravity mechanics, techniques such as Stereolithography & Digital Light Processing (Vat Polymerization) cannot be used and are not captured in this first-level DSM. 2ZGAM requires the following key enabling technologies at the process level: 3FDM Fused Deposition Modeling, 3MJ Material Jetting, 3NPJ NanoParticle Jetting, 3BJ Binder Jetting, 3MJF Multi Jet Fusion, 3SLS Selective Laser Sintering, 3DMLS Direct Metal Laser Sintering, 3EBM Electron Beam Melting, 3UAM Ultrasonic Additive Manufacturing, 3LENS Laser Engineering Net Shape, and 3EBAM Electron Beam Additive Manufacturing. In turn, these require enabling technologies at level 4, the material component level: 4CMP Composites, 4PLA Plastics, and 4MET Metals.
Roadmap Model using OPM
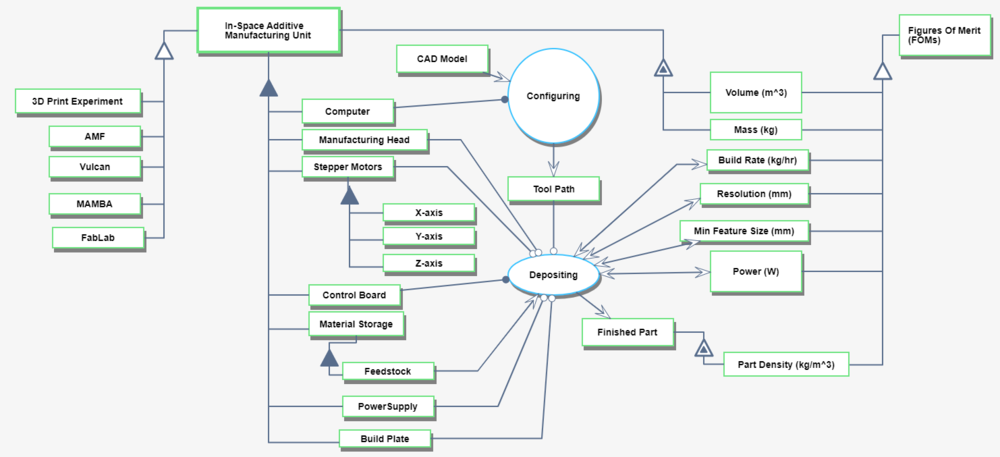
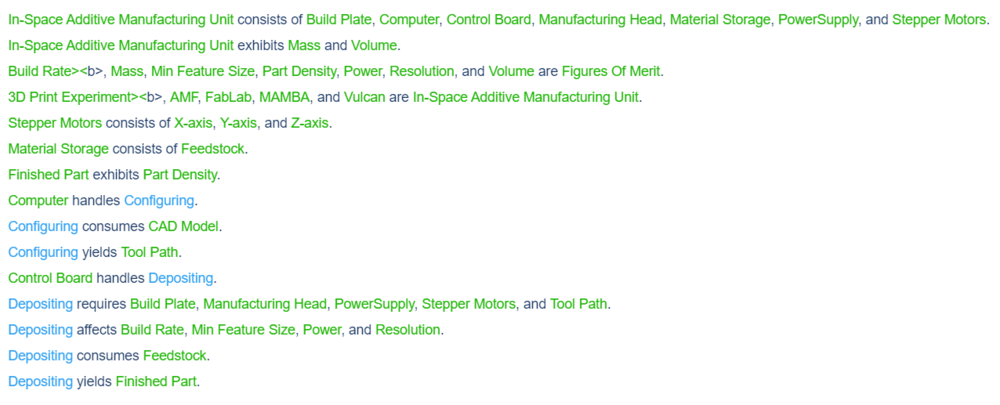
We provide an Object-Process-Diagram (OPD) of the 2ZGAM roadmap in the figure below. This diagram captures the main object of the roadmap (In-Space Additive Manufacturing Unit), its various instances including development projects, its decomposition into subsystems (build plate, manufacturing head, stepper motors …), its characterization by Figures of Merit (FOMs) as well as the main processes (Configuring, Depositing).
An Object-Process-Language (OPL) description of the roadmap scope is auto-generated and given below. It reflects the same content as the previous figure, but in a formal natural language.
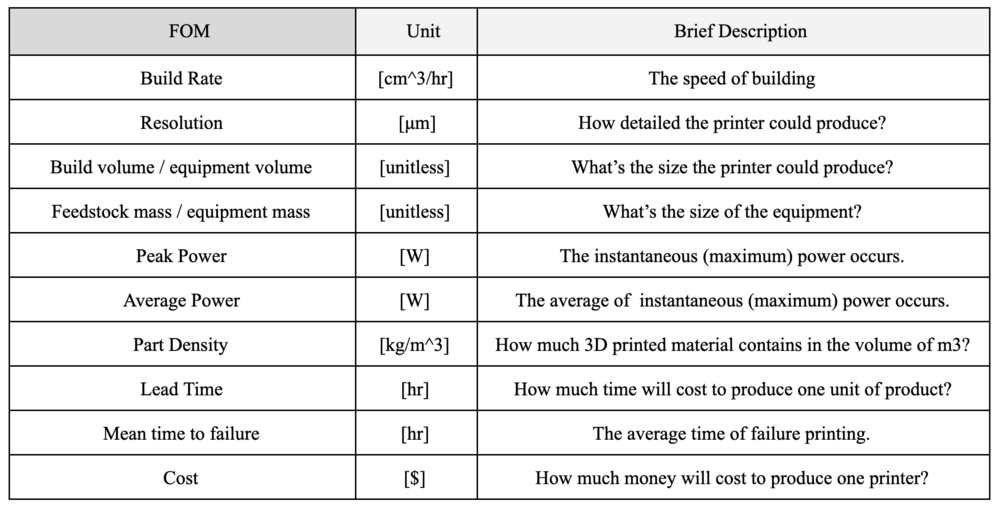
Figures of Merit
The table below show a list of FOMs by which solar electric aircraft can be assessed. The first four (shown in bold) are used to assess the aircraft itself. They are very similar to the FOMs that are used to compare traditional aircraft which are propelled by fossil fuels, the big difference being that 2SEA is essentially emissions free during flight operations. The other rows represent subordinated FOMs which impact the performance and cost of solar electric aircraft but are provided as outputs (primary FOMs) from lower level roadmaps at level 3 or level 4, see the DSM above.
Mathematical Equations
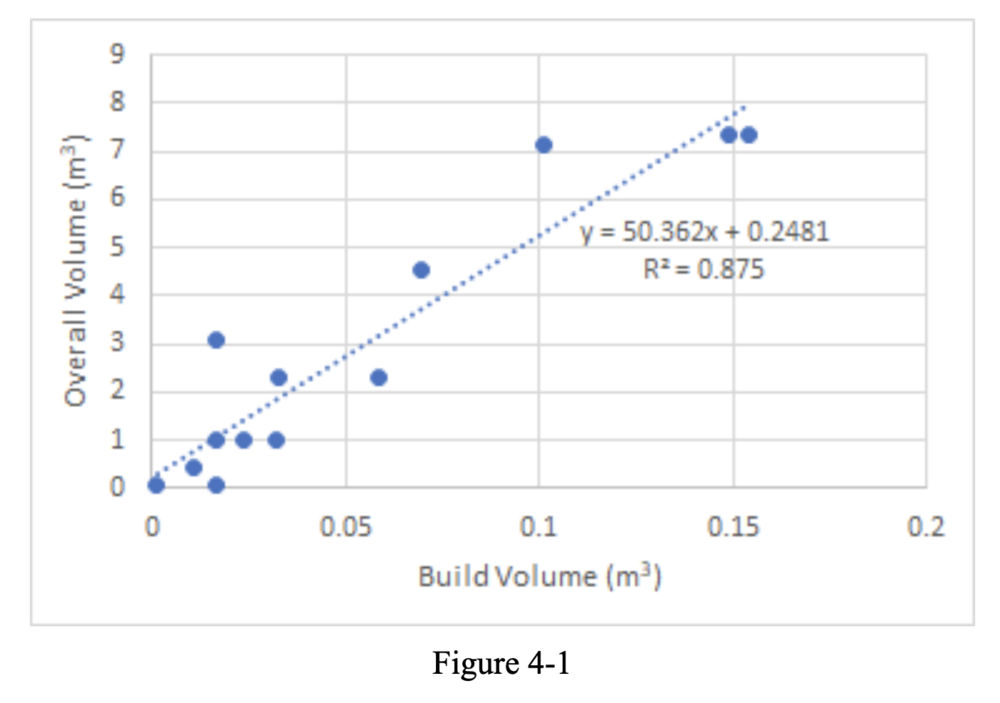
For this problem, we will focus on two figures of merit: (1) the ratio of build volume to overall manufacturing equipment volume, and (2) build rate [cm^3/hr]. Whereas the volume ratio will be determined using statistical regression techniques from available data about existing manufacturing equipment, the build rate will be computed from the fundamental physics of the manufacturing process (although it can also be validated with experimental results).
By looking at analogous Earth-based manufacturing equipment with plenty of available data on manufacturing equipment build volume and overall footprint, it is possible to derive a statistical relationship between build volume and overall volume of manufacturing equipment. The data plotted below represents the volumes for typical commercially available additive manufacturing equipment, particularly for FDM and SLS. With an initial y-intercept offset, we see that the ratio of build volume to overall volume is typically about 1.9% (or 1/50.362). The trendline can be used to predict the expected overall volume of manufacturing equipment to provide a desired build volume. However, it should be noted that for in-space manufacturing applications, where volume is at a much higher premium than for terrestrial manufacturing equipment, it is likely possible to improve the build volume to overall volume ratio through dedicated design and technology development efforts.
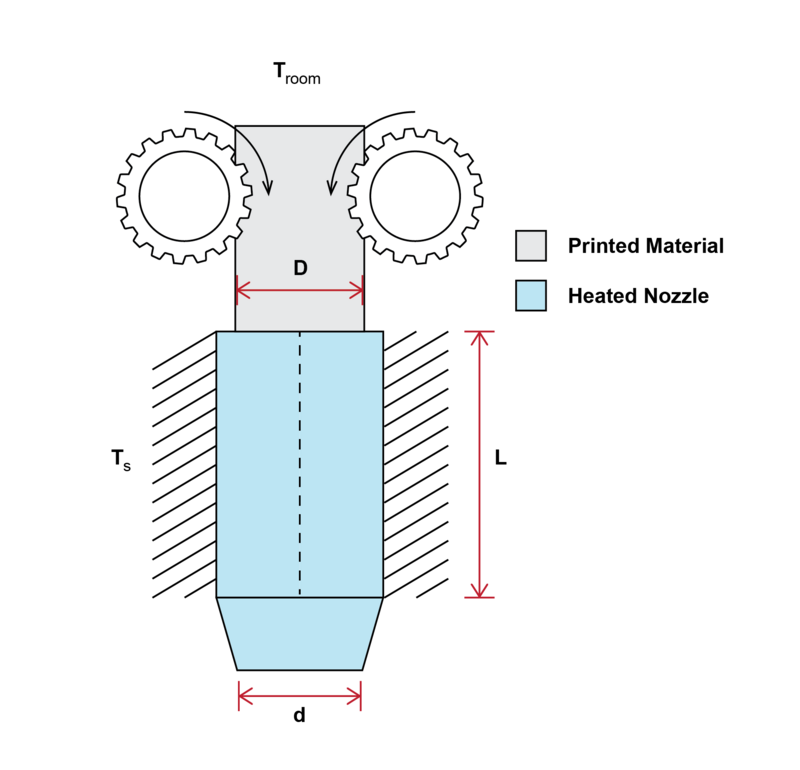
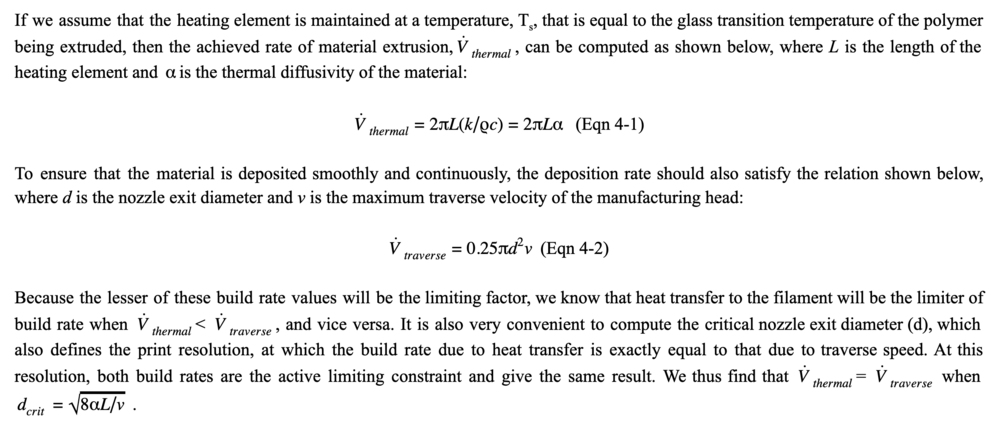
The achieved build rate for fused deposition modeling (FDM), as well as for the deposition phase in Bound Metal Deposition (BMD), can be computed analytically. The build rate is computed as the most limiting case of the following factors: heat transfer to/from the feedstock, maximum extrusion force, and traverse speed of manufacturing head and nozzle diameter. For these equations, consider the schematic shown below representing the process.
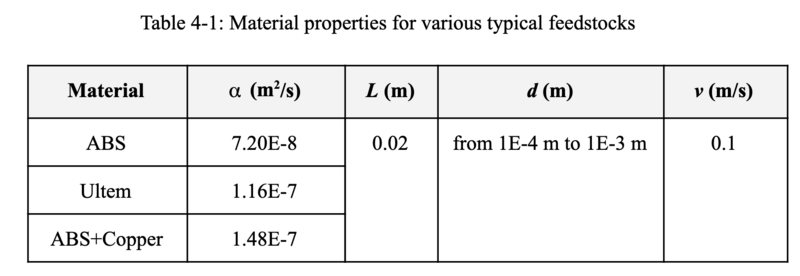
So, let us assume nominal values for the key parameters in the calculation of this build rate FOM:
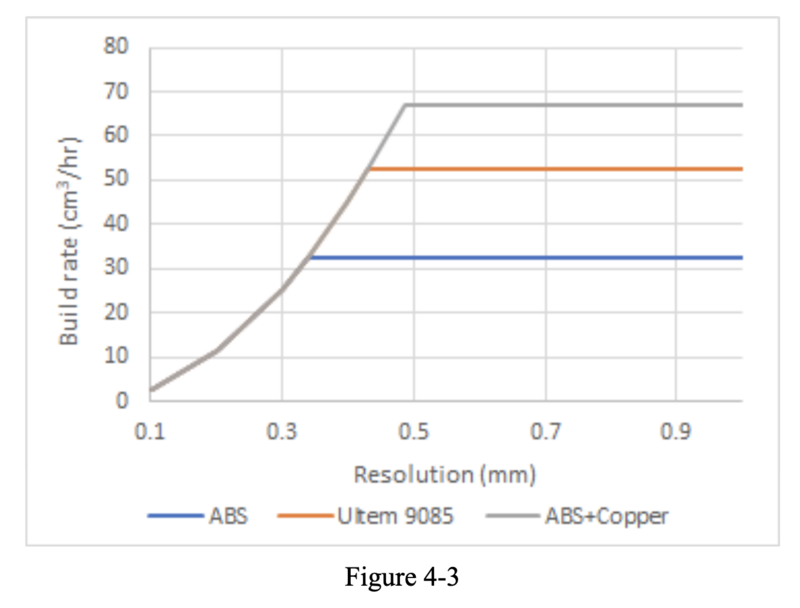
We can now plot the build rate vs. resolution for the parameter values shown in the table above. We see that the particular feedstock material affects the critical nozzle exit diameter (i.e. resolution) at which the active constraint on build rate switches from the traverse speed of the print head to be now limited by the heat transfer from the nozzle. The thermal diffusivity, , of the feedstock material also affects the maximum build rate achievable. However, when traverse speed is the limiting factor, the build rate is independent of material and only depends instead on the desired resolution.
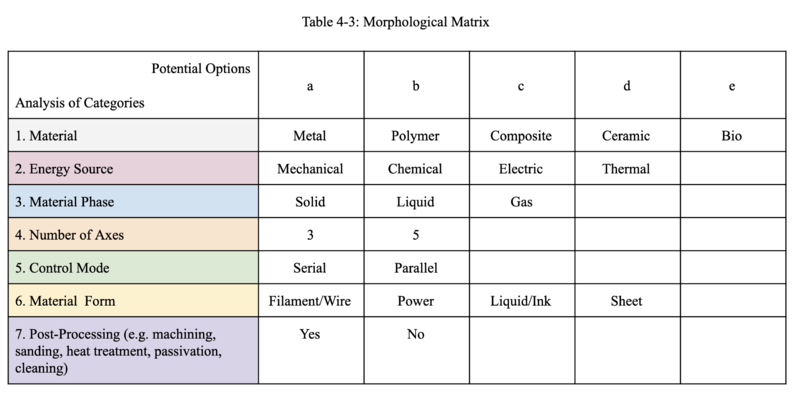
In general, the equations above apply not only for FDM and BMD process, but more generally for any process that carries out serial deposition of a feedstock material made molten by thermal conduction from a heater element in the manufacturing head. Using the morphological matrix show later in this answer to describe different manufacturing processes, we know that each process that shares the same pairing of energy source and material phase will have the same fundamental equations describing the manufacturing process, but simply with different parameters. However, different combinations of energy source and material phase will have different fundamental equations. For example, using electrical energy to deposit molten material describes both wire-fed directed energy deposition processes such as laser DED and electron beam freeform fabrication (EBF3). The description of these processes will differ in the input parameters, but their model will be similar, albeit different from the model presented for FDM.
Sensitivity Analysis
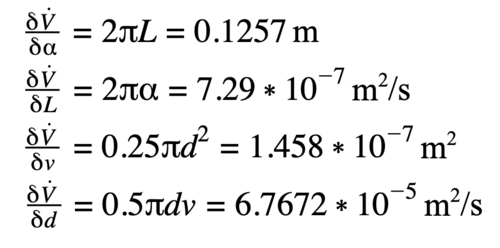
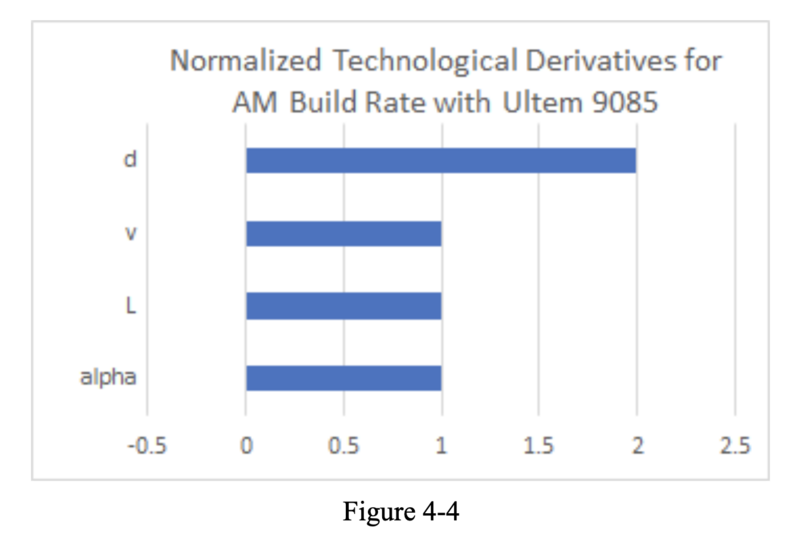
We can compute the sensitivity of build rate to the four key parameters identified: thermal diffusivity (), heated nozzle length (L), nozzle exit diameter (d), and print head traverse speed (v). These sensitivities are given by taking partial derivatives of Eqn 4-1 and Eqn 4-2. For convenience we will evaluate the sensitivities at the critical nozzle exit diameter (dcrit) where the build rate achieved due to traverse speed and due to heat transfer is identical. The values reported below are for Ultem 9085, a high-temperature aerospace grade polymer. This gives:
Normalized Tornado Chart
We now normalize the above sensitivities to represent the percent change in system performance, i.e. build rate, for a one percent change in the underlying parameter. In this way, we produce the normalized tornado chart shown below:
Alignment with Company Strategic Drivers
Alignment with “Company” Strategic Drivers: FOM Targets
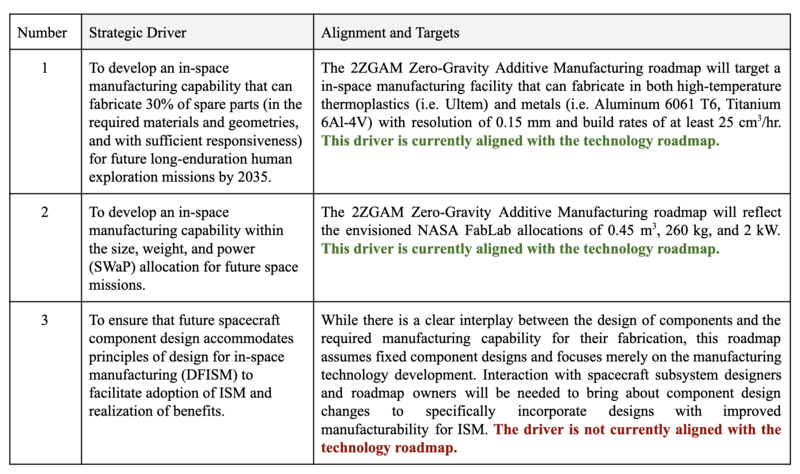
The table below shows an example of potential strategic drivers and alignment of the 2ZGAM Zero-Gravity Additive Manufacturing roadmap.
The list of drivers shows that the company wants to develop an in-space manufacturing capability that can fabricate 30% of spare parts for future long-enduration human exploration missions by 2035. The company also wants to develop an in-space manufacturing capability within the size, weight, and power (SWaP) allocation for future space missions. Which both drivers are aligned with the technology roadmap. Whereas the company wants to ensure that future spacecraft component design accommodates principles of design for in-space manufacturing (DFISM) to facilitate adoption of ISM and realization of benefits. The problem is while there is a clear interplay between the design of components and the required manufacturing capability for their fabrication, this roadmap assumes fixed component designs and focuses merely on the manufacturing technology development.
Positioning of Company vs. Competition
Positioning of Company vs. Competition: FOM charts
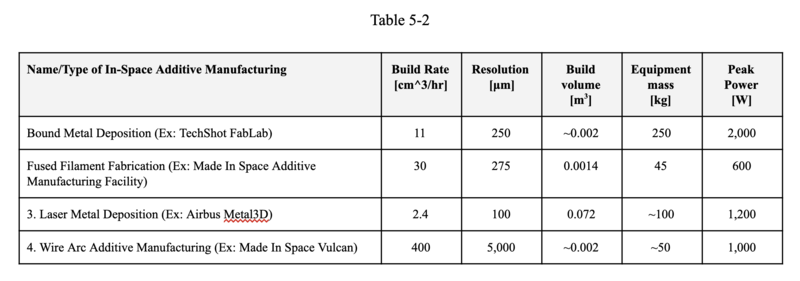
The team try to compare and organize the FOM from related/competitive companies. Some key data/info are confidential, therefore we will keep it blank.
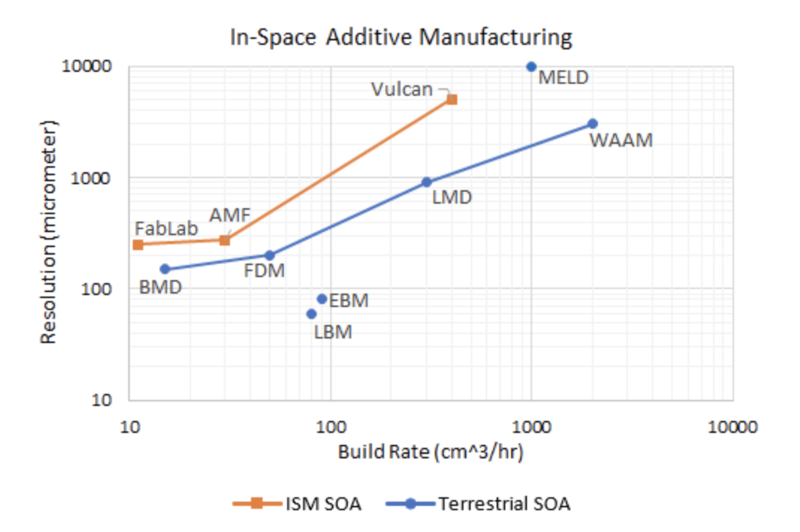
The following figure is the Pareto Front of Resolution vs. Build Rate for Various Additive Manufacturing Processes
Technical Model
Technical Model: Morphological Matrix and Tradespace
Financial Model
List of R&T Projects and Prototypes
Key Publications, Presentations and Patents
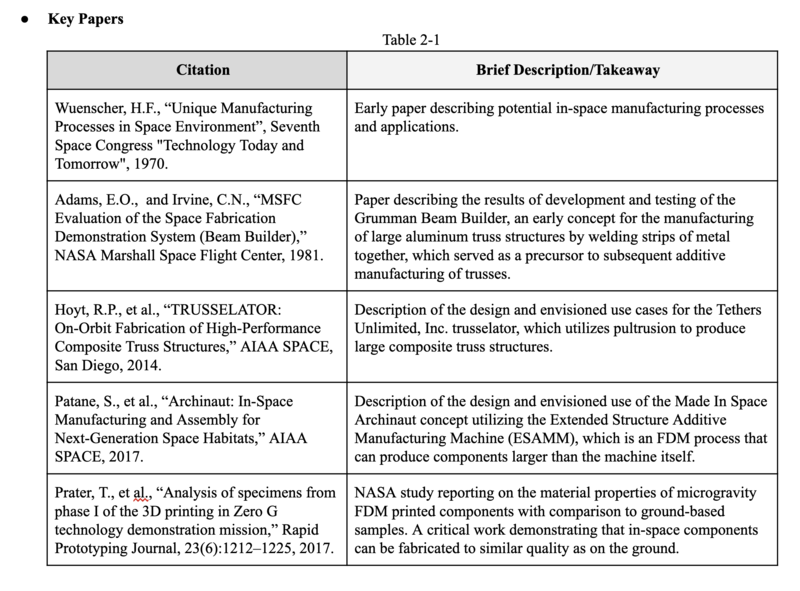
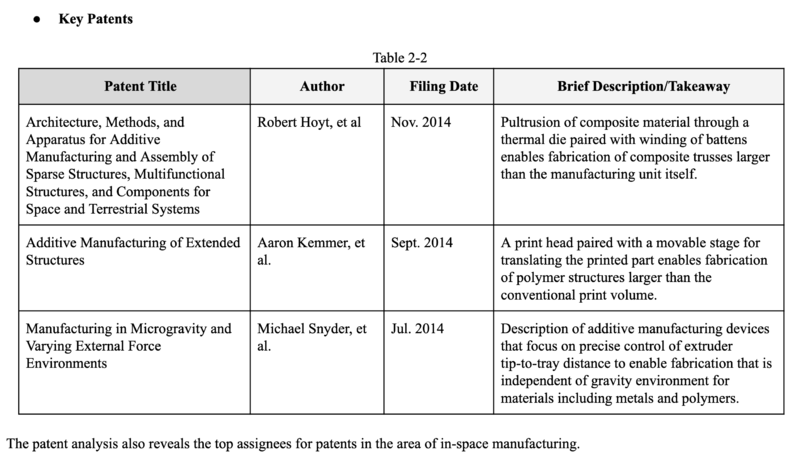
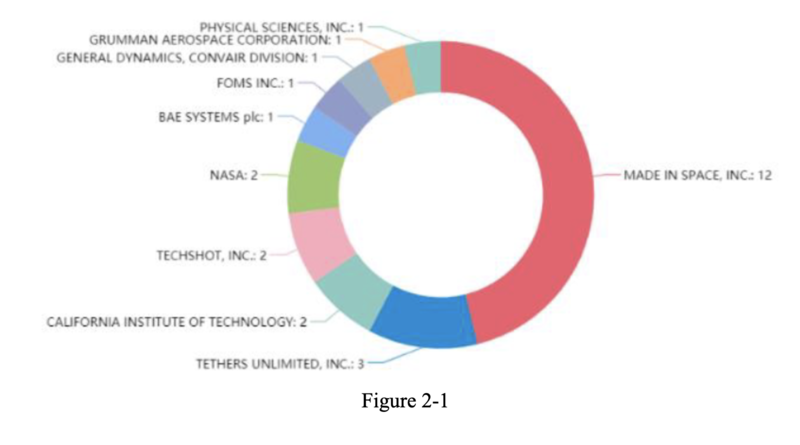
Keys Publications and Patents
We will focus it on Additive Manufacture in the space as the main direction to search and do our paper and patent analysis
Technology Strategy Statement
A technology roadmap should conclude and be summarized by both a written statement that summarizes the technology strategy coming out of the roadmap as well as a graphic that shows the key R&D investments, targets and a vision for this technology (and associated product or service) over time. For the 2SEA roadmap the statement could read as follows:
Our target is to develop a new solar-powered and electrically-driven UAV as a HAPS service platform with an Entry-into-Service date of 2030. To achieve the target of an endurance of 500 days and useful payload of 10 kg we will invest in two R&D projects. The first is a flight demonstrator with a first flight by 2027 to demonstrate a full-year aloft (365 days) at an equatorial latitude with a payload of 10 kg. The second project is an accelerated development of Li-S batteries with our partner XYZ with a target lifetime performance of 500 charge-discharge cycles by 2027. This is an enabling technology to reach our 2030 technical and business targets.
