PHA (polyhydroxyalkanoate) bioplastics manufacturing
PHA bioplastics manufacturing roadmap
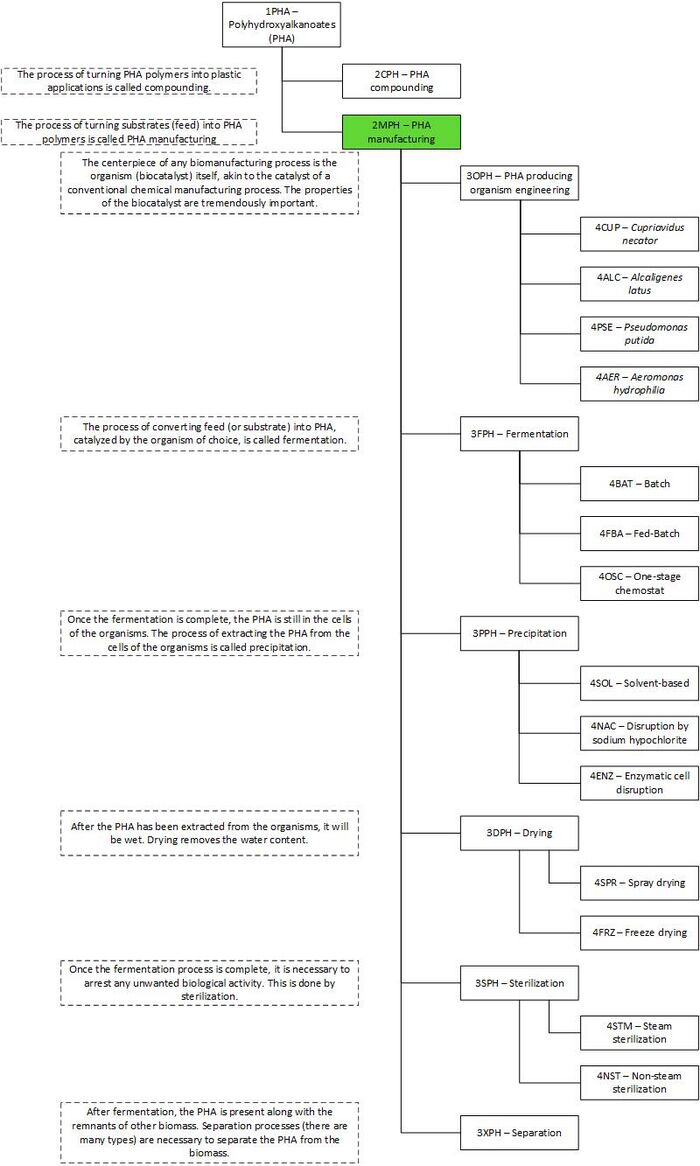
First, this technology roadmap is given a clear and unique identifier:
- 2MPH - PHA manufacturing
This indicates that we are dealing with a “level 2” roadmap at the product level, where “level 1” would indicate a market level roadmap and “level 3” or “level 4” would indicate an individual technology roadmap within PHA manufacturing.
Roadmap Overview
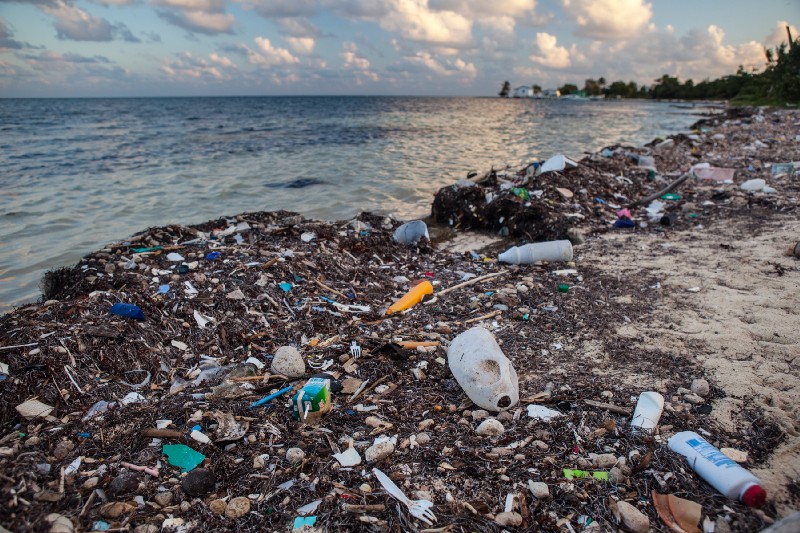
The problem of plastic accumulation in the natural environment is becoming a high profile problem. This is because oil-based plastics, while they are cheap and have good material properties, do not biodegrade.
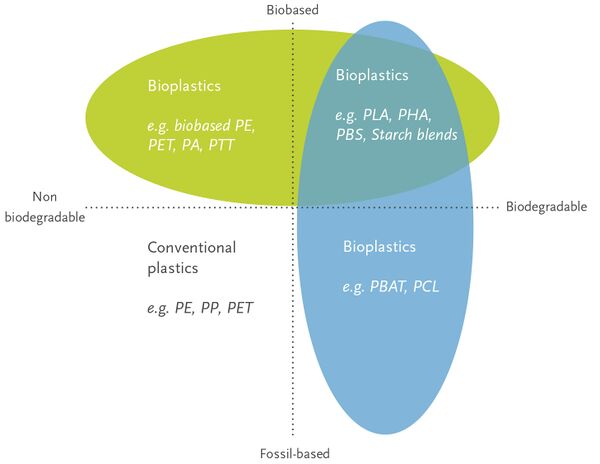
One potential answer to this problem is bioplastics. The term bioplastics covers a lot of different types of materials, some of which are bio-based (i.e. generated from biological feedstocks) but not biodegradable, some of which are biodegradable but not biobased, and some that are both. One family of bioplastics that are bio-based AND biodegradable is PHAs (polyhydroxyalkanoates).
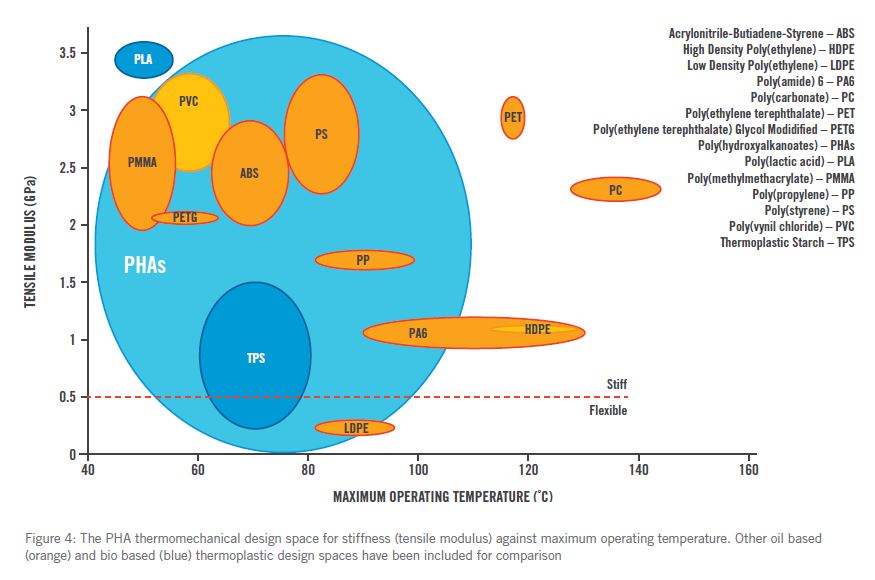
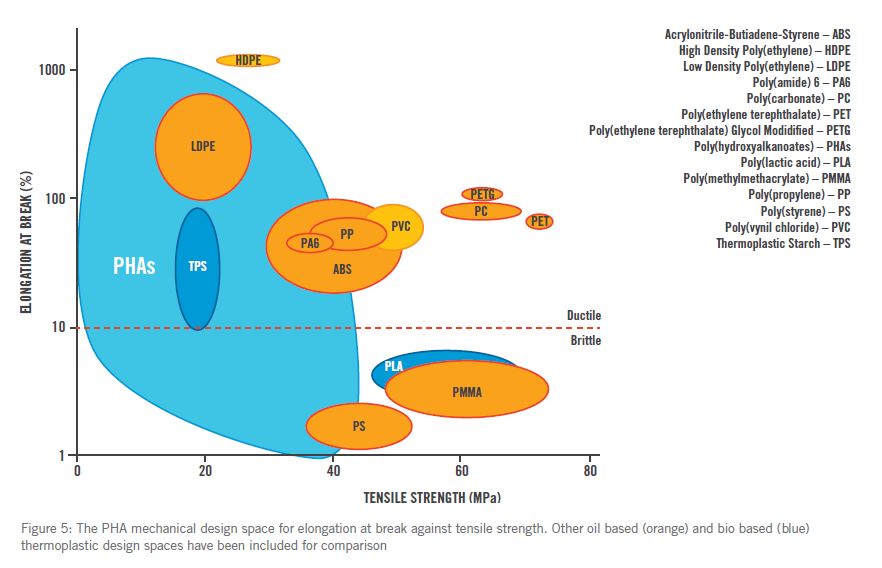
PHAs have the potential to replace oil-based plastics in terms of material properties!
Unfortunately, PHAs currently are not competitive on a cost basis with oil-based plastics due to the high cost of manufacturing them.
(insert price chart here)
We propose a technology roadmap to reduce the cost of manufacturing PHA to parity or better with oil-based plastics.
Design Structure Matrix (DSM) Allocation
Blue shaded cells indicate these technologies are connected.
We can also depict the technology hierarchy tree as a DSM (design structure matrix). Based on our current understanding, the 2MPH technology (PHA bioplastic manufacturing) is comprised of separate process steps with no cross-linkage (i.e. completely modular). For example, the drying technology doesn't depend or have any relationship with sterilization technologies. We will be investigate this further.
Roadmap Model using OPM
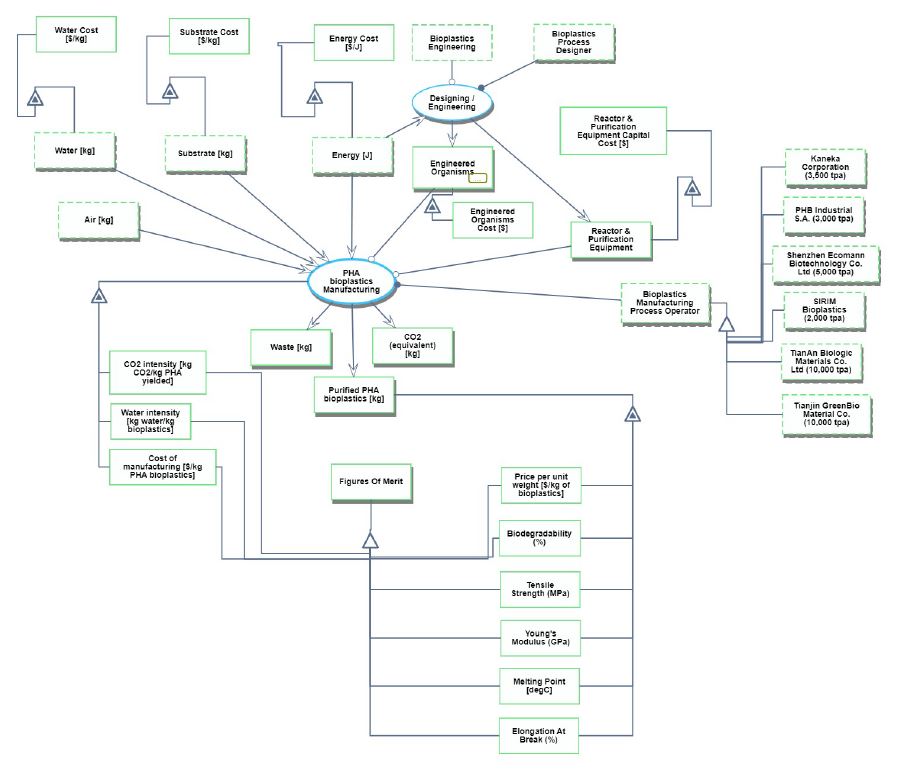
We provide an Object-Process-Diagram (OPD) of the 2MPH technology in the figure below. This diagram captures the main object of the technology (PHA bioplastics manufacturing). Please draw your attention to the right side of the diagram to see current PHA bioplastics manufacturing operators. Then, please draw your attention to the bottom section of the diagram to see the different figures of merit.
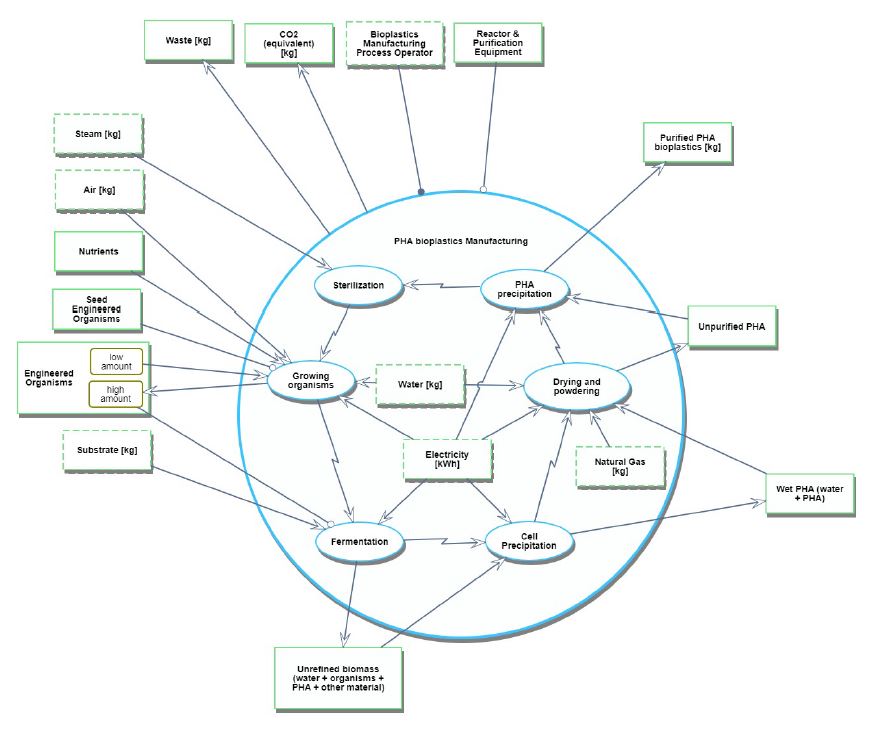
We also provide a OPD of a more detailed view of the 2MPH technology, including the high level process steps that make up PHA bioplastics manufacturing.
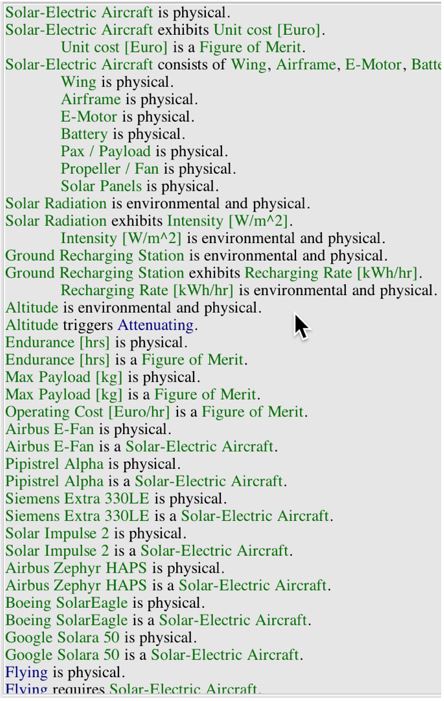
An Object-Process-Language (OPL) description of the roadmap scope is auto-generated and given below. It reflects the same content as the previous figure, but in a formal natural language.
Figures of Merit
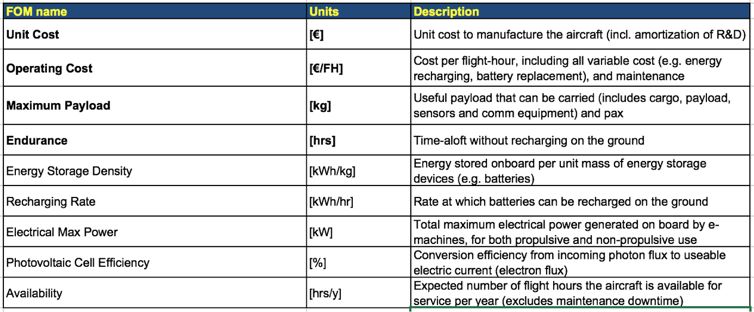
The table below show a list of FOMs by which solar electric aircraft can be assessed. The first four (shown in bold) are used to assess the aircraft itself. They are very similar to the FOMs that are used to compare traditional aircraft which are propelled by fossil fuels, the big difference being that 2SEA is essentially emissions free during flight operations. The other rows represent subordinated FOMs which impact the performance and cost of solar electric aircraft but are provided as outputs (primary FOMs) from lower level roadmaps at level 3 or level 4, see the DSM above.
Besides defining what the FOMs are, this section of the roadmap should also contain the FOM trends over time dFOM/dt as well as some of the key governing equations that underpin the technology. These governing equations can be derived from physics (or chemistry, biology ..) or they can be empirically derived from a multivariate regression model. The table below shows an example of a key governing equation governing (solar-) electric aircraft.

SolarEagle and Solara 50 were both very ambitious projects that aimed to launch solar-electric aircraft with very aggressive targets (endurace up to 5 years) and payloads up to 450 kg. Both of these projects were canceled prematurely. Why is that?
