Electric Vehicle Charging Technologies
EV Charging Technology Roadmap
- 2EVCT - Electric Vehicle Charging Technology
This is a Level 2 roadmap. Level 1 would be the technologies enabling zero-emission transport while Level 3 and 4 would include technologies enabling the charging of electric vehicles.
Roadmap Overview
Our chosen technology is that of charging energy storage devices using power from the grid. With the current technology, electric vehicles can be charged using a standard 120V outlet or a 240V industrial outlet. An electric vehicle usually has an onboard charger unit (OBC) which converts AC power into DC to store it in the high voltage battery. The vehicle accepts charge via a charge port where the user can insert the charging plug. The charging plug is a part of a wall-mounted (off-board) unit which is connected to the grid and supplies AC power to the vehicle when the vehicle is ready to accept charge. The user is usually responsible for initiating charging by connecting the vehicle to the off-board unit (EVSE) and optionally keying in a unique id to “unlock” the unit to provide charge. Recent advances in charging technologies have enabled DC fast charging which has resulted in faster charge rates and reduced charging times.
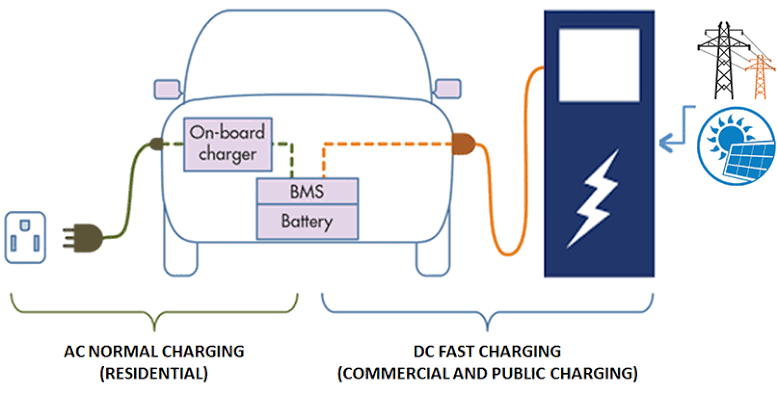 *image-source - https://www.verdemobility.com/charge.html
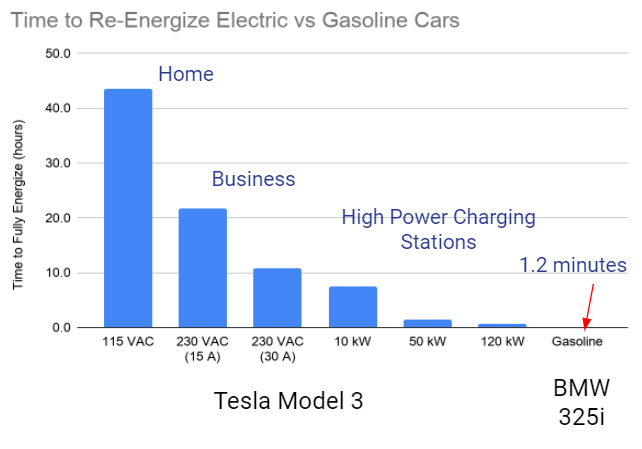
With today’s technology long-range EVs (200+ mile range) could take as high as 30+ hours to fully charge the battery pack using a regular home outlet. Fast charging technologies have also been developed which can bring the charge time down to a few hours (~2 hours), but these times are still significantly higher than the time needed to fill a fuel tank in a gasoline/ diesel vehicle as shown in the figure below. These would also warrant better cooling technologies to keep optimal battery thermal performance and extend battery lifetime. With the battery cost ($ per KWh or $ per mile) decreasing, we could see a trend of bigger batteries / higher range vehicles being deployed, and an increased rate of adoption of electric vehicles, which would further necessitate faster charging and availability of charge stations. Hence, we feel the current technology would have to be advanced to be able to charge as fast as possible and make charge stations as freely available as gas stations today, thus ultimately reducing range anxiety.
Technology Hierarchy Tree
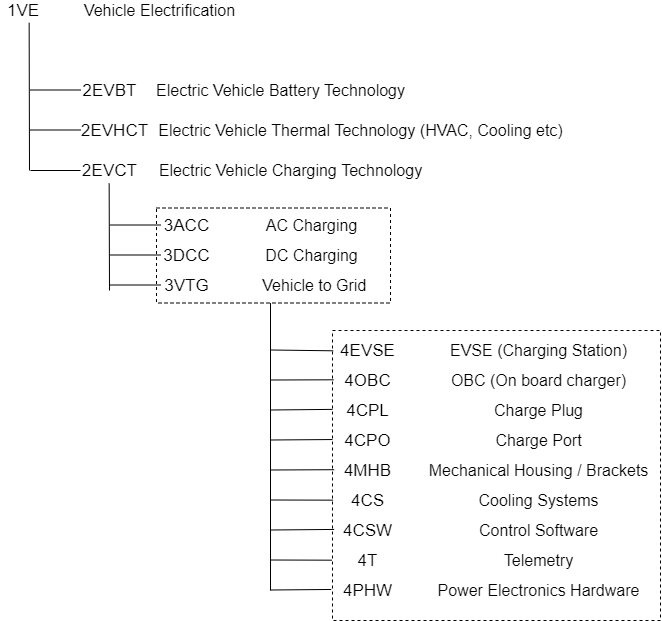
The following hierarchy shows the breakdown from L1 Technologies (Vehicle Electrification in general) to L2 - Technologies that need to be developed to achieve vehicle electrification. Further, The 2EVCT decomposes into different technologies that are developed to facilitate electric vehicle charging. L4 technologies are the technologies needed to develop the formal entities of products that enable electric vehicle charging.
DSM Allocation
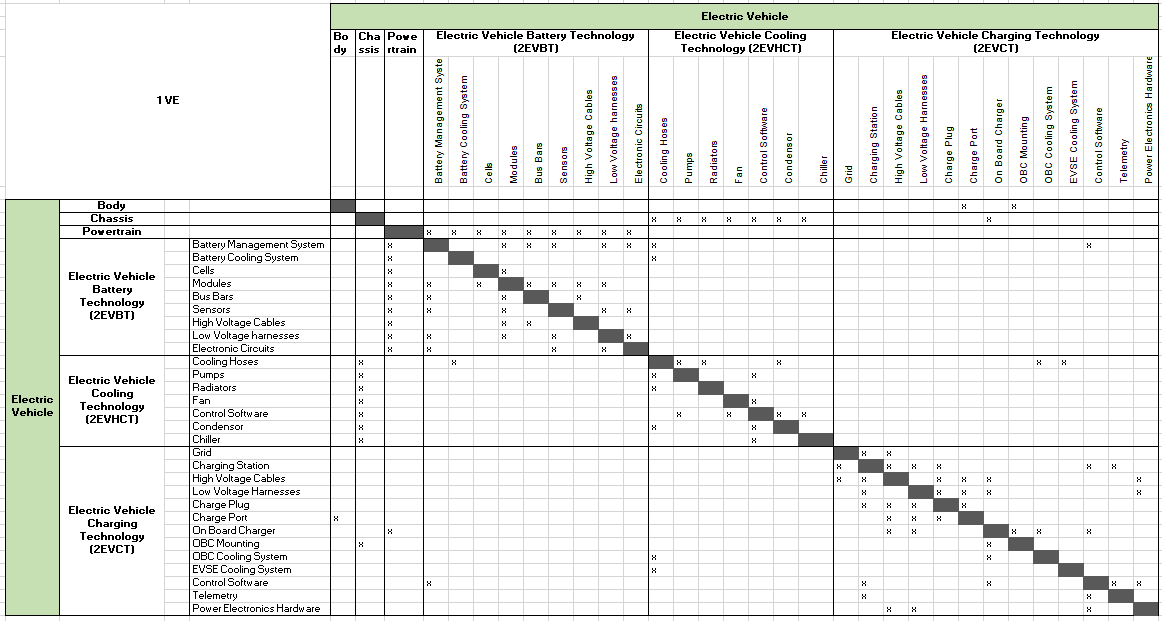
The matrix below shows the allocation of technologies at various levels to enable vehicle electrification. The selected technology 2EVCT is shown as a part of the bigger 1VE technology DSM
Roadmap Model using OPM
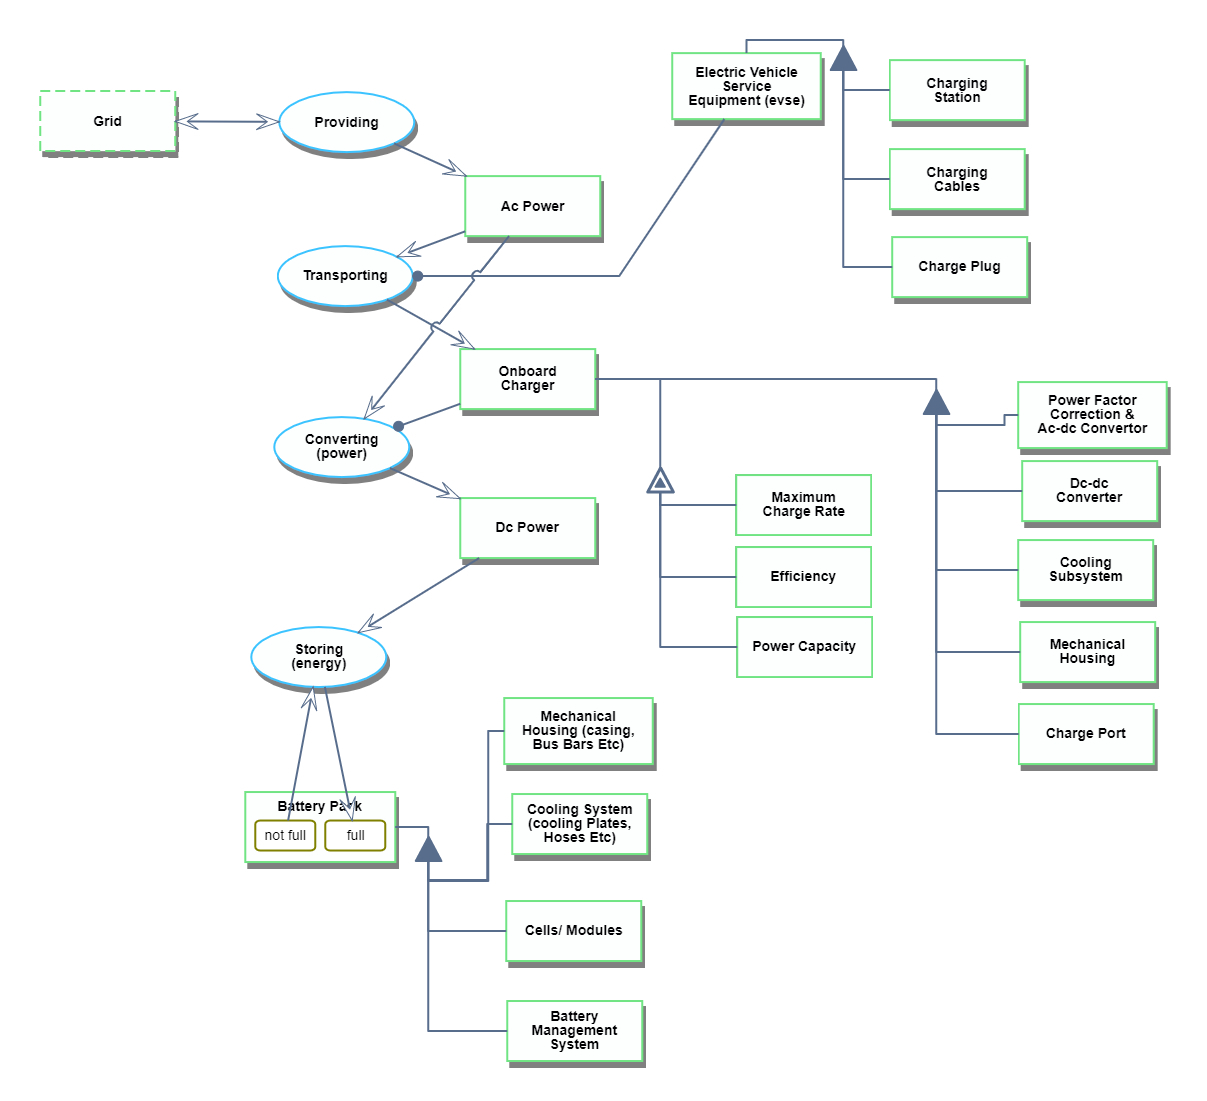
We provide an Object-Process-Diagram (OPD) of the 2EVCT roadmap in the figure below. This diagram captures the main product, Its decomposition, and shows the process flow of achieving the desired function (in this case charging the battery pack).
In the charging technology, the EVSE (Electric Vehicle Service Equipment, a.k.a charging station) receives AC power from the grid and transports it to the vehicle's on-board charger. This onboard charger is responsible for converting AC power into DC power and storing it in the high voltage battery. The EVSE can be decomposed into the main charging station, the power lines from the charging station to the vehicle, and the plug that connects to the vehicle's charge port. The onboard charger comprises electronics to correct the power factor and to convert AC power into DC and stores it in a battery pack. It has an associated cooling system to maintain the thermal performance of the unit and mechanical housing to house all the electronics. The high voltage battery comprises of the battery management system, cells, sensors (voltage, current, temperature) along with the associated cooling assembly and mechanical housing to hold everything together. Below is an OPD representation of the system and the associated OPL.
2EVCT Figure of Merits
The table below shows a list of FOMs by which charging of electric vehicles can be quantified and compared
| Figure of Merit | Units | Description |
|---|---|---|
| Charge Rate | [KW/hr] | Total energy/ power added to the battery per unit time |
| Charge Time | [Hrs] | Total time taken to fully charge the battery pack of known KWh capacity |
| Charge Efficiency | [%] | Percent of grid power that is stored in the battery |
| Cost to charge | [$] | Total electricity cost for a full charge cycle at a certain time of the day |
| Charge Power | [KW] | Power rating of the charger (This will determine the magnitude of DC current that the pack will be charged at) |
| Charge Level | [dimensionless] | L1 (120V AC), L2 (240V AC), L3 (Direct Current charging) |
| Charging Stations | [per mile] | Number of charging stations per mile |
| Pack Temperature Rise (normalized to pack size) | [degC/ KWhr] | Rise in temperature of the battery pack after charging is complete |
| Coolant Flow Rate | [gals/hr] | Flow rate required to keep maintain the rise in temperature below a predefined threshold |
| Power Factor | [%] | Ratio between real and reactive power consumption from the grid |
| Pack capacity degradation | [Ah per year] | Reduction in the capacity of the pack after a known number of years due to frequent fast charging |
Charge levels are defined by Level 1, Level 2 and Level 3 (or DC Fast Charging). Level 1 chargers are usually plugged into the home wall outlets and can do up to a 3.3KW. Level 2 chargers are usually outside the commercial establishments and also can be installed in residential homes. These chargers have charge rates varying from 3.3KW to up to 80KW. Level 3 charging, usually called DC Fast charging is the ability to charge the battery pack at rates between 80KW up to 450KW. DC Fast charging significantly rises the pack temperature and hence regular fast charging could accelerate cell degradation and reduce battery life faster than normal.
The most important figures of merit are charge rates, charge times, and charging stations. These directly affect how fast the vehicle can be charged and the availability of charge stations when needed. Charging is also cross dependant on battery pack behavior and hence will only be effective if the pack thermals are within thresholds. This interdependency of charging and pack behavior put a limitation on the technological advancements in charging (without proper cooling, charging technologies with extremely high charge rates would be worthless).
Competitive Landscape
The electric vehicle charging system market is very competitive. As battery costs are coming down, there is a growing competition of deploying charging networks across the country and allowing higher charge rates to decrease the overall charge times. The table below shows the competitive landscape of the players in this industry.
Each company has a unique strategic roadmap. The comparison of multiple charging companies is based on their company strategy. These are evaluated across areas like vision, go-to-market strategy, partnerships, technology, geographic reach, product performance, product portfolio, and pricing.
| Top Contenders | Challengers | Emerging |
|---|---|---|
| Electromotive, ABB, Aerovironment, Better Place, Coulomb Technologies, GE Energy, Schneider Electric | Clipper Creek, Delphi, Eaton, Go Smart, Seimens AG, Add Energie | Chargepoint, Alpha, Brusa, Greenlots, Witricity, WattsNXT, Power Pack, Powerstream, Evatran |
The two main strategic drivers for the charging technology are to bring the charging time down and make charge stations as easily available as there are gas stations today. The following table shows how the roadmap targets for the company are aligned to these drivers.
| Number | Strategic Driver | Alignment to Targets |
|---|---|---|
| 1 | Develop a network of charge stations such that open charging station is as easy to find as a gas station | The charging technology roadmap should target to deploy as many charging stations as there are gas stations (if not more) and optimize their geographic locations like today's gas stations. |
| 2 | Develop charging equipment to bring the charge times comparable to times taken to fill a full tank of gas | The charging technology roadmap should support upwards of 600KW of charging power to enable fast charging of the batteries. |
Charging network deployments
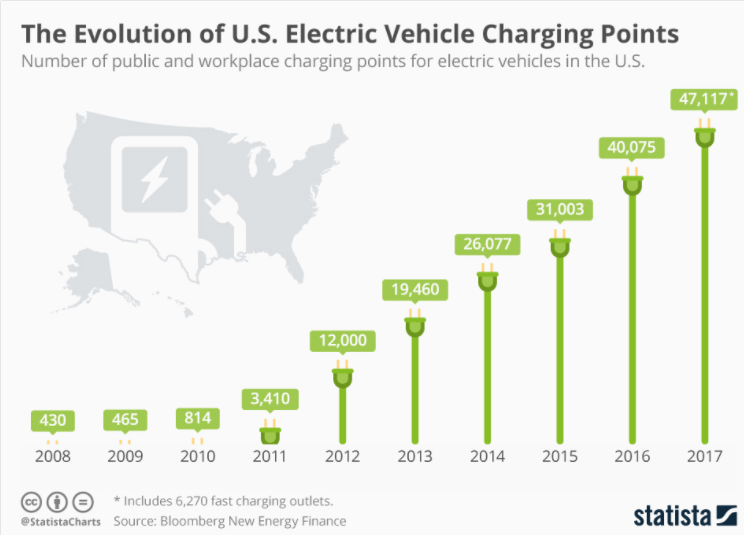
The figure below gives a sense of the rate of charging station deployments over the last several years.
Dependence on parallel technology roadmaps
Charging at such high rates is going to result in overheating of the battery pack, thus eventually limiting the power flow to keep the pack temperatures in check. To enable an extended period of the high power charging operation, technologies would have to be developed to better cool the battery pack / better reject the heat. This would drive roadmaps for battery pack manufacturers in designing cooling plates for better heat rejection, cell researchers for investigating chemistries that do not accelerate cell degradation under extreme temperatures and vehicle manufacturers to enable better cooling systems (pumps, radiators etc). Thus, this strategic driver in the charging roadmap is limited by the advances in battery technology and the company should be aware of the battery technology roadmaps.
Positioning of the Company
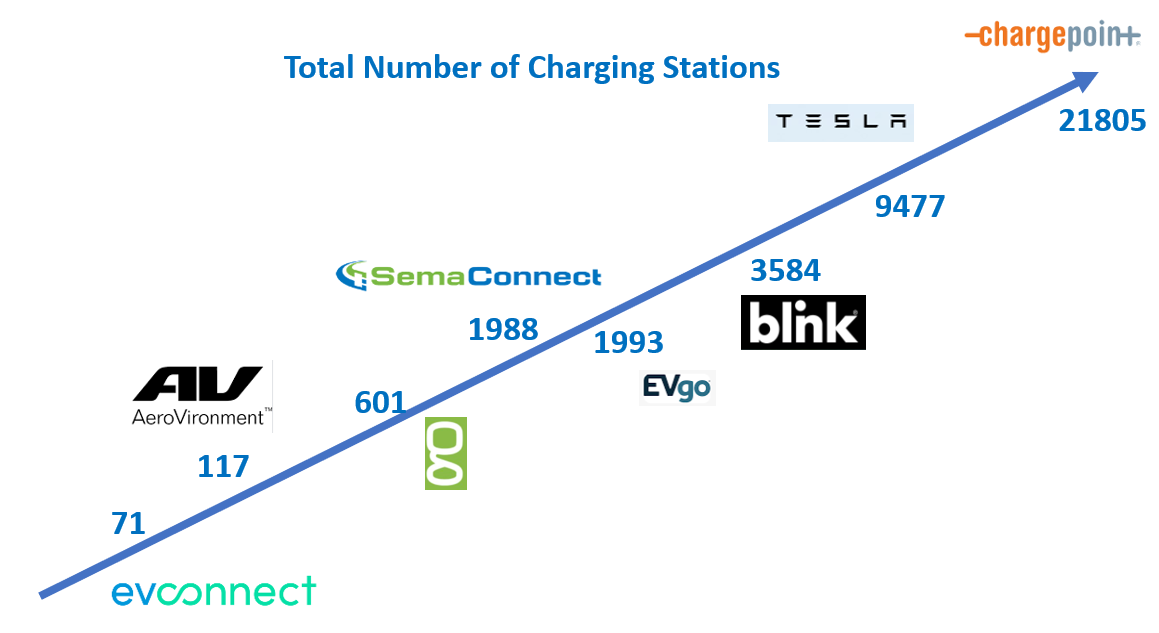
This section compares the competition in the EV charging market. The two main figure of merits that the comparison is usually made is a) Total number of stations and b) Rate of charging (Level 1, Level 2, DC Fast Charge)
