Earth Observation Satellites
Technology Roadmap Sections and Deliverables
Roadmap Overview
This technology roadmap is a level 2 assessment of earth observation satellites (EOS). Earth observation satellites are one of the latest applications of remote sensing.
Remote sensing is the process of observing an object or phenomenon without making physical contact and it can be traced back to World War I, when aircraft were used for military surveillance and reconnaissance. In the last 15 years, technological advancements enabling the miniaturization of processing components and hardware mechanisms have given birth to small satellites. These small satellites are becoming commoditized as production lead times, the price of commercial off the shelf (COTS) components, and manufacturing and launch costs begin to fall. The combination of these factors with increasing demands for big data to feed machine learning and artificial intelligence algorithms is creating a rapidly growing market need for remote sensing in low earth orbit (LEO).
This roadmap will walk through the next steps for innovation in remote sensing by earth observation satellites.
Design Structure Matrix (DSM) Allocation
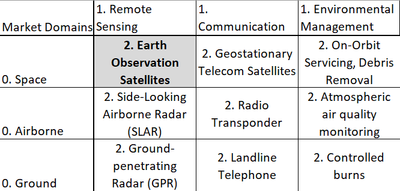
We have designated Earth Observation Satellites (2EOS) as a Level-2 Technology. It is present in the Level 1 Markets of 1) Low-Earth Orbital Technologies and Remote Sensing Technologies. For other examples of intersections on the basis of these markets, see the following figure:
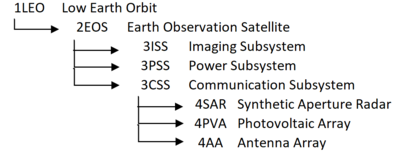
Our Design Structure Matrix (DSM) is as follows:
Legend: Green: Direct Component (solar arrays are a component of the Power Subsystem) Yellow: Cross-relationships between technologies and other subsystems (heat pipes interact with all other subsystems to transfer heat) Orange: Physical interactions between Level four technologies within the same subsystem (solar arrays interact with any deployment and angling mechanisms)
Roadmap Model using OPM
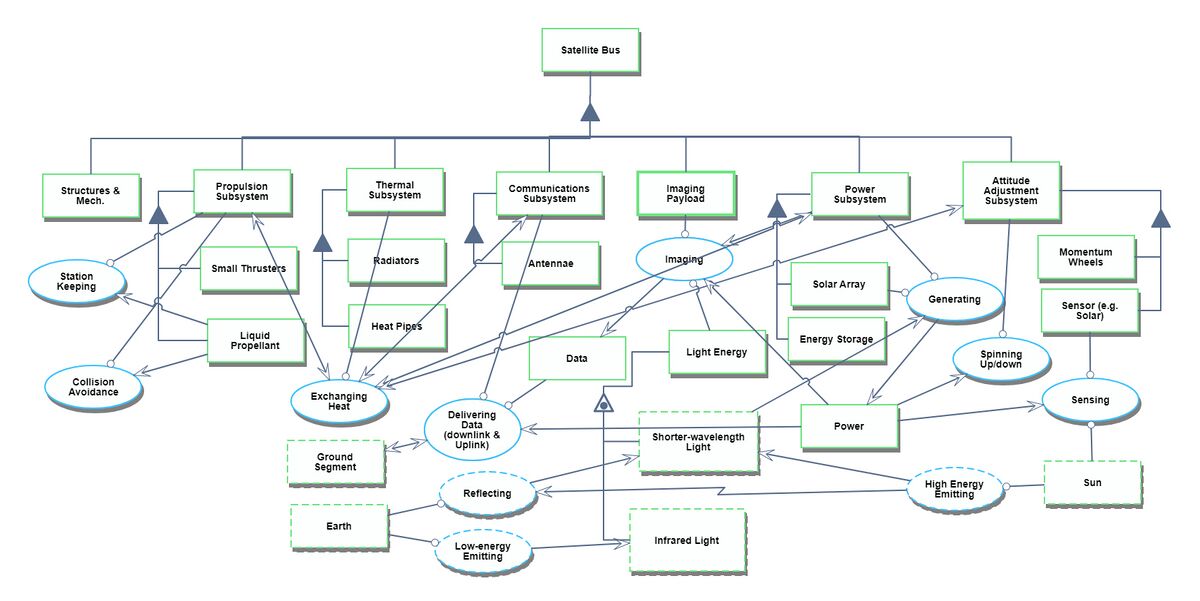
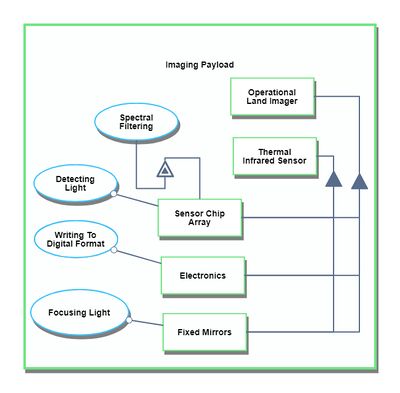
Our Object Process Diagram (OPD) is pictured below, complete with a Level Zoom to examine components of the Imaging Subsystem.
Figures of Merit (FOMs)
Several relevant Figures of Merit exist for Earth Observation Satellites. The imaging system in particular is constrained by four types of resolution:
- Spatial [m]
- Spectral [nm]
- Temporal [days] (also called revisit period)
- Radiometric [bits]
We will consider spatial resolution as principle among these, for most applications, including surveying, land management, urban planning, and disaster relief. Some hard tradeoffs exist between these. Generally, spatial resolution decreases with increasing spectral resolution; a minimum threshold of energy must reach the imaging sensor in order to resolve an image, and the smaller the band of electromagnetic radiation considered, the less power received. Wider accepted bands (panchromatic) have more difficulty discerning color and material reflectivity, but gain in spatial resolution. The following figures show estimations of the improvement in spatial resolution over time. For further discussion of trade-offs between types of resolution, see Technical Model: Morphological Matrix and Tradespace below.
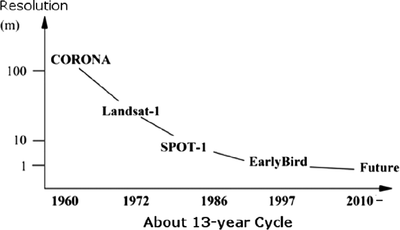
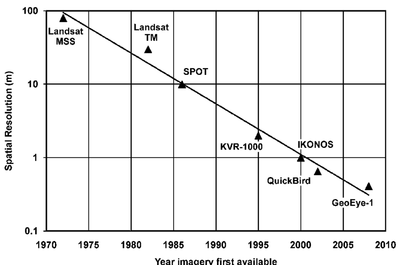 (Left: Zhou 2010; Right: Fowler 2010)
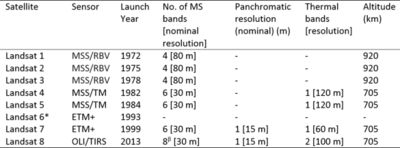
The 10x improvement in spatial resolution over a 13-15 year cycle suggests a decline rate in minimum resolvable distance (increase in resolution) of ~14% per year. Improvements in spectral resolution is evident in the increasing number of bands used in successive Landsat missions, with Landsat 1 carrying only 4 visible/near-visible bands, and the most recent Landsat 8 detecting 8 distinct visible/near-visible bands, one wide panchromatic band, and two long-wave thermal infrared bands.
Other high-relevance FOMs include the power draw of the imager relative to the power output of the solar arrays. If the power draw of the imager is too high, it may reduce the rate at which is it able to capture images, creating data gaps and lowering temporal resolution. A variety of measures exist to quantify this relationship, including the unitless fraction of generated power consumed by the imager, the unitless efficiency of the cells, or the power output per size and mass of the solar arrays [W/(m2*kg)], as smaller arrays cost less to install and launch, and thus more funds can be directed into the imaging subsystem. For more information on the improvement of solar cell power efficiency over time, refer to recent publications of the National Renewable Energy Laboratory. Finally, the bit error rate (BER) of the communications channel is a relevant Figure of Merit to the wider satellite system. If the BER is too high, it can either slow the system down by necessitating redundancy, or effectively reduce the spatial resolution by decreasing the confidence of any one pixel, necessitating spatial aggregation of the data in post-processing. The BER is a function of some systemic factors like chosen modulation scheme, but many extrasystemic variables, including interference from transmission medium, and as such no clear figure showing improvement over time has yet been identified.
Strategic Drivers
Positioning vs. Competitors
This project has been sponsored in partnership with Labsphere Inc, a New Hampshire-based photonics company. Labsphere provides optical calibration services for a variety of applications, including but not limited to remote sensing.
Technical Model: Morphological Matrix and Tradespace
Our morphological matrix for an Earth Observation payload is shown below. Underlined values reflect those present on the Landsat 8 mission.
Some choices cause more constraint on the rest of the matrix than others. For example, choosing an imaging satellite does not necessarily restrict the choice of active vs passive sensor type (see figure below). However, among Earth Observation satellites, geostationary orbits are almost exclusively used for meteorology missions (e.g. the GOES series), so the restrictions imposed by GEO may favor satellites that use non-imaging techniques.
As another feature of our tradespace, we note that the presence of scanning mechanisms introduces new failure modes (see the failure of Landsat-7) and may necessitate additional instruments for reconfigurability or added redundancy, reducing risk. Some features are cost-limited, or constrained by technological limits, rather than trades with other system decisions, for example, radiometric resolution is limited by the quality of available sensor technology. Additionally, we note that although this matrix only represents decision variables for the Earth Observation payload, these choices will have cascading effects on other satellites subsystems (active satellites require higher power draw; more unique instruments will yield greater dry mass).
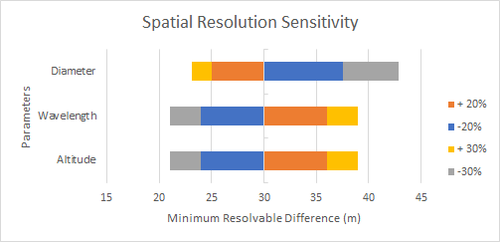
Sensitivity Analysis We consider first the relationship of minimum resolvable difference given by Rayleigh’s Resolution limit: X=h* / D (Wertz et al. Eq. 17-6) where X is our figure of merit, the spatial resolution, h is the satellite altitude, is the light wavelength, and D is the diameter of the lens aperture. The partial derivative of this system are quite simple to compute, namely:dX/dh = / D dX/d = h / D dX/dD = -h* / D2 Showing that slight changes to altitude and wavelength should result in constant changes in resolution (proportional to the ratio of the other two parameters), while changes in aperture diameter result in nonlinear effects on resolution. The tornado plot of the sensitivity of ground-range spatial resolution on these variables is as shown, based on figures for Landsat-8 with +/- 20% and +/- 30% changes:
The differences between these variables is hardly dramatic relative to the baseline! However, we must also consider where they are constrained. The baseline values chosen were 700 meter altitude, 550 nanometer wavelength (green), and 13 mm diameter aperture, and 30 m resolution. Because the Sun’s spectrum peaks in irradiance near this wavelength and drops off sharply with decreasing wavelength, a 30% reduction in wavelength may cut received power in half, leading to a decrease in the signal-to-noise ratio due, ultimately leading to new difficulties in resolving an image. Likewise, a 30% increase to wavelength puts us outside of the visible spectrum and into near-IR.
Conversely, altitude is less constrained. A decrease in altitude by 30% would yield a new mission altitude of 490 m, which is quite low, but still feasible; any lower and gains in spatial resolution will be traded against added costs of station keeping due to the presence of thin upper atmosphere air drag. Additionally, the lower the altitude, the smaller the instantaneous field of view, as shown in the figure below, and fewer total meters of ground area will be able to be imaged. Since remotely sensed scenes are often priced by the square kilometer (Mustafa et al. 2012), this may result in fewer potential product scenes for customers to be and necessitate an increase in price per km2 on existing scenes to break even.
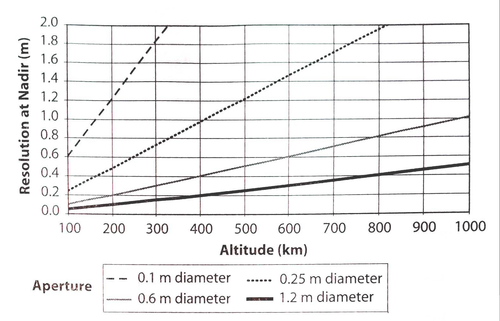
This spatial resolution relationship is also captured well by the following figure, reproduced from Space Mission Engineering: The New SMAD (Wertz et al. 2011). The heightened sensitivity to aperture diameter results in wide variations in the constant slopes of resolution vs. altitude (all lines are held at fixed wavelength in the visible spectrum).
Although we have not yet touched on temporal resolution, our figure of merit concerned with average revisit time and coverage, it will be excluded from this analysis because it is typically simulated numerically in software like STK (Wertz 2011). Although stand-alone analytical methods have been considered recently for applications relevant to road-mapping like system optimization, they nevertheless depend on a wide range factors-- altitude, inclination, eccentricity, swath width, ability to alter pointing from nadir, number of satellites in a constellation-- which may be determined by a particular mission (Nicholas Crisp et al. 2018, arXiV).
We will now discuss a final figure of merit: the data transmission rate of the signal as it relates to radiometric resolution. A Landsat-8 scene is 185 km cross-track and 180 km along-track, yielding a total area of 3.33*1010 square meters. Each pixel in the scene represents 30m, due to Landsat’s spatial resolution, yielding 1.11*109 pixels per full scene. Because Landsat-8 uses 12-bit radiometric resolution (212 = 4096 available grayvalues), each of these scenes represents approximately 1.6 GB of data (verified here: https://www.usgs.gov/faqs/what-are-landsat-collection-1-level-1-data-product-file-sizes?qt-news_science_products=0#qt-news_science_products). Landsat-8 regularly returns ~500 scenes per day (https://landsat.gsfc.nasa.gov/landsat-data-continuity-mission/), totaling over 800 GB of data, which at a mission data rate of ~5 MB/s would be impossible in a 86400 second day without lossless data compression. Based on these parameters, we can set up the following equation: t = (w*l*r)/(X*R*C) where t is the time in seconds to relay a scene, w and l are the swath width and scene length, respectively, r is the radiometric resolution, X is the spatial resolution, see above, R is the data transmission rate (in bits), and C is the lossless compression rate. Again, partial derivatives, assuming variables are totally independent, are relatively easy to compute. Two are shown here as examples, acknowledging that the other four would look very similar. dt/dw = (l*r)/(X*R*C) dt/dX = -(w*l*r)/(X2*R*C)
A tornado chart expressing sensitivity surrounding these variables is shown below.
