PHA (polyhydroxyalkanoate) bioplastics manufacturing
PHA bioplastics manufacturing roadmap
First, this technology roadmap is given a clear and unique identifier:
- 2MPH - PHA manufacturing
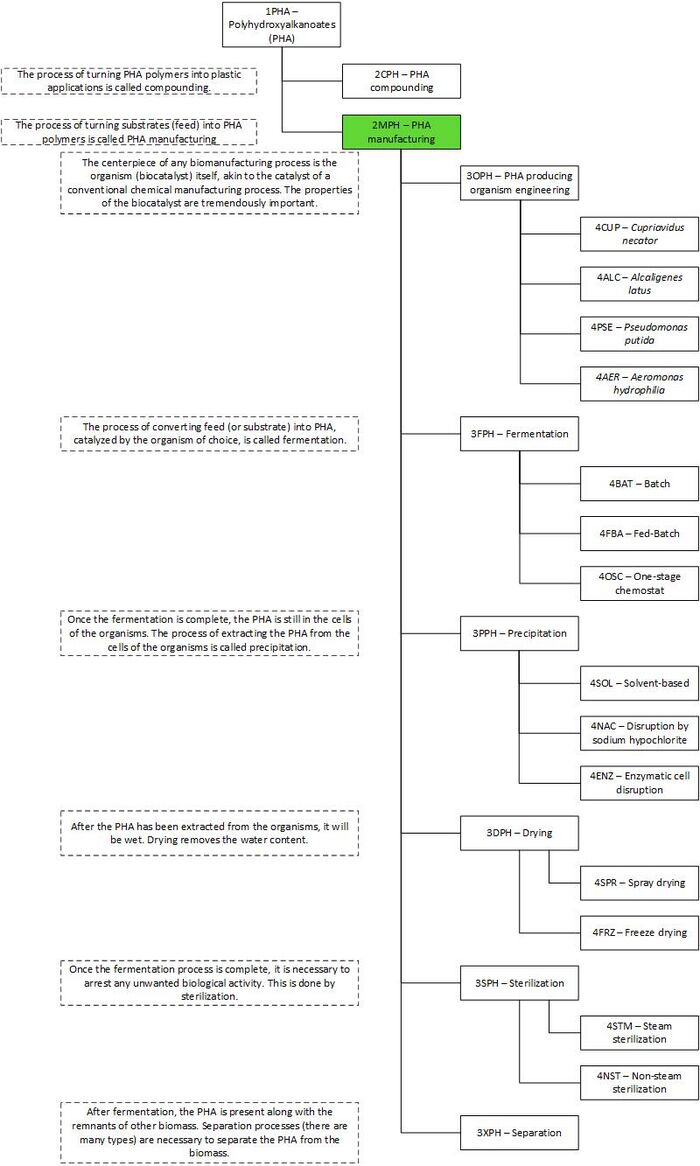
This indicates that we are dealing with a “level 2” roadmap at the product level, where “level 1” would indicate a market level roadmap, and “level 3” or “level 4” would indicate an individual technology roadmap within PHA manufacturing.
Roadmap Overview
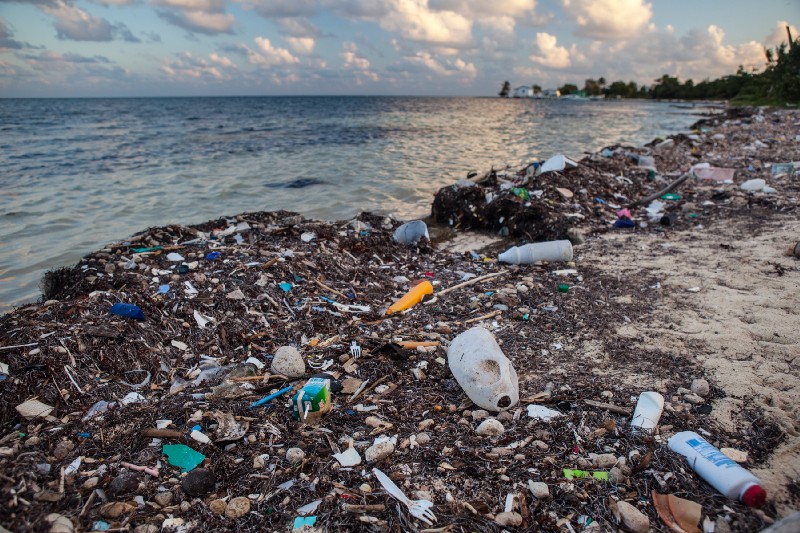
The problem of plastic accumulation in the natural environment is becoming a high profile problem. This is because oil-based plastics, while they are cheap and have good material properties, do not biodegrade.
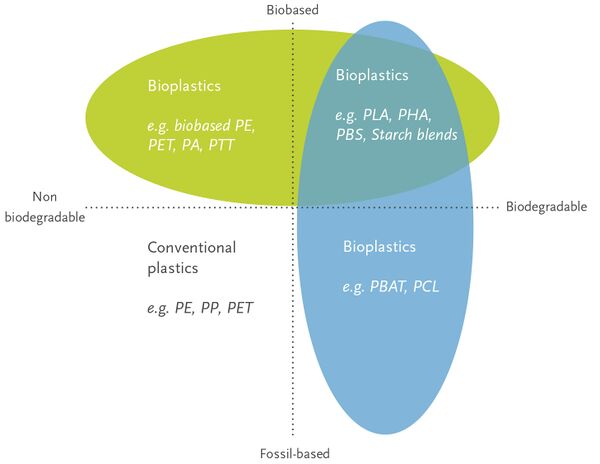
One potential answer to this problem is bioplastics. The term bioplastics covers a lot of different types of materials, some of which are bio-based (i.e. generated from biological feedstocks) but not biodegradable, some of which are biodegradable but not biobased, and some that are both. One family of bioplastics that are bio-based AND biodegradable is PHAs (polyhydroxyalkanoates).
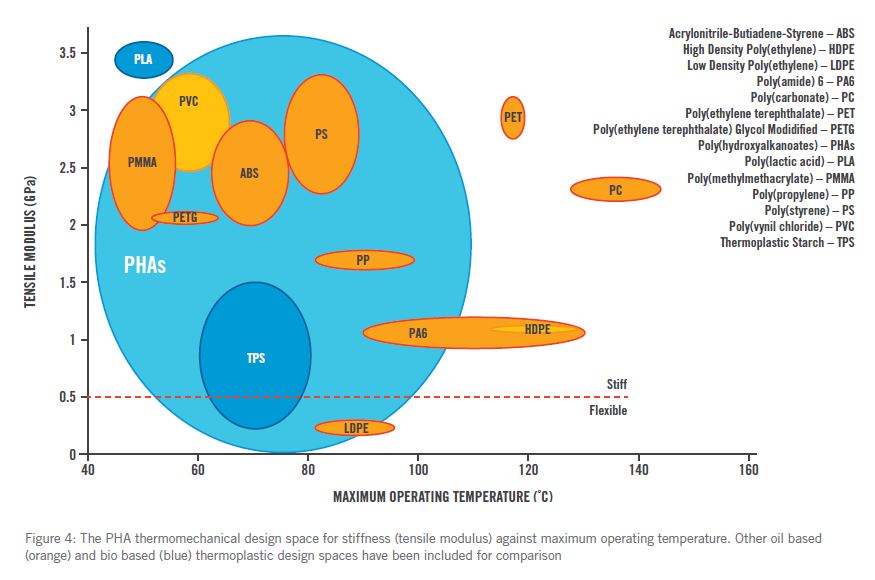
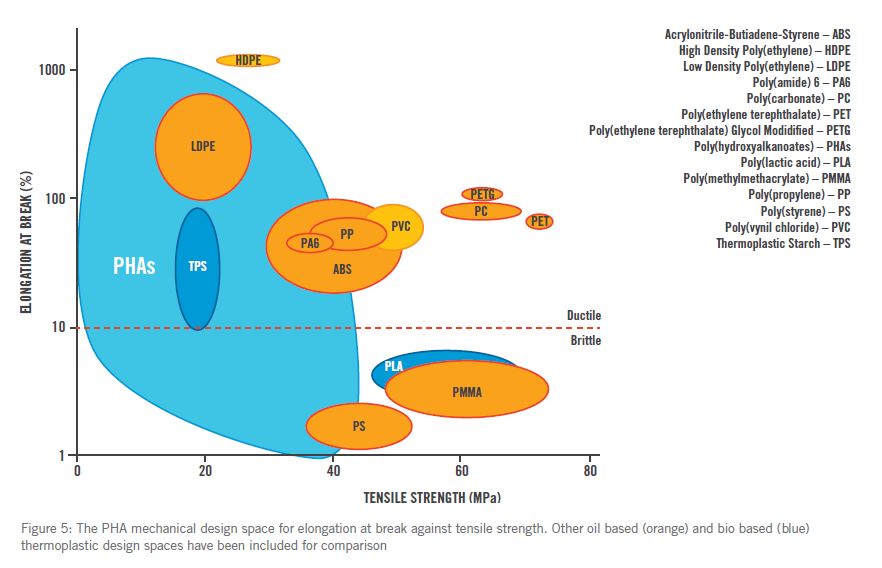
PHAs have the potential to replace oil-based plastics in terms of material properties!
One of the most exciting prospects is a variant of PHA called P(3HB). A comparison of properties with one of the most common forms of oil-based plastic, or polypropylene, is included below. In 2019 alone, a total of 16.8 billion pounds of non-biodegradable polypropylene was produced. Imagine if this amount could be shifted to a biodegradable plastic instead!
| Property | P(3HB) | PP |
|---|---|---|
| Melting temperature (°C) | 175-182 | 171-186 |
| Glass-transition temperature (°C) | 4 | -10 |
| Density (g/cm3) | 1.25 | 0.92 |
| Crystallinity (%) | 65-80 | 65-70 |
| Young's modulus (GPa) | 3.5-4 | 1.7 |
| Tensile strength (MPa) | 40 | 38 |
| Extension to break (%) | 6-8 | 400 |
| Solvent resistance | poor | good |
| Ultraviolet resistance | good | poor |
| Oxygen permeability (cm3 m-2 atm-1 d-1) | 45 | 1700 |
| Biodegradability | excellent | poor or non-existent |
| Cost ($/lb) | 2.25-2.75 | 0.60-0.87 |
Sources:
- Lee, E. Y., & Choi, C. Y. (1997). Biosynthesis and biotechnological production of degradable polyhydroxyalkanoic acid. Biotechnology and Bioprocess Engineering : BBE, 2(1), 1-10. doi:http://dx.doi.org.libproxy.mit.edu/10.1007/BF02932454
- Kourmentza, C., Plácido, J., Venetsaneas, N., Burniol-Figols, A., Varrone, C., Gavala, H. N., & Reis, M. (2017). Recent Advances and Challenges towards Sustainable Polyhydroxyalkanoate (PHA) Production. Bioengineering (Basel, Switzerland), 4(2), 55. https://doi.org/10.3390/bioengineering4020055
As we can see from the table above, P(3HB) compares quite favorably to PP with regard to many mechanical properties and biodegradability. Of course, there are some properties that P(3HB) doesn't match well to - solvent resistance, extension to break, and oxygen permeability to name a few. As the science evolves, those gaps may close. The biggest barrier to increasing adoption is evidenced by the last row - the cost of P(3HB) is nearly 4x the cost of PP at present.
Unfortunately, PHAs currently are not competitive on a cost basis with oil-based plastics due to the high cost of manufacturing them.
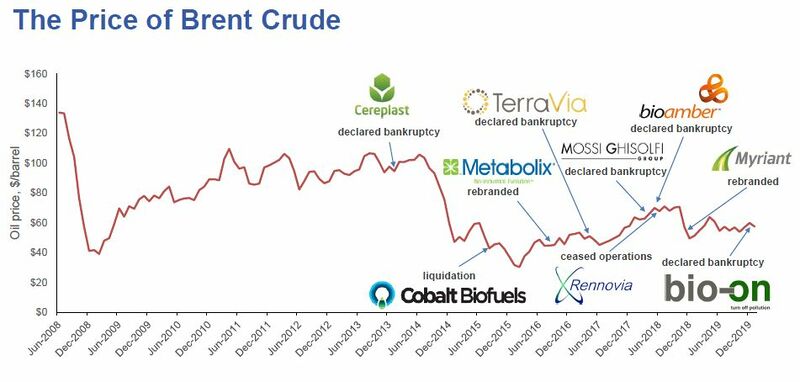
In fact, PHAs are only competitive with oil-based plastics when the price of oil is high. When the price of oil is low, PHA (and other bioplastics producers) suffer.
In this graph, we see a trend of oil prices (using Brent crude as a market) for the last several years. When the price of Brent crude fell in early 2014, the price of oil-based plastics fell in proportion. When the price of oil-based plastics fell, it led to several PHA bioplastics producers to go out of business because they could not produce PHA at a cost-competitive price with oil-based plastics. We want to break this dependence on oil prices. We propose a roadmap to reduce the cost of manufacturing PHA to parity or better with oil-based plastics.
Design Structure Matrix (DSM) Allocation
Blue shaded cells indicate these technologies are connected.
We can also depict the technology hierarchy tree as a DSM (design structure matrix). Based on our current understanding, the 2MPH technology (PHA bioplastic manufacturing) is comprised of separate process steps with no cross-linkage (i.e. completely modular). For example, the drying technology doesn't depend or have any relationship with sterilization technologies. We will be investigate this further.
Roadmap Model using OPM
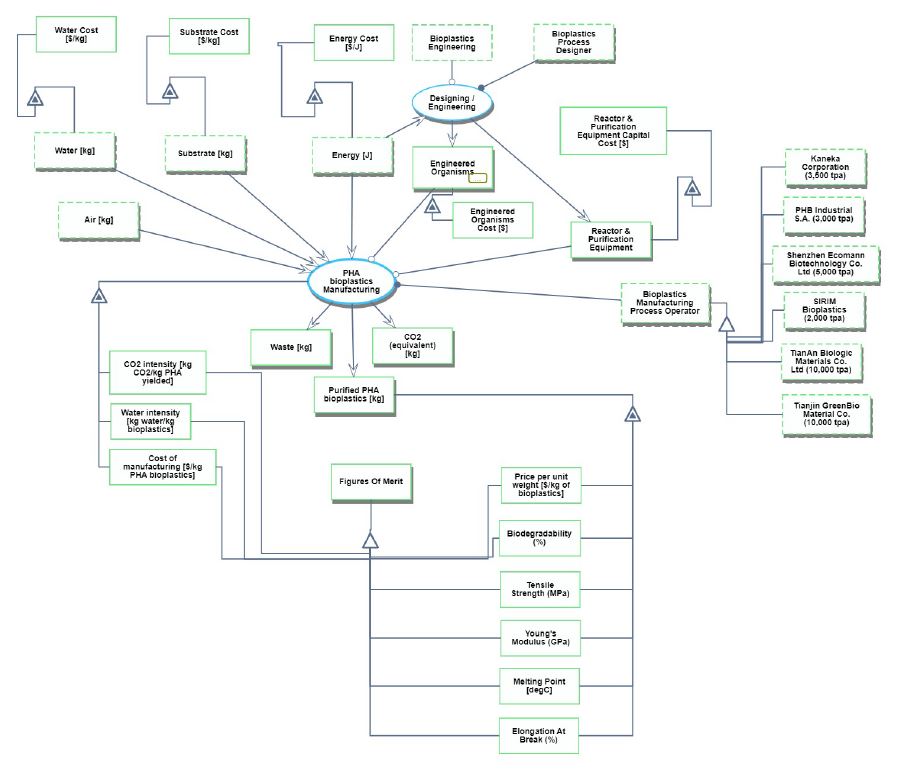
We provide an Object-Process-Diagram (OPD) of the 2MPH technology in the figure below. This diagram captures the main object of the technology (PHA bioplastics manufacturing). Please draw your attention to the right side of the diagram to see current PHA bioplastics manufacturing operators. Then, please draw your attention to the bottom section of the diagram to see the different figures of merit.
An Object-Process-Language (OPL) description of this OPD is auto-generated and given below. It reflects the same content as the previous figure, but in a formal natural language.
- Engineered Organisms is physical and systemic.
- Substrate is physical and environmental.
- Purified PHA bioplastics is physical and systemic.
- Bioplastics Manufacturing Process Operator is physical and environmental.
- Reactor & Purification Equipment is physical and systemic.
- Bioplastics Engineering is informatical and environmental.
- Energy is physical and environmental.
- Bioplastics Process Designer is physical and environmental.
- CO2 is physical and systemic.
- Waste is physical and systemic.
- Land biodegradability of Purified PHA bioplastics is informatical and systemic.
- CO2 intensity of PHA bioplastics Manufacturing is informatical and systemic.
- Tensile Strength of Purified PHA bioplastics is informatical and systemic.
- Young's Modulus of Purified PHA bioplastics is informatical and systemic.
- Water is physical and environmental.
- Water intensity of PHA bioplastics Manufacturing is informatical and systemic.
- Reactor & Purification Equipment Capital Cost of Reactor & Purification Equipment
- is informatical and systemic .
- Engineered Organisms Cost of Engineered Organisms is informatical and systemic.
- Cost of manufacturing of PHA bioplastics Manufacturing is informatical and systemic.
- Price per unit weight of Purified PHA bioplastics is informatical and systemic.
- Ocean biodegradability of Purified PHA bioplastics is informatical and systemic.
- Melting Point of Purified PHA bioplastics is informatical and systemic.
- Substrate Cost of Substrate is informatical and systemic.
- Water Cost of Water is informatical and systemic.
- Energy Cost of Energy is informatical and systemic.
- Air is physical and environmental.
- Elongation At Break of Purified PHA bioplastics is informatical and systemic.
- Figures Of Merit is physical and systemic.
- Kaneka Corporation is physical and environmental.
- PHB Industrial S.A. is physical and environmental.
- Shenzhen Ecomann Biotechnology Co. Ltd is physical and environmental.
- SIRIM Bioplastics is physical and environmental.
- TianAn Biologic Materials Co. Ltd is physical and environmental.
- Tianjin GreenBio Material Co. is physical and environmental.
- Purified PHA bioplastics exhibits Elongation At Break, Land biodegradability, Melting Point,
- Ocean biodegradability, Price per unit weight, Tensile Strength, and Young's Modulus.
- PHA bioplastics Manufacturing exhibits CO2 intensity, Cost of manufacturing, and
- Water intensity.
- Reactor & Purification Equipment exhibits Reactor & Purification Equipment Capital Cost.
- Engineered Organisms exhibits Engineered Organisms Cost.
- Energy exhibits Energy Cost.
- Substrate exhibits Substrate Cost.
- Water exhibits Water Cost.
- CO2 intensity, Cost of manufacturing, Land biodegradability, Melting Point,
- Ocean biodegradability, Price per unit weight, Tensile Strength, Water intensity, and
- Young's Modulus are Figures Of Merit.
- Kaneka Corporation, PHB Industrial S.A., SIRIM Bioplastics,
- Shenzhen Ecomann Biotechnology Co. Ltd, TianAn Biologic Materials Co. Ltd, and
- Tianjin GreenBio Material Co. are Bioplastics Manufacturing Process Operator.
- PHA bioplastics Manufacturing is physical and systemic.
- Bioplastics Manufacturing Process Operator handles PHA bioplastics Manufacturing.
- PHA bioplastics Manufacturing requires Engineered Organisms and
- Reactor & Purification Equipment.
- PHA bioplastics Manufacturing consumes Air, Energy, Substrate, and Water.
- PHA bioplastics Manufacturing yields CO2, Purified PHA bioplastics, and Waste.
- Designing / Engineering is physical and systemic.
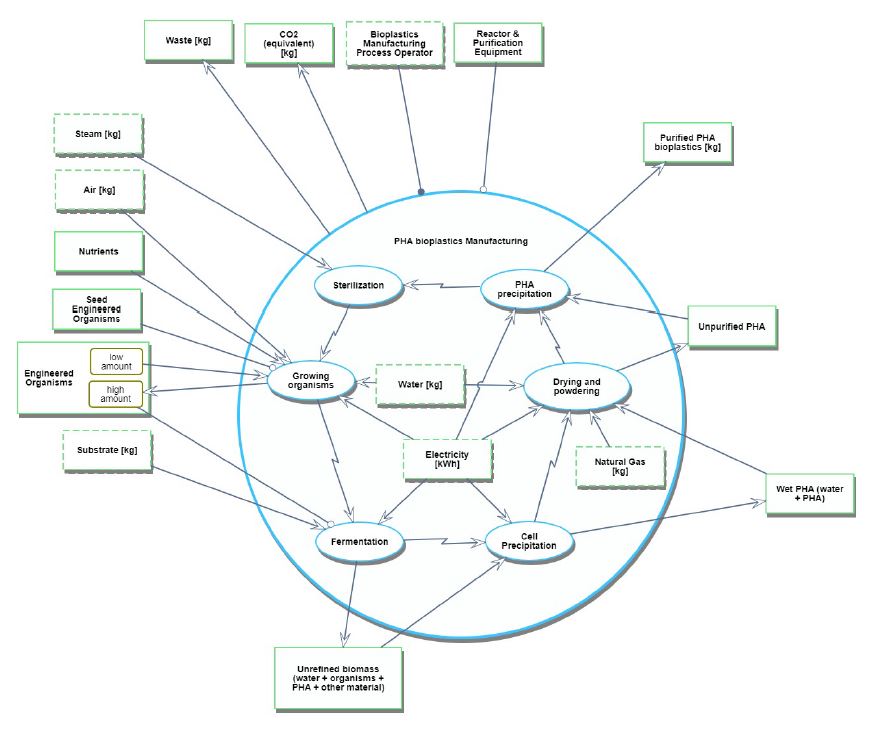
We also provide a OPD of a more detailed view of the 2MPH technology, including the high level process steps that make up PHA bioplastics manufacturing.
An Object-Process-Language (OPL) description of this OPD is auto-generated and given below. It reflects the same content as the previous figure, but in a formal natural language.
- PHA bioplastics Manufacturing from SD zooms in SD1 into Sterilization, PHA precipitation, parallel Growing organisms and Drying and powdering, and parallel Fermentation and Cell Precipitation, as well as Electricity, Natural Gas, and Water.
- Engineered Organisms is physical and systemic.
- Engineered Organisms can be high amount or low amount.
- Substrate is physical and environmental.
- Bioplastics Manufacturing Process Operator is physical and environmental.
- Reactor & Purification Equipment is physical and systemic.
- Air is physical and environmental.
- Purified PHA bioplastics is physical and systemic.
- CO2 is physical and systemic.
- Waste is physical and systemic.
- Seed Engineered Organisms is physical and systemic.
- Nutrients is physical and systemic.
- Unrefined biomass is physical and systemic.
- Steam is physical and environmental.
- Wet PHA is physical and systemic.
- Unpurified PHA is physical and systemic.
- Electricity is physical and environmental.
- Natural Gas is physical and environmental.
- Water is physical and environmental.
- PHA bioplastics Manufacturing is physical and systemic.
- Bioplastics Manufacturing Process Operator handles PHA bioplastics Manufacturing.
- PHA bioplastics Manufacturing requires Reactor & Purification Equipment.
- PHA bioplastics Manufacturing yields CO2 and Waste.
- Growing organisms is physical and systemic.
- Growing organisms changes Engineered Organisms from low amount to high amount.
- Growing organisms requires Seed Engineered Organisms.
- Growing organisms consumes Air, Electricity, Nutrients, and Water.
- Growing organisms invokes Fermentation.
- Fermentation is physical and systemic.
- Fermentation requires Engineered Organisms at state high amount.
- Fermentation consumes Electricity and Substrate.
- Fermentation yields Unrefined biomass.
- Fermentation invokes Cell Precipitation.
- Cell Precipitation is physical and systemic.
- Cell Precipitation consumes Electricity and Unrefined biomass.
- Cell Precipitation yields Wet PHA.
- Cell Precipitation invokes Drying and powdering.
- Drying and powdering is physical and systemic.
- Drying and powdering consumes Electricity, Natural Gas, Water, and Wet PHA.
- Drying and powdering yields Unpurified PHA.
- Drying and powdering invokes PHA precipitation.
- Sterilization is physical and systemic.
- Sterilization consumes Steam.
- Sterilization invokes Growing organisms.
- PHA precipitation is physical and systemic.
- PHA precipitation consumes Electricity and Unpurified PHA.
- PHA precipitation yields Purified PHA bioplastics.
- PHA precipitation invokes Sterilization.
Figures of Merit
The table below show a list of FOMs by which solar electric aircraft can be assessed. The first four (shown in bold) are used to assess the aircraft itself. They are very similar to the FOMs that are used to compare traditional aircraft which are propelled by fossil fuels, the big difference being that 2SEA is essentially emissions free during flight operations. The other rows represent subordinated FOMs which impact the performance and cost of solar electric aircraft but are provided as outputs (primary FOMs) from lower level roadmaps at level 3 or level 4, see the DSM above.
| Grouping | Figure of Merit (FOM) | Calculation Method | Reference value for PHA |
|---|---|---|---|
| Cost | Cost of manufacturing [$/kg of PHA bioplastics yielded] | For a given quantity (kg) of PHA bioplastics produced, the total cost of all variable inputs required (feedstock biomass, energy, labor and utilities) to produce that quantity divided by the quantity of PHA bioplastics produced. | $5-6/kg PHA (2017, versus $1.3 to $1.9/kg for oil-based plastics) |
| Sustainability | Land biodegradability [%mass loss/time in land environment] | For a given quantity of PHA bioplastics, measure the mass lost after a given period of time in the environment on land. | 94% in 180 days for PHA (2018) |
| Sustainability | Ocean biodegradability [%mass loss/time in ocean environment] | For a given quantity of PHA, measure the mass lost after a given period of time in the environment on ocean. | 94% in 180 days for PHA (2018) |
| Sustainability | CO2 intensity [kg CO2/kg PHA yielded] | For a given quantity (kg) of PHA produced, the total CO2 emitted during manufacturing to produce that quantity divided by the quantity of PHA produced. | 1.96 kg CO2/kg PHA (2009) |
| Sustainability | Water intensity [kg water/kg PHA] | For a given quantity (kg) of PHA produced, the total amount of water (kg) consumed divided by the quantity of PHA produced. | 150 kg H2O/kg PHA (2009) |
| Performance | Tensile strength [MPa] | Tensile strength of the PHA manufactured | 0 - 45 MPa (2018) |
| Performance | Young’s modulus (GPa) | Young’s modulus of the PHA manufactured | 0 - 3.5 GPa (2018) |
| Performance | Minimum and maximum operating temperature (degC) | Minimum and maximum operating temperature of the PHA manufactured | 40 - 110 degC (2018) |
| Performance | Elongation at break (%) | Elongation at break of the PHA manufactured as a % of the original length of the PHA | 0 - 1000% (2018) |
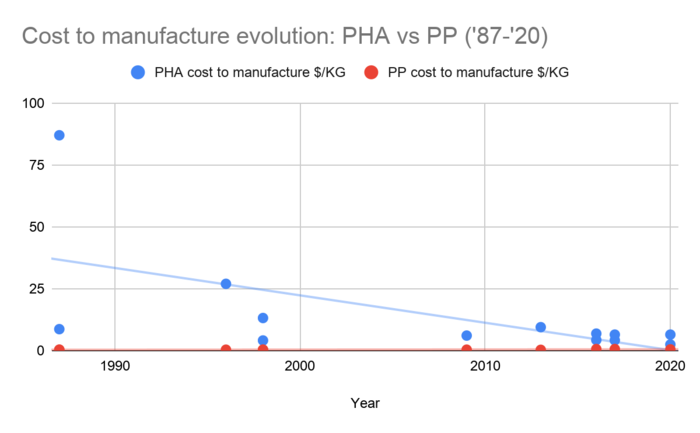
This first chart shows how one of the most important FOMs, the cost to manufacture PHA as expressed by lower and upper bounds as reported in literature, has varied over the past 30+ years. There are upper and lower bounds on the cost to manufacture PHA because the cost can vary significantly with the choice of feedstock (substrate). At this time, it is not clear if there is a tradeoff between the choice of cheaper feedstock and the performance (either sustainability or material properties) of the PHA produced.
This graph zooms into the last 20 years of the upper and lower reported ranges of PHA price FOM and compares it to the cost of oil-based plastic. The current goal is to get the cost of PHA to at or below the cost of the oil-based plastics (like PP, or polypropylene).
Alignment with Company Strategic Drivers
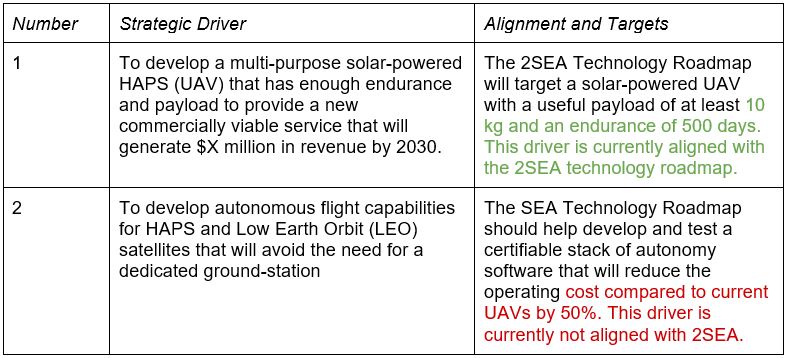
The table below shows an example of potential strategic drivers and alignment of the 2SEA technology roadmap with it.
The list of drivers shows that the company views HAPS as a potential new business and wants to develop it as a commercially viable (for profit) business (1). In order to do so, the technology roadmap performs some analysis - using the governing equations in the previous section - and formulates a set of FOM targets that state that such a UAV needs to achieve an endurance of 500 days (as opposed to the world record 26 days that was demonstrated in 2018) and should be able to carry a payload of 10 kg. The roadmap confirms that it is aligned with this driver. This means that the analysis, technology targets, and R&D projects contained in the roadmap (and hopefully funded by the R&D budget) support the strategic ambition stated by driver 1. The second driver, however, which is to use the HAPS program as a platform for developing an autonomy stack for both UAVs and satellites, is not currently aligned with the roadmap.
Positioning of Company vs. Competition
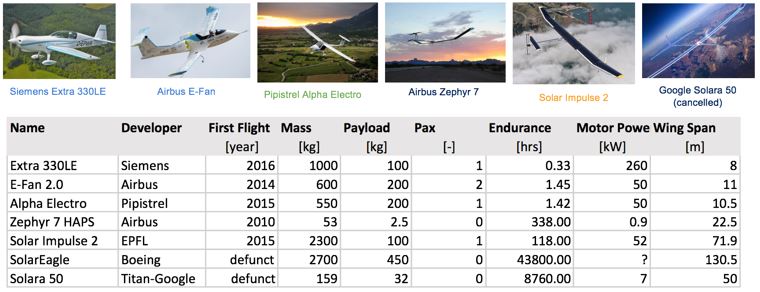
The figure below shows a summary of other electric and solar-electric aircraft from public data.
The aerobatic aircraft Extra 330LE by Siemens currently has the world record for the most powerful flight certified electric motor (260kW). The Pipistrel Alpha Electro is a small electric training aircraft which is not solar powered, but is in serial production. The Zephyr 7 is the previous version of Zephyr which established the prior endurance world record for solar-electric aircraft (14 days) in 2010. The Solar Impulse 2 was a single-piloted solar-powered aircraft that circumnavigated the globe in 2015-2016 in 17 stages, the longest being the one from Japan to Hawaii (118 hours).
SolarEagle and Solara 50 were both very ambitious projects that aimed to launch solar-electric aircraft with very aggressive targets (endurace up to 5 years) and payloads up to 450 kg. Both of these projects were canceled prematurely. Why is that?
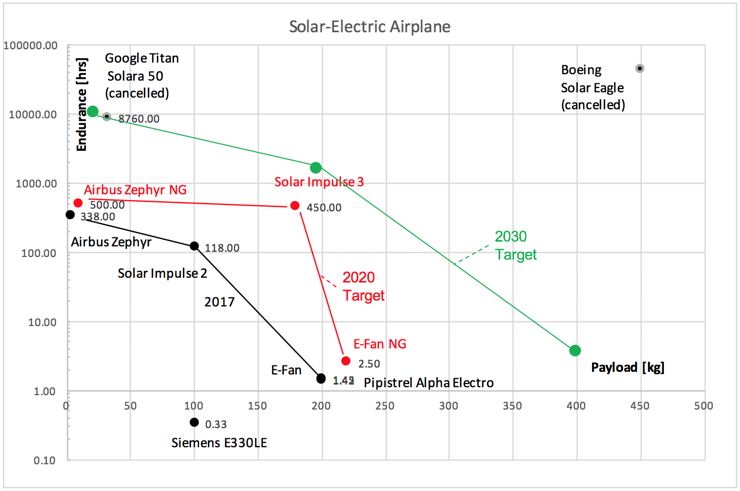
The Pareto Front (see Chapter 5, Figure 5-20 for a definition) shown in black in the lower left corner of the graph shows the best tradeoff between endurance and payload for actually achieved electric flights by 2017. The Airbus Zephyr, Solar Impulse 2 and Pipistrel Alpha Electro all have flight records that anchor their position on this FOM chart. It is interesting to note that Solar Impulse 2 overheated its battery pack during its longest leg in 2015-2016 and therefore pushed the limits of battery technology available at that time. We can now see that both Solar Eagle in the upper right and Solara 50 were chasing FOM targets that were unachievable with the technology available at that time. The progression of the Pareto front shown in red corresponds to what might be a realistic Pareto Front progression by 2020. Airbus Zephyr Next Generation (NG) has already shown with its world record (624 hours endurance) that the upper left target (low payload mass - about 5-10 kg and high endurance of 600+ hours) is feasible. There are currently no plans for a Solar Impulse 3, which could be a non-stop solar-electric circumnavigation with one pilot (and an autonomous co-pilot) which would require a non-stop flight of about 450 hours. A next generation E-Fan aircraft with an endurance of about 2.5 hours (all electric) also seems within reach for 2020. Then in green we set a potentially more ambitious target Pareto Front for 2030. This is the ambition of the 2SEA technology roadmap as expressed by strategic driver 1. We see that in the upper left the Solara 50 project which was started by Titan Aerospace, then acquired by Google, then cancelled, and which ran from about 2013-2017 had the right targets for about a 2030 Entry-into-Service (EIS), not for 2020 or sooner. The target set by Solar Eagle was even more utopian and may not be achievable before 2050 according to the 2SEA roadmap.
Technical Model
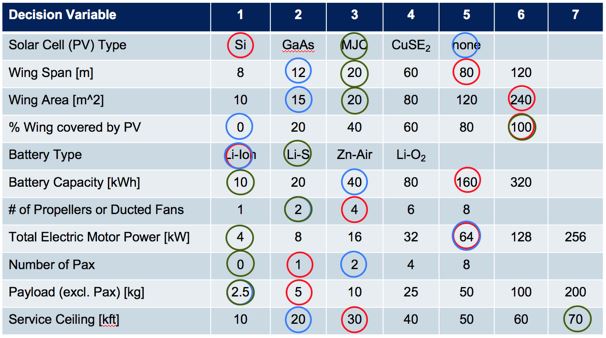
In order to assess the feasibility of technical (and financial) targets at the level of the 2SEA roadmap it is necessary to develop a technical model. The purpose of such a model is to explore the design tradespace and establish what are the active constraints in the system. The first step can be to establish a morphological matrix that shows the main technology selection alternatives that exist at the first level of decomposition, see the figure below.
It is interesting to note that the architecture and technology selections for the three aircraft (Zephyr, Solar Impulse 2 and E-Fan 2.0) are quite different. While Zephyr uses lithium-sulfur batteries, the other two use the more conventional lithium-ion batteries. Solar Impulse uses the less efficient (but more affordable) single cell silicon-based PV, while Zephyr uses specially manufactured thin film multi-junction cells and so forth.
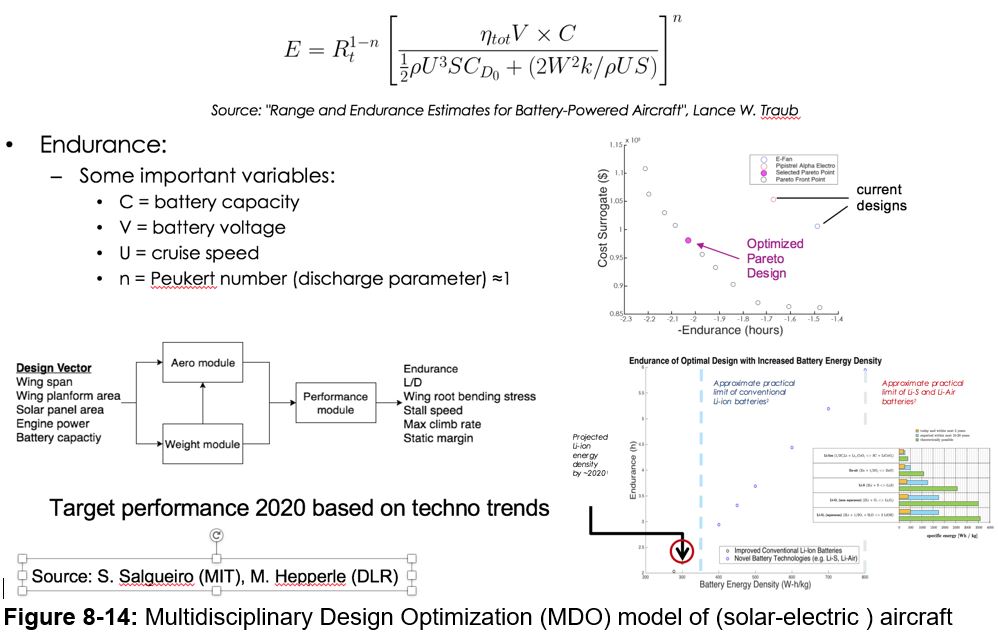
The technical model centers on the E-range and E-endurance equations and compares different aircraft sizing (e.g. wing span, engine power, battery capacity) taking into account aerodynamics, weights and balance, the performance of the aircraft and also its manufacturing cost. It is important to use Multidisciplinary Design Optimization (MDO) when selecting and sizing technologies in order to get the most out of them and compare them fairly (see below).
Financial Model
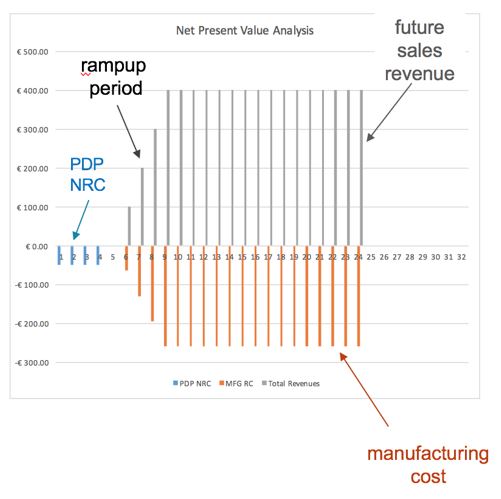
The figure below contains a sample NPV analysis underlying the 2SEA roadmap. It shows the non-recurring cost (NRC) of the product development project (PDP), which includes the R&D expenditures as negative numbers. A ramp up-period of 4 years is planned with a flat revenue plateau (of 400 million per year) and a total program duration of 24 years.
List of R&T Projects and Prototypes
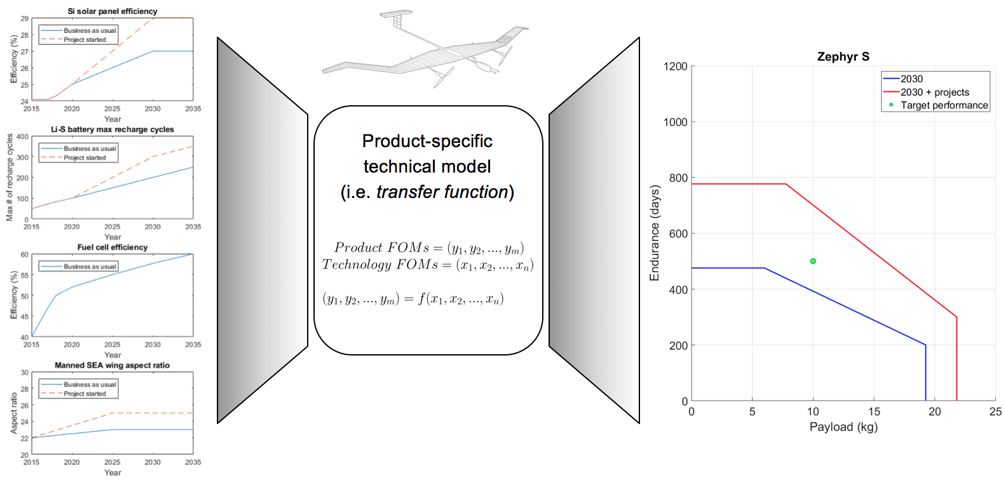
In order to select and prioritize R&D (R&T) projects we recommend using the technical and financial models developed as part of the roadmap to rank-order projects based on an objective set of criteria and analysis. The figure below illustrates how technical models are used to make technology project selections, e.g based on the previously stated 2030 target performance and Figure 8-17 (see the Chapter 8 of the text) shows the outcome if none of the three potential projects are selected.
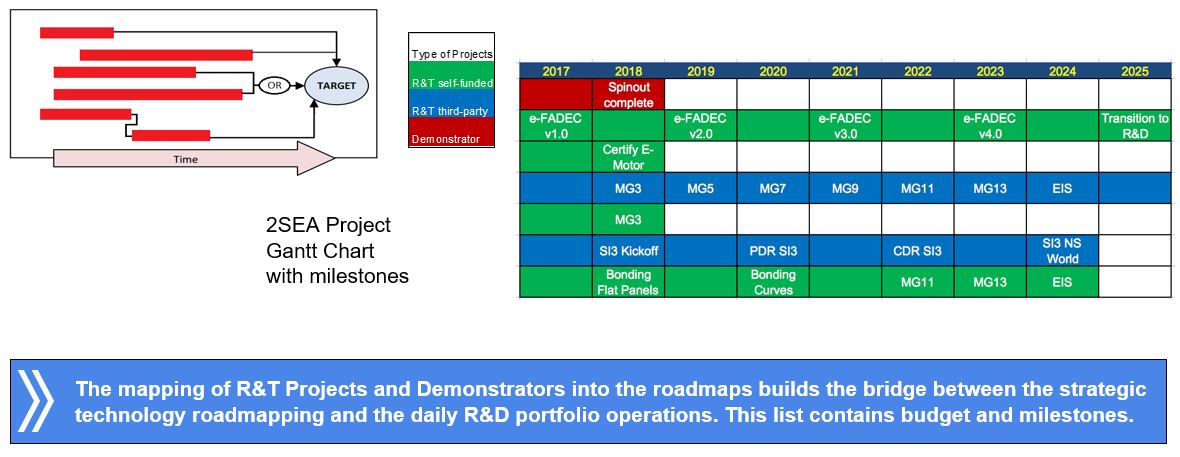
A roadmap shows the R&T/R&D projects and demonstrators that have been (completed), are being (active) and could be (proposed) undertaken in order to progress the technology at the component or system level towards the set targets/goal set by the higher or lower-level roadmap. Please add what is essentially a Gantt Chart with milestones.
Key Publications, Presentations and Patents
A good technology roadmap should contain a comprehensive list of publications, presentations and key patents as shown in Figure 8-19. This includes literature trends, papers published at key conferences and in the trade literature and trade press.

![Oil-based plastic [PP] vs Bioplastic [PHA] price evolution](/images/thumb/8/89/PP_vs_PHA_cost_evolution.png/600px-PP_vs_PHA_cost_evolution.png)
