¶ PHA bioplastics manufacturing roadmap
First, this technology roadmap is given a clear and unique identifier:
- 2MPH - PHA manufacturing
This indicates that we are dealing with a “level 2” roadmap at the product level, where “level 1” would indicate a market level roadmap, and “level 3” or “level 4” would indicate an individual technology roadmap within PHA manufacturing.
¶ Roadmap Overview

Plastic pollution. Credit: ead72 - stock.adobe.com Copyright: ©ead72 - stock.adobe.com
The problem of plastic accumulation in the natural environment is becoming a high profile problem. This is because oil-based plastics, while they are cheap and have good material properties, do not biodegrade.
One potential answer to this problem is bioplastics. The term bioplastics covers a lot of different types of materials, some of which are bio-based (i.e. generated from biological feedstocks) but not biodegradable, some of which are biodegradable but not biobased, and some that are both. One family of bioplastics that are bio-based AND biodegradable is PHAs (polyhydroxyalkanoates).
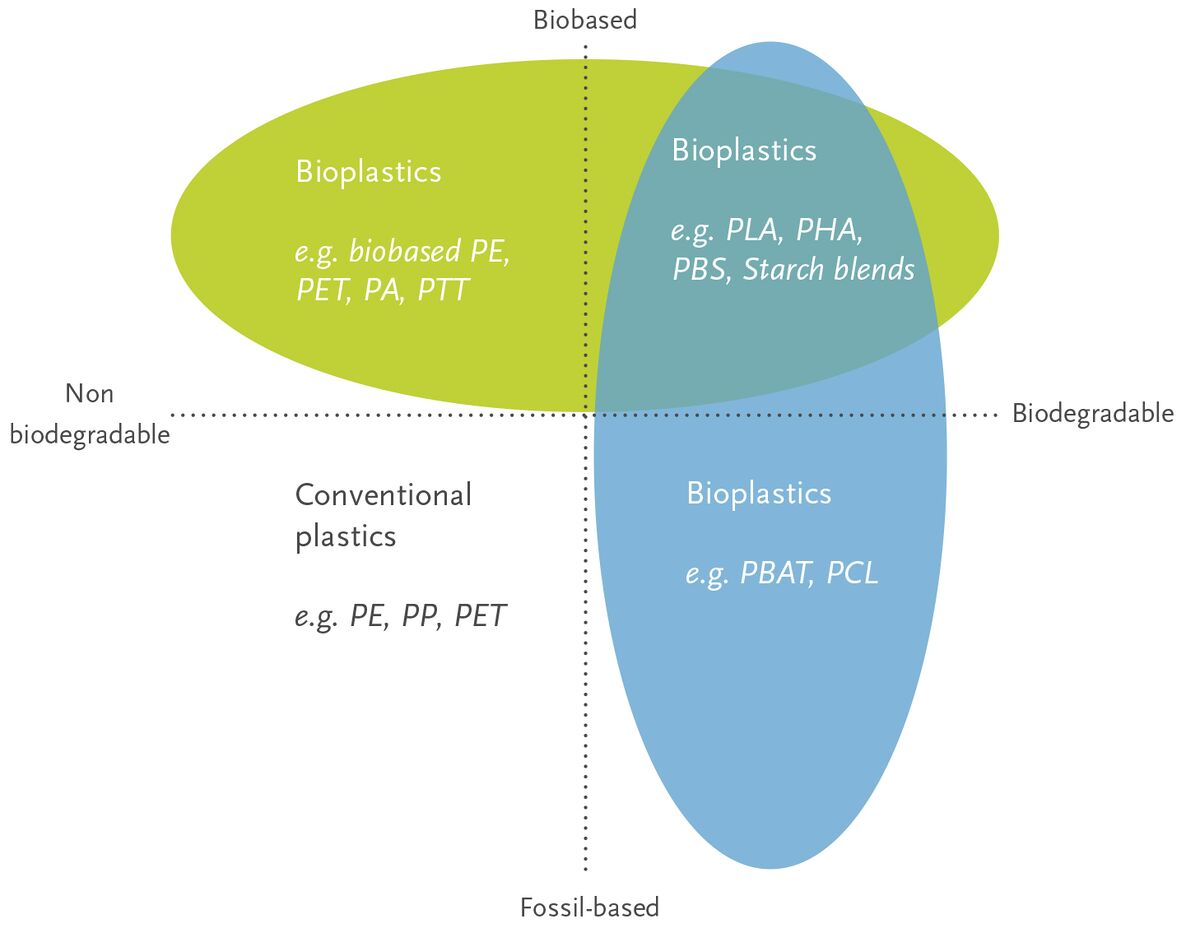
PHAs have the potential to replace oil-based plastics in terms of material properties! As one can see from the two images below, the range of properties that PHAs (blue) shows sizable overlap with the range of properties that oil-based plastics can exhibit.
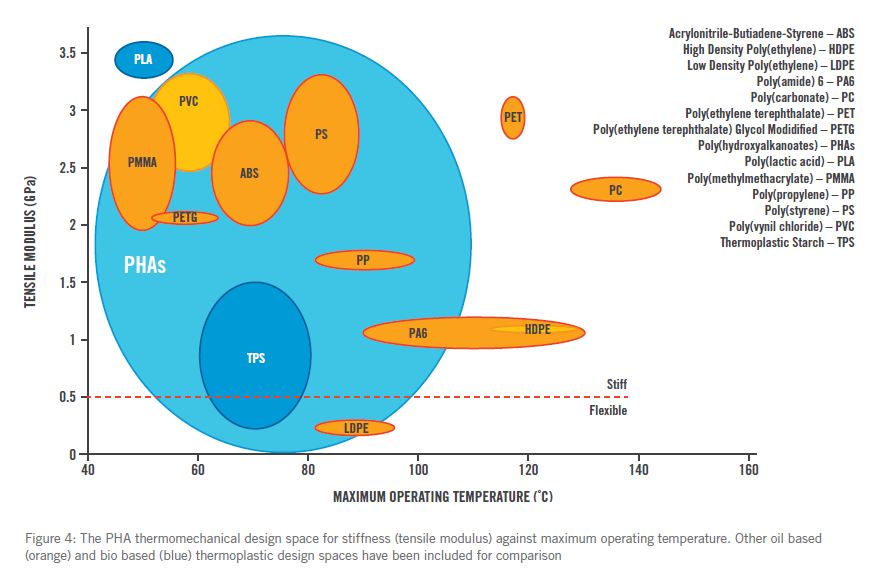

One of the most exciting prospects is a variant of PHA called P(3HB). A comparison of properties with one of the most common forms of oil-based plastic, or polypropylene, is included below. In 2019 alone, a total of 16.8 billion pounds or 7.6 million tonnes of non-biodegradable polypropylene was produced. Imagine if this amount could be shifted to a biodegradable plastic instead!
| Property | P(3HB) | PP |
|---|---|---|
| Melting temperature (°C) | 175-182 | 171-186 |
| Glass-transition temperature (°C) | 4 | -10 |
| Density (g/cm3) | 1.25 | 0.92 |
| Crystallinity (%) | 65-80 | 65-70 |
| Young's modulus (GPa) | 3.5-4 | 1.7 |
| Tensile strength (MPa) | 40 | 38 |
| Extension to break (%) | 6-8 | 400 |
| Solvent resistance | poor | good |
| Ultraviolet resistance | good | poor |
| Oxygen permeability (cm3 m-2 atm-1 d-1) | 45 | 1700 |
| Biodegradability | excellent | poor or non-existent |
| Cost ($/kg) | 3.0-6.1 | 1.3-1.9 |
Sources:
- Kourmentza, C., Plácido, J., Venetsaneas, N., Burniol-Figols, A., Varrone, C., Gavala, H. N., & Reis, M. (2017). Recent Advances and Challenges towards Sustainable Polyhydroxyalkanoate (PHA) Production. Bioengineering (Basel, Switzerland), 4(2), 55. https://doi.org/10.3390/bioengineering4020055
As we can see from the table above, P(3HB) compares quite favorably to PP with regard to many mechanical properties and biodegradability. Of course, there are some properties that P(3HB) doesn't match well to - solvent resistance, extension to break, and oxygen permeability to name a few. As the science evolves, those gaps may close. The biggest barrier to increasing adoption is evidenced by the last row - the cost of P(3HB) is nearly 4x the cost of PP at present.
Unfortunately, PHAs currently are not competitive on a cost basis with oil-based plastics due to the high cost of manufacturing them. In fact, PHAs are only competitive with oil-based plastics when the price of oil is high. When the price of oil is low, PHA (and other bioplastics producers) suffer.
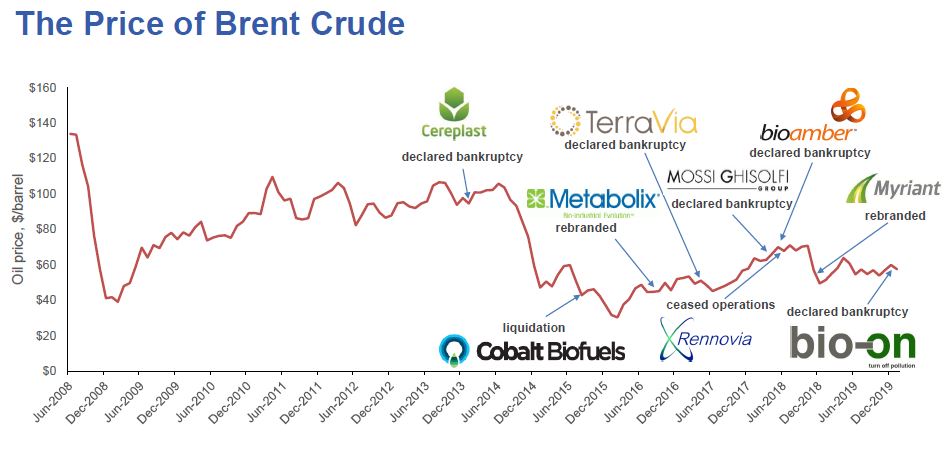
In this graph, we see a trend of oil prices (using Brent crude as a market) for the last several years. When the price of Brent crude fell in early 2014, the price of oil-based plastics fell in proportion. When the price of oil-based plastics fell, it led to several PHA bioplastics producers to go out of business because they could not produce PHA at a cost-competitive price with oil-based plastics. We want to break this dependence on oil prices. We propose a roadmap to reduce the cost of manufacturing PHA to parity or better with oil-based plastics.

¶ Design Structure Matrix (DSM) Allocation
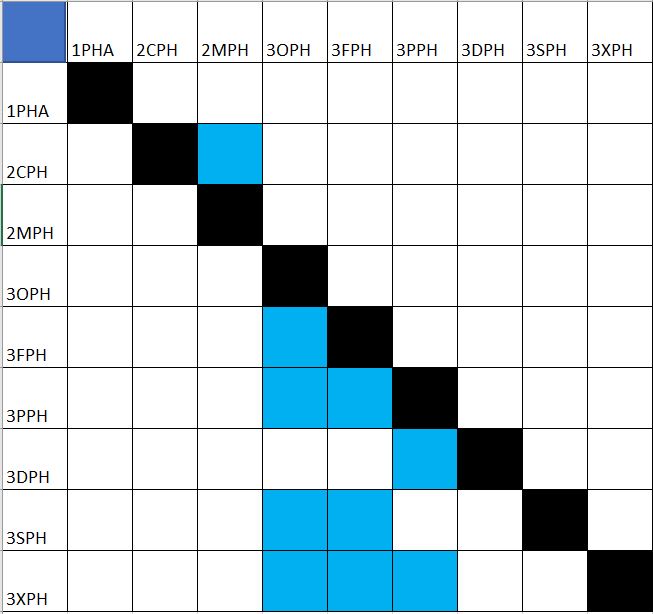
The technology hierarchy tree shows the levels of each technology and what is contained in each level of technology. We can also depict the interdependencies between the technologies as a DSM (design structure matrix). The way to interpret this DSM is the inputs are on the rows. For example, 3OPH (PHA producing engineered organisms) affects the technology selected for the 3FPH (fermentation), 3PPH (precipitation), 3SPH (sterilization), and 3XPH (separation) but is not itself affected by the technology selected for these steps.
Please note that interdependencies were only captured between levels (i.e. at level 2 or at level 3, but not crossing between level 2 and 3).
This DSM highlights how important the 3OPH and 3FPH technologies are to the overall process - they affect the rest of the process steps, but they are not affected in turn.
The level 4 technologies (4XXX) are specific variants of the level 3 technologies (3XXX) and as such are not depicted here.
¶ Roadmap Model using OPM
We provide an Object-Process-Diagram (OPD) of the 2MPH technology in the figure below. This diagram captures the main object of the technology (PHA bioplastics manufacturing). Please draw your attention to the right side of the diagram to see current PHA bioplastics manufacturing operators. Then, please draw your attention to the bottom section of the diagram to see the different figures of merit.
High level OPM for 2MPH
An Object-Process-Language (OPL) description of this OPD is auto-generated and given below. It reflects the same content as the previous figure, but in a formal natural language.
- Engineered Organisms is physical and systemic.
- Substrate is physical and environmental.
- Purified PHA bioplastics is physical and systemic.
- Bioplastics Manufacturing Process Operator is physical and environmental.
- Reactor & Purification Equipment is physical and systemic.
- Bioplastics Engineering is informatical and environmental.
- Energy is physical and environmental.
- Bioplastics Process Designer is physical and environmental.
- CO2 is physical and systemic.
- Waste is physical and systemic.
- Biodegradability of Purified PHA bioplastics is informatical and systemic.
- CO2 intensity of PHA bioplastics Manufacturing is informatical and systemic.
- Tensile Strength of Purified PHA bioplastics is informatical and systemic.
- Young's Modulus of Purified PHA bioplastics is informatical and systemic.
- Water is physical and environmental.
- Water intensity of PHA bioplastics Manufacturing is informatical and systemic.
- Reactor & Purification Equipment Capital Cost of Reactor & Purification Equipment
- is informatical and systemic.
- Engineered Organisms Cost of Engineered Organisms is informatical and systemic.
- Cost of manufacturing of PHA bioplastics Manufacturing is informatical and systemic.
- Price per unit weight of Purified PHA bioplastics is informatical and systemic.
- Melting Point of Purified PHA bioplastics is informatical and systemic.
- Substrate Cost of Substrate is informatical and systemic.
- Water Cost of Water is informatical and systemic.
- Energy Cost of Energy is informatical and systemic.
- Air is physical and environmental.
- Elongation At Break of Purified PHA bioplastics is informatical and systemic.
- Figures Of Merit is physical and systemic.
- Kaneka Corporation is physical and environmental.
- PHB Industrial S.A. is physical and environmental.
- Shenzhen Ecomann Biotechnology Co. Ltd is physical and environmental.
- SIRIM Bioplastics is physical and environmental.
- TianAn Biologic Materials Co. Ltd is physical and environmental.
- Tianjin GreenBio Material Co. is physical and environmental.
- Purified PHA bioplastics exhibits Biodegradability, Elongation At Break, Melting Point, Price per unit weight, Tensile Strength, and Young's Modulus.
- PHA bioplastics Manufacturing exhibits CO2 intensity, Cost of manufacturing, and Water intensity.
- Reactor & Purification Equipment exhibits Reactor & Purification Equipment Capital Cost.
- Engineered Organisms exhibits Engineered Organisms Cost.
- Energy exhibits Energy Cost.
- Substrate exhibits Substrate Cost.
- Water exhibits Water Cost.
- Biodegradability, CO2 intensity, Cost of manufacturing, Elongation At Break, Melting Point, Price per unit weight, Tensile Strength, Water intensity, and Young's Modulus are Figures Of Merit.
- Kaneka Corporation, PHB Industrial S.A., SIRIM Bioplastics, Shenzhen Ecomann Biotechnology Co. Ltd, TianAn Biologic Materials Co. Ltd, and Tianjin GreenBio Material Co. are Bioplastics Manufacturing Process Operator.
- PHA bioplastics Manufacturing is physical and systemic.
- Bioplastics Manufacturing Process Operator handles PHA bioplastics Manufacturing.
- PHA bioplastics Manufacturing requires Engineered Organisms and
- Reactor & Purification Equipment.
- PHA bioplastics Manufacturing consumes Air, Energy, Substrate, and Water.
- PHA bioplastics Manufacturing yields CO2, Purified PHA bioplastics, and Waste.
- Designing / Engineering is physical and systemic.
- Bioplastics Process Designer handles Designing / Engineering.
- Designing / Engineering requires Bioplastics Engineering.
- Designing / Engineering consumes Energy.
- Designing / Engineering yields Engineered Organisms and Reactor & Purification Equipment.
The 2MPH technology, the production process itself, is typically shown as below:
Generalized version of the PHA bioplastics manufacturing process (non-solvent version)
Source: Chen, Guo-Qiang. (2009). Industrial production of PHA. 10.1007/978-3-642-03287-5_6.
We also provide a OPD version of the above, including the high level process steps that make up PHA bioplastics manufacturing.
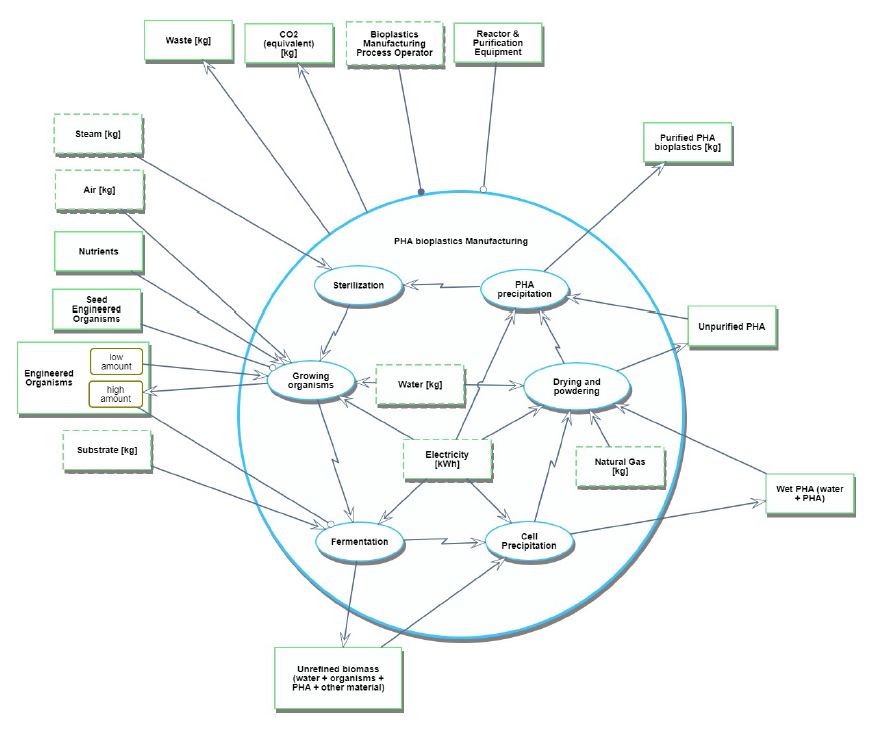
An Object-Process-Language (OPL) description of this OPD is auto-generated and given below. It reflects the same content as the previous figure, but in a formal natural language.
- PHA bioplastics Manufacturing from SD zooms in SD1 into Sterilization, PHA precipitation, parallel Growing organisms and Drying and powdering, and parallel Fermentation and Cell Precipitation, as well as Electricity, Natural Gas, and Water.
- Engineered Organisms is physical and systemic.
- Engineered Organisms can be high amount or low amount.
- Substrate is physical and environmental.
- Bioplastics Manufacturing Process Operator is physical and environmental.
- Reactor & Purification Equipment is physical and systemic.
- Air is physical and environmental.
- Purified PHA bioplastics is physical and systemic.
- CO2 is physical and systemic.
- Waste is physical and systemic.
- Seed Engineered Organisms is physical and systemic.
- Nutrients is physical and systemic.
- Unrefined biomass is physical and systemic.
- Steam is physical and environmental.
- Wet PHA is physical and systemic.
- Unpurified PHA is physical and systemic.
- Electricity is physical and environmental.
- Natural Gas is physical and environmental.
- Water is physical and environmental.
- PHA bioplastics Manufacturing is physical and systemic.
- Bioplastics Manufacturing Process Operator handles PHA bioplastics Manufacturing.
- PHA bioplastics Manufacturing requires Reactor & Purification Equipment.
- PHA bioplastics Manufacturing yields CO2 and Waste.
- Growing organisms is physical and systemic.
- Growing organisms changes Engineered Organisms from low amount to high amount.
- Growing organisms requires Seed Engineered Organisms.
- Growing organisms consumes Air, Electricity, Nutrients, and Water.
- Growing organisms invokes Fermentation.
- Fermentation is physical and systemic.
- Fermentation requires Engineered Organisms at state high amount.
- Fermentation consumes Electricity and Substrate.
- Fermentation yields Unrefined biomass.
- Fermentation invokes Cell Precipitation.
- Cell Precipitation is physical and systemic.
- Cell Precipitation consumes Electricity and Unrefined biomass.
- Cell Precipitation yields Wet PHA.
- Cell Precipitation invokes Drying and powdering.
- Drying and powdering is physical and systemic.
- Drying and powdering consumes Electricity, Natural Gas, Water, and Wet PHA.
- Drying and powdering yields Unpurified PHA.
- Drying and powdering invokes PHA precipitation.
- Sterilization is physical and systemic.
- Sterilization consumes Steam.
- Sterilization invokes Growing organisms.
- PHA precipitation is physical and systemic.
- PHA precipitation consumes Electricity and Unpurified PHA.
- PHA precipitation yields Purified PHA bioplastics.
- PHA precipitation invokes Sterilization.
¶ Figures of Merit
The table below show a list of different FOMs by which PHAs and the PHA manufacturing process can be assessed.
| Grouping | Figure of Merit (FOM) | Calculation Method | Reference value for the family of PHA polymers |
|---|---|---|---|
| Cost | Cost of manufacturing [$/kg of PHA bioplastics yielded] | For a given quantity (kg) of PHA bioplastics produced, the total cost of all variable inputs required (feedstock biomass, energy, labor and utilities) to produce that quantity divided by the quantity of PHA bioplastics produced. | $3 - 6/kg PHA (2017, versus $1.3 - 1.9/kg for oil-based plastics) |
| Sustainability | Biodegradability (%) | Measure the CO2 evolved by a given quantity of PHA bioplastics and compare it to the amount of CO2 evolved by the same amounts of starch and PE (polyethylene) respectively. | 68.3% for P(3HB) (2012) |
| Sustainability | CO2 intensity [kg CO2/kg PHA yielded] | For a given quantity (kg) of PHA produced, the total CO2 emitted during manufacturing to produce that quantity divided by the quantity of PHA produced. | 1.96 kg CO2/kg PHA (2009) |
| Sustainability | Water intensity [kg water/kg PHA] | For a given quantity (kg) of PHA produced, the total amount of water (kg) consumed divided by the quantity of PHA produced. | 150 kg H2O/kg PHA (2009) |
| Performance | Tensile strength [MPa] | Tensile strength of the PHA manufactured | 0 - 45 MPa (2018) |
| Performance | Young’s modulus (GPa) | Young’s modulus of the PHA manufactured | 0 - 3.5 GPa (2018) |
| Performance | Minimum and maximum operating temperature (degC) | Minimum and maximum operating temperature of the PHA manufactured | 40 - 110 degC (2018) |
| Performance | Elongation at break (%) | Elongation at break of the PHA manufactured as a % of the original length of the PHA | 0 - 1000% (2018) |
Our research has revealed that the PHA manufacturing process itself does not affect the sustainability and performance FOMs listed above. Rather, these are properties inherent to the type of PHA formed. The family of PHA polymers is large, and each of the members have their own mechanical properties, just like the family of oil-based plastics (HDPE vs LLDPE, etc.). Therefore, the cost of manufacturing, which IS affected by the choices made when designing the PHA manufacturing process, will be the focus of this roadmap and analysis.
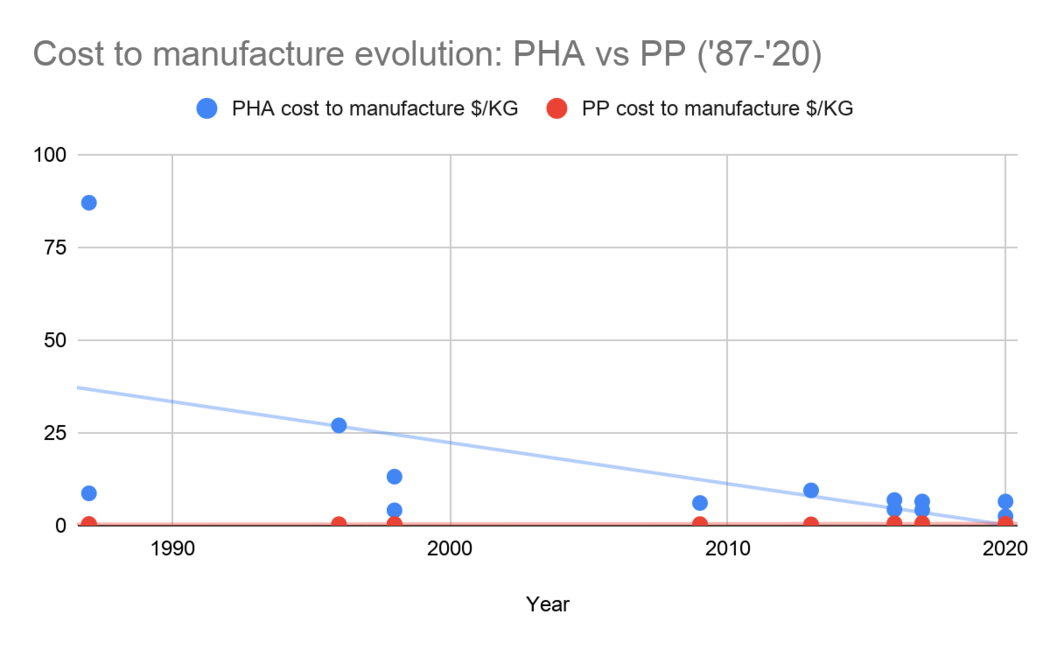
This first chart shows how one of the most important FOMs, the cost to manufacture PHA as reported in literature, has varied over the past 30+ years.
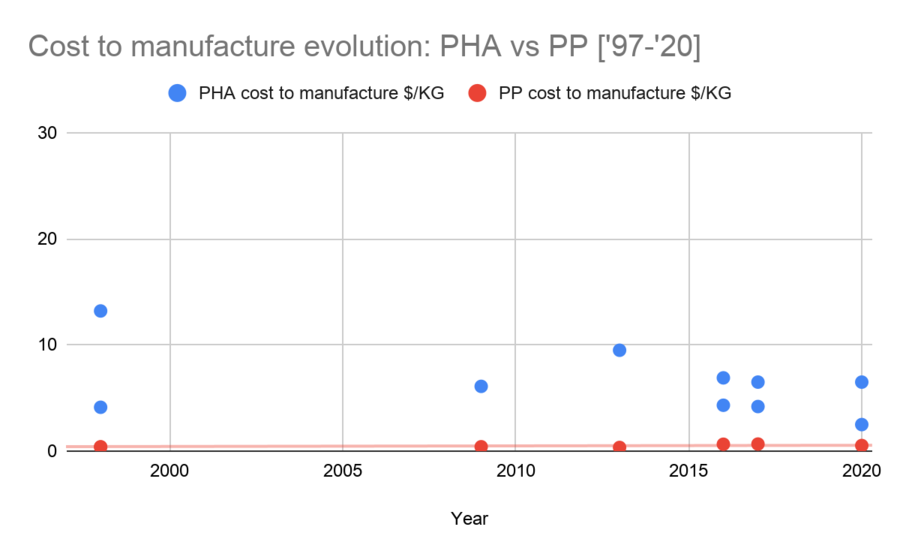
This graph zooms into the last 20 years of reported PHA price and compares it to the cost of PP, an oil-based plastic. The current goal is to get the cost of PHA to at or below the cost of the oil-based plastics (like PP, or polypropylene).
¶ Alignment with Company Strategic Drivers
| Number | Strategic Driver | Alignment and Targets |
|---|---|---|
| 1 | To develop a process to manufacture PHAs with desirable properties at a price point competitive with existing oil-based plastics. | This roadmap will target the design of a manufacturing process that will bring the cost per KG of P(3HB) to ~$1.5/kg or less, which is about 50% lower than the current achievable cost to produce P(3HB) - $3-6/kg. This driver is currently aligned with the PHA bioplastics manufacturing technology roadmap. |
| 2 | To develop a process to manufacture PHAs that are designed to be recovered via composting (to ensure the carbon stays fixed and doesn't go into the atmosphere as CO2) | The technology roadmap will target optimizing the physical and biodegradability properties of PHAs to ensure they can be sorted and recovered at end-of-life. This driver is not currently aligned with the PHA bioplastics manufacturing technology roadmap as it is considered out of scope at this time. |
The list of drivers shows that our company views PHA bioplastics as a promising industry with a lot of potential. Therefore, our company wants to develop the PHA bioplastics manufacturing process such that it yields bioplastics that are competitive with oil-based plastics on the basis of both material properties and cost. In order to do so, our technology roadmap introduces a technical model and some analysis using a governing equation for the cost of bioplastics manufacturing. The FOM target for the production cost of P(3HB), the PHA variant of interest since it is a direct competitor with PP (polypropylene), is at or below ~$1.5/kg in order to reach near-parity with the current market price of PP resin. This roadmap is aligned with this driver. This means that the analysis, technology targets, and R&D projects contained in our roadmap (and hopefully funded by the R&D budget) support the strategic ambition stated by driver 1.
However, the second driver, focused on managing end-of-life PHA bioplastics to ensure the carbon stays fixed, is out of scope and not currently aligned with this roadmap.
¶ Positioning of Company vs. Competition
Before we introduce the positioning of our company, we will first introduce the landscape of options to produce our reference PHA, P(3HB).
This first table is based on academic and simulation data - the production cost is calculated via simulation and economic evaluation for a 100,000 tonnes/year P(3HB) plant.
| Strain | PHA produced | Fermentation strategy | Substrate | PHA content (%) | Productivity (g- L-1-hr-1) | Yield ([g PHA]/[g carbon]) | Production cost ($/kg) |
|---|---|---|---|---|---|---|---|
| A. latus | P(3HB) | Fed-batch | Sucrose | 50 | 3.97 | 0.17 | 8.3 |
| A. latus | P(3HB) | Fed-batch | Sucrose | 88 | 4.94 | 0.42 | 2.6 |
| E. coli | P(3HB) | Fed-batch | Glucose + YE + CSL + casein hydrolysate | 72.3 | 1.98 | 0.29 | 5.37 |
| E. coli | P(3HB) | Fed-batch | Glucose | 77 | 3.2 | 0.27 | 4.91 |
| M. organophilum | P(3HB) | Fed-batch | Methanol | 52 | 1.86 | 0.19 | 6.69 |
Error creating thumbnail: File missing (as of Oct 2025)
Source:
- Choi, J., Lee, S. Factors affecting the economics of polyhydroxyalkanoate production by bacterial fermentation. Appl Microbiol Biotechnol 51, 13–21 (1999). https://doi.org/10.1007/s002530051357
In this table, we begin to see some of the factors and choices that influence the price. For example, how does the choice of feedstock affect the price? The strain of bacteria? The PHA content? etc. We see that one A. latus process near the top is much closer to our goal of ~$1.5/kg P(3HB) or less. Why is this?
Within this relatively small data set alone, we can observe certain patterns in the data. For example, the A. latus option that is $2.6/kg has a much higher PHA content, productivity, and yield compared to the first A. latus option that is $8.3/kg. Indeed, between these two A. latus options, the only difference was the application of a nitrogen limitation during fermentation that significantly boosted the content, productivity, and yield.
However, if we compare the $8.3/kg A. latus option with the $4.91/kg E. coli option, we see this E. coli option has significantly higher PHA content and productivity compared to the $8.3/kg A. latus option, but the increase in yield is smaller than the difference between the two A. latus options. The simulated price of this E. coli option ($4.91/kg) is indeed lower than the $8.3/kg reported for the A. latus option, but the price of this E. coli option is not as low as the $2.6/kg A. latus option. This seems to suggest that changes in the yield has a relatively bigger effect on the production cost than the other two parameters (content and productivity). This will be verified in the next section.
This second table follows a similar format, but this time, it reports data from large scale commercial PHA producers. Because this is commercial data, the production costs are not freely available. However, the other parameters (cell content, productivity, and yield) are reported.
| Strain | PHA produced | Fermentation strategy | Substrate | PHA content (%) | Productivity (g- L-1-hr-1) | Yield ([g PHA]/[g carbon]) | Production cost ($/kg) |
|---|---|---|---|---|---|---|---|
| R. eutropha ** | P(3HB) | no data | Glucose | 73.8 | 2.42 | 0.32-0.48 | - (commercial data) |
| P. cepacia | P(3HB) | no data | Xylose | 60 | no data | 0.11 | - (commercial data) |
| A. latus | P(3HB) | no data | Sucrose | 50 | 3.97 | 0.40 | - (commercial data) |
| A. vinelandii | P(3HB) | no data | Molasses | 60 | 1.4 | 0.12 | - (commercial data) |
| Various micro-organisms | P(3HB) | no data | Lignocellulose hydrolysates | 32-89 | 0.3-105 | 0.11-0.40 | - (commercial data) |
| E. coli harboring A. latus genes | P(3HB) | no data | Whey | 80.2 | 2.57 | 0.52 | - (commercial data) |
| R. eutropha ** | P(3HB) | no data | Plant oils | 62.5 | 0.96 | 0.72-0.76 | - (commercial data) |
| R. eutropha | P(3HB) | no data | Waste frying oil | 36.5 | 0.14 | 0.19-0.34 | - (commercial data) |
| P. cepacia | P(3HB) | no data | Glycerol | 31.4 | 0.6-1.5 | 0.062 | - (commercial data) |
| M. organophilum | P(3HB) | no data | Methanol | 52 | 1.8-2.0 | 0.19 | - (commercial data) |
| Methylotroph spp. | P(3HB) | no data | Methane | 51.0 | 0.031 | 0.55 | - (commercial data) |
Source:
- Jiang, G., Hill, D. J., Kowalczuk, M., Johnston, B., Adamus, G., Irorere, V., & Radecka, I. (2016). Carbon Sources for Polyhydroxyalkanoates and an Integrated Biorefinery. International journal of molecular sciences, 17(7), 1157. https://doi.org/10.3390/ijms17071157
Although the production cost data isn't present, our hope is that we can build a technical model that can compare all of the above on an equal basis (assuming a constant price for glucose rather than worrying about regional or local prices, etc.).
The ** signifies data from relatively large scale PHA producers, which is useful for us because we want to produce PHA at a large scale.
¶ Technical Model
Our roadmap's primary focus is the production cost of PHA bioplastics. However, there are many variables and choices to take, so we need a technical model and some simplifying assumptions to explore the design tradespace.
As such, we need first need a governing equation for the production cost of PHA bioplastics that relates the production cost to commonly reported variables:
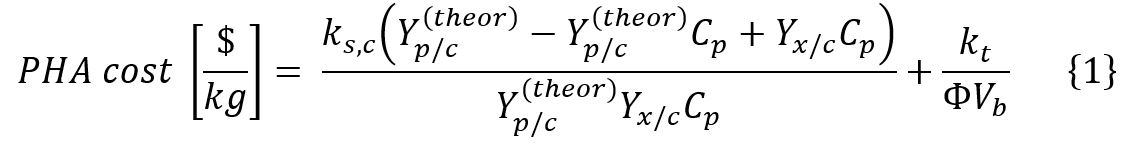
Where:
- ks,c, in units of $/kg carbon substrate is the cost of the carbon substrate. Since PHA is only composed of C, H, and O items, the carbon substrate is the most significant.
- Yp/c(theor), in units of kg PHA/kg carbon substrate, is the theoretical yield of PHA on the carbon substrate. The theoretical yield typically references the biochemical theoretical yield, which is typically lower than the purely chemical theoretical yield because it accounts for the biological reactions occurring in the production pathway.
- Cp is the PHA content (% of dry cell weight).
- Yx/c in units of kg x/kg carbon substrate, is the yield of organism x (x can be whatever organism) on the carbon substrate. The organism is a living creature so it will consume some of the carbon substrate for its own sustenance and growth.
- kt in units of $/hr represents the running costs, which typically include utilities such as steam, air, fuel, etc.
- Φ, in units of kg PHA-L-1-hr-1 is the volumetric productivity of PHA. Note that it is on a time basis.
- Vb, in units of L, is the volume of the fermenter.
This equation was adapted from Yamane T. Cultivation engineering of microbial bioplastics production, FEMS Microbiology Reviews, Volume 9, Issue 2-4, December 1992, Pages 257–264, https://doi.org/10.1111/j.1574-6968.1992.tb05846.x
Comparing the list of variables here to the table given in the "Positioning of Company vs Competition", we see that many of the variables in this equation are explicitly stated, such as volumetric productivity and PHA content. The other variables can be determined given the information provided - for example, given the name of the substrate, one can find an expected cost, and given the substrate, organism, and product, one can determine the biological pathway that will determine the theoretical yield (kg PHA/kg carbon substrate).
This process will allow us to determine which parameters to focus on to yield a total production cost of PHA bioplastics of <=$1.5/kg.
First, just by exploring the equation above, we can determine normalized sensitivities to four of the most prominent variables. The design vector used to generate this chart was as follows:
- Strain Alcaligenes latus or “x”
- PHA formed P(3HB)
- Substrate sucrose, with a cost of $0.290/kg
- PHA content of resulting cells is 50%, or 0.50
- Productivity 3.97 g L-1 hr-1 = 0.00397 kg L-1 hr-1
- Assume theoretical yield 0.5 kg P(3HB)/kg sucrose, assume Y_(x/c) is 0.5 kg x/kg sucrose
- Assume running costs and fermenter volume are fixed at $0.49/hr and 100 L respectively. For the purposes of comparison, we will assume the running costs and fermenter volumes are constant across the different possibilities.
- At 100,000 tonnes/year production capacity, Choi 1999 simulated a production cost of $8.3/kg P(3HB) for this particular design vector.
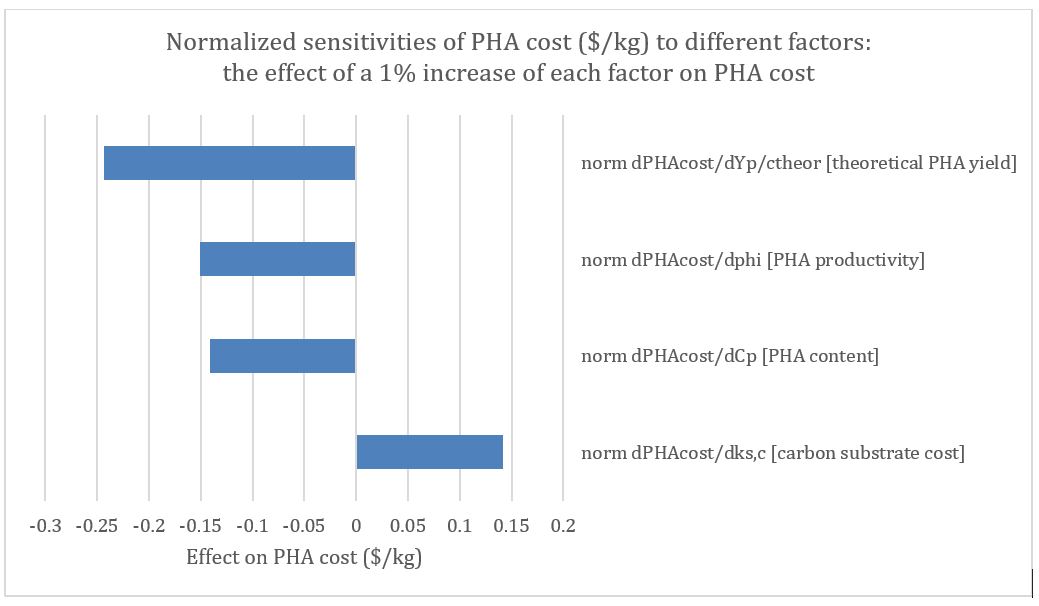
Here are two examples of how to read the above:
- For a 1% positive change in the substrate cost, the cost of production increases by $0.14/kg (P3HB), or 1.7% of $8.3/kg.
- For a 1% positive change in the theoretical PHA yield on carbon substrate, the cost of production reduces by $0.24/kg (P3HB), or 2.9% of $8.3/kg.
These normalized sensitivities help us determine what to focus on as we map out a roadmap to achieving cost-competitive PHA bioplastics. In fact, we can already see that in order of the highest impact, the factors are:
- (Biggest impact) Theoretical PHA yield (on carbon substrate) - 1% change yields a 2.9% change in PHA production cost
- PHA productivity - 1% change yields a 1.8% change in PHA production cost
- (Tied for lowest impact) PHA (cell) content - 1% change yields a 1.7% change in PHA production cost
- (Tied for lowest impact) Carbon substrate cost - 1% change yields a 1.7% change in PHA production cost
(note that the percentage changes won't have a constant gradient, but these percentage changes give you an idea which are the bigger factors compared to the others)
This technical model shows us that the most important factor to focus on (to reduce PHA production cost) is theoretical PHA yield on carbon substrate.
However, it also shows that there isn't much of a difference in the impact of the different factors - the most important factor has a 3% "effect", but the least important factors still have a 1.7% "effect" on the PHA production cost.
This tells us we shouldn't single-mindedly focus on maximizing yield at the expense of the other variables, but we should start with a substrate with a reasonably high yield that's pretty cheap.
Here, we revisit our table from the previous section, which has 2 modifications made to it:
- It's sorted by yield in ascending order
- There is a new column next to the Yield column titled "Cost of carbon substrate $/kg" (these values, which are quoted from the international market as of 11/30/2020, are subject to change)
| Strain | PHA produced | Fermentation strategy | Substrate | PHA content (%) | Productivity (g- L-1-hr-1) | Yield ([g PHA]/[g carbon]) | Cost of carbon substrate ($/kg) | Production cost ($/kg) |
|---|---|---|---|---|---|---|---|---|
| P. cepacia | P(3HB) | no data | Glycerol | 31.4 | 0.6-1.5 | 0.062 | 0.04-0.11 | - (commercial data) |
| P. cepacia | P(3HB) | no data | Xylose | 60 | no data | 0.11 | 2.7-3.5 | - (commercial data) |
| Various micro-organisms | P(3HB) | no data | Lignocellulose hydrolysates | 32-89 | 0.3-105 | 0.11-0.40 | - | - (commercial data) |
| A. vinelandii | P(3HB) | no data | Molasses | 60 | 1.4 | 0.12 | 1 | - (commercial data) |
| M. organophilum | P(3HB) | no data | Methanol | 52 | 1.8-2.0 | 0.19 | 0.33-0.4 | - (commercial data) |
| R. eutropha | P(3HB) | no data | Waste frying oil | 36.5 | 0.14 | 0.19-0.34 | - | - (commercial data) |
| R. eutropha ** | P(3HB) | no data | Glucose | 73.8 | 2.42 | 0.32-0.48 | 0.39 | - (commercial data) |
| A. latus | P(3HB) | no data | Sucrose | 50 | 3.97 | 0.40 | 0.33 | - (commercial data) |
| E. coli harboring A. latus genes | P(3HB) | no data | Whey | 80.2 | 2.57 | 0.52 | 0.4 | - (commercial data) |
| Methylotroph spp. | P(3HB) | no data | Methane | 51.0 | 0.031 | 0.55 | 0.1 (US only) | - (commercial data) |
| R. eutropha ** | P(3HB) | no data | Plant oils | 62.5 | 0.96 | 0.72-0.76 | 0.85 (soybean oil) | - (commercial data) |
Source:
- Various current market prices as of 11-30-2020 (websearch)
Here, we notice the two options with the best yield are R. eutropha from plant oils (0.72-0.76 g PHA/g Csubstrate) and Methylotroph spp. (0.55 g PHA/g Csubstrate) from methane respectively. However, the Methylotroph spp. option shows very low productivity [0.031 g PHA/(L-h)], while the R. eutropha from plant oils has decent (not extraordinary) values for content and productivity. This will be revisited later on.
¶ Morphological matrix of process design choices
Proceeding further, we can build a sample morphological matrix. Please note that the options in this morphological matrix are NOT exhaustive of all of the possibilities. The options are there only to give the reader an idea of what goes in each category.
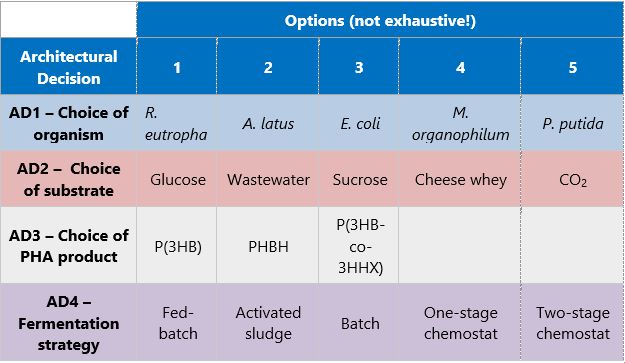
In a general sense, most combinations are valid as long as the organism has a metabolic pathway for handling the substrate selected. Therefore, the only technical constraint to making choices in the matrix is the compatibility of the organism with the substrate - is the organism able to process the substrate into PHAs, or not?
As an example, here are the choices made for Danimer Scientific's Nodax, a family of PHAs that has been in use for several years.
Example application of the morphological matrix to Danimer Scientific's Nodax
Before we present the architectural decisions proposed for our company, we have to decide what order to make these decisions. To do this:
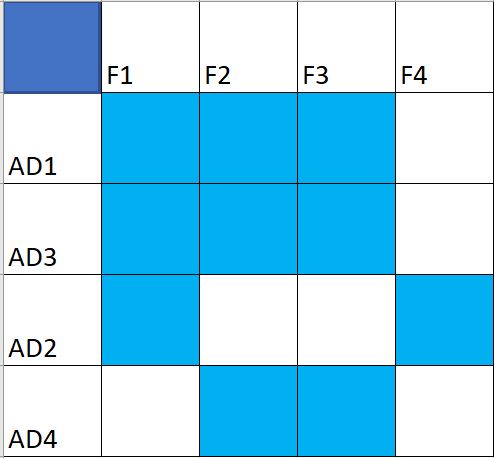
We will give each of our main 4 factors in the technical model an ID here:
- F1 = theoretical yield of PHA on the carbon substrate
- F2 = PHA productivity
- F3 = PHA cell content
- F4 = cost of the carbon substrate
The mapping above can be read as follows:
AD1, the choice of organism, impacts:
- F3, PHA cell content
- F2, PHA productivity
- F1, theoretical yield of PHA on the carbon substrate
AD2, the choice of substrate, impacts:
- F4, cost of the carbon substrate
- F1, theoretical yield of PHA on the carbon substrate
AD3, the choice of PHA product, impacts:
- F3, PHA cell content
- F2, PHA productivity
- F1, theoretical yield of PHA on the carbon substrate
- {unmapped - biodegradability of the PHA and all of the mechanical properties (elasticity, Young’s modulus, etc.)}
AD4, fermentation strategy, impacts:
- F3, PHA cell content
- F2, PHA productivity
¶ Our Company's Strategy
Now, for our selections: If we assume F1 is the most important factor, then this mapping shows that we should decide AD1 and AD3 first. For simplicity, AD3 is already assumed to be P(3HB), for the same reasons covered until now. With AD3 out of the picture, our decision sequence for a cost-competitive PHA production process is: AD1 > AD2 > AD4.
To decide AD1 (choice of organism), we want an organism that is able to more efficiently produce PHAs than other organisms for a given substrate. This means that the biochemical pathway used by the organism is as straightforward as possible with minimal detours leading to loss of valuable and costly substrate.
Through our research, we've determined that Rhodospirillum rubrum (R. rubrum) is a promising choice. This can be illustrated as follows:
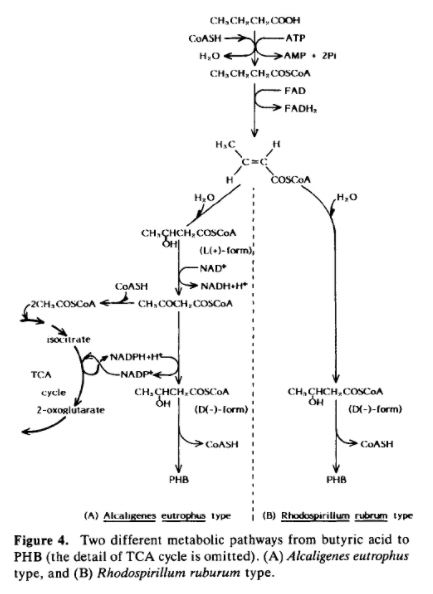
Notice that the pathway used by R. rubrum, on the right, to convert butyric acid into PHB is a lot more straightforward than the pathway used by A. eutrophus, also known as R. eutropha, the same R. eutropha reportedly used by Danimer Scientific's Nodax in the example above.
This simplification of the pathway has a large effect on F1, the factor that we've shown has the largest effect on the cost of producing PHA.
| Carbon substrate | Assimilation pathway | NADPH regeneration | Theoretical yield of PHA on the carbon substrate |
|---|---|---|---|
| Butyric acid | A. eutrophus type | Isocitrate | 0.65 |
| Butyric acid | R. rubrum type | Not needed | 0.98 |
Source: Yamane T. Yield of poly-D(-)-3-hydroxybutyrate from various carbon sources: a theoretical study. Biotechnol Bioeng. 1993 Jan 5;41(1):165-70. doi: 10.1002/bit.260410122.
Because R. rubrum uses a simpler pathway, NADPH regeneration isn't needed which removes a potential "loss" of valuable carbon substrate, and the organism is instead able to produce more PHAs per kg of carbon substrate than A. eutrophus. We previously ballparked ~3% reduction in PHA production cost per 1% change in yield - here we have a ~50% increase in yield!. So, if the gradients were constant, the PHA production cost would reduce by -150%...although this is clearly impossible and the cost reduction will be lower than -150% due to diminishing returns, it gives the reader an idea of how much of a change is possible due to this change in yield.
To decide AD2 (choice of substrate), we'll first try what's already proven to work for R. eutropha (same as A. eutrophus) - plant oil (see table above). Although soybean oil is relatively expensive, we already know that R. eutropha is already able to deliver high yields from soybean oil, and according to L. Favaro et al (2018), PHA production from soybean oil is likely cost competitive.
Furthermore, there is probably enough supply of soybean oil for our company at the early stages: according to the USDA (https://www.ers.usda.gov/topics/crops/soybeans-oil-crops/), the United States is the world's leading soybean producer and the second-leading exporter. Soybeans comprise about 90 percent of U.S. oilseed production, while other oilseeds—including peanuts, sunflowerseed, canola, and flax—make up the remainder.
Lastly, we'll make AD4 (fermentation strategy) easy for now and just stick with fed-batch.
Therefore, our company's initial AD choices look like this:

¶ Key Publications, Presentations and Patents
Key publications:
Our first stop was [Choi, J., Lee, S. Factors affecting the economics of polyhydroxyalkanoate production by bacterial fermentation. Appl Microbiol Biotechnol 51, 13–21 (1999). https://doi.org/10.1007/s002530051357]. This paper covers a lot of ground directly relevant to our work:
- Introduction to the factors that affect PHA production's overall economics: PHA productivity, PHA content, the yield of PHA on a carbon source, the price of raw materials, and the recovery method employed.
- Tables correlating different design choices (such as bacterial strain, PHA type produced, fermentation strategy, and substrate) with the factors listed above and the overall cost of production ($/kg).
- A textual and graphical description(using 3D charts) of the sensitivity analysis of the factors listed above to the ultimate PHA type production cost.

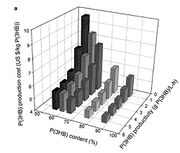
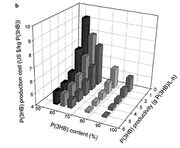
Source: Choi, J., Lee, S. Factors affecting the economics of polyhydroxyalkanoate production by bacterial fermentation. Appl Microbiol Biotechnol 51, 13–21 (1999). https://doi.org/10.1007/s002530051357
This paper is an excellent introduction to our subject. However, although there is a lot of quantitative data, much of the discussion revolves around qualitative descriptions (such as "the carbon source cost contributes significantly to the overall production cost of PHA" without a numerical value to the significance.
Most importantly, this paper points out that the largest determinants of PHA production costs are mainly associated with the fermentation step, with only one factor related to downstream processing costs (recovery method employed). This tells us to focus on upstream processing (fermentation) costs.
Our search for a quantitative model to evaluate sensitivities led us to [Yamane T.Cultivation engineering of microbial bioplastics production, FEMS Microbiology Reviews, Volume 9, Issue 2-4, December 1992, Pages 257–264, https://doi.org/10.1111/j.1574-6968.1992.tb05846.x]. This paper covers:
- A formula for the cost of PHA production as a function of the most common reported values mentioned in the paper above. This formula was a critical find and is covered in depth in the technical model section of our roadmap.
- Quantitative definitions and key simplifying assumptions for each of the terms in the formula.
This paper introduces a formula for the overall yield of PHB compared to the theoretical yield of PHB that wasn't fully derived. Therefore, we consulted the author's previous work, [Yamane T. Yield of poly-D(-)-3-hydroxybutyrate from various carbon sources: a theoretical study. Biotechnol Bioeng. 1993 Jan 5;41(1):165-70. doi: 10.1002/bit.260410122.], which provided a detailed definition of the formula introduced in the previous paper.
What's the focus of current research?
Oddly enough, although we have shown that improvements in yield (or a more efficient biochemical pathway) have a larger effect on the production cost of PHAs than the cost of the carbon substrate (in another window, see https://roadmaps.mit.edu/en/roadmaps/PHA_(polyhydroxyalkanoate)_bioplastics_manufacturing#Technical_Model), there appears to be a disproportionate focus on producing PHAs from inexpensive substrates rather than improving yield.
Error creating thumbnail: File missing (as of Oct 2025)
Although this is admittedly a crude approach to seeing if the PHA community is more interested in substrates or yield by way of the number of mentions of each word in papers, we used this diagram to spark a conversation with people who have experience in this industry. The general response we've received is that there does seem to be a significant focus in the research community on simply whether PHAs can or can't be produced from unusual and inexpensive substrates (see a "PHA from wastewater" patent below) while not paying much attention to whether it is economically feasible to do so. In our opinion, we believe that an equal amount of attention should be focused on making PHA production economically feasible, and yield may be the best handle to do so.
Key patents:
- Liu et al. (2020). US Patent No. 10,807,893 B2. Sacramento, CA: US Patent and Trademark Office. This patent was issued on October 20, 2020). It details a method for producing PHAs during wastewater treatment. The most important takeaway from this process is the claim that PHA can be produced using an activated sludge process with a higher PHA content (>10% cell weight basis) than conventional technologies (2.5% cell weight basis). As we learned from the previous papers, PHA content is an important factor for economical PHA production. However, it is difficult to achieve high PHA content with a cheap carbon source. Typically, one must use expensive carbon sources to achieve high PHA content, which negatively impacts PHA production costs. This patent is interesting because it claims a breakthrough in using a cheap source of feed (wastewater, a liability) to achieve a higher PHA content than before, suggesting that there may not be such a tradeoff between carbon source cost and PHA content.
- Tsai et al. (2020). US Patent No. 10,745,723 B2. Nantou County (TW): US Patent and Trademark Office. This patent was issued on August 18, 2020. It is similar in scope and tone to the Liu et al. patent above, which may indicate where the attention in this field is currently (PHAs from activated sludge, boosting PHA content). It details a method of increasing the PHA content of waste sludge using a specific sequence of processing steps. Just like the previous patent, the aim is to reduce the cost of PHA production. This patent again illustrates the importance of PHA content. However, unlike the Liu et al. patent above, this one does not make any claims for how much this different process can raise the waste sludge's PHA content versus a control.
- Nomura et al. (2020). US Patent No. 10,745,722 B2. Syracuse, NY: US Patent and Trademark Office. This patent was also issued on August 18, 2020, with the support of the NSF. It details a specifically engineered strain of Escherichia Coli that can be controlled to produce different poly-R-3-hydroxyalkanoate polymers. Control is important because it allows the manufacturer to "dial-in" the material properties desired from the PHA produced. Here we see how important the organisms used to produce PHA are and how they can be customized. These organisms catalyze PHA production and are much more complex compared to analogous inorganic catalysts. Poly-3-hydroxybutyrate (P3HB) is in the family of PHAs and is perhaps the most exciting of the different PHA variants because it can be a direct competitor to polypropylene, one of the major oil-derived plastics in use today. (A head-to-head comparison is detailed on our roadmap). This invention proposes an engineered E. coli that can deliver a higher yield of P3HB range biopolymers with the right composition. As detailed in the key papers, the yield is an important factor of PHA (or P3HB) production cost, and this is important for our roadmap.
Excerpt from US 10,745,722 B2, the patent about an engineered strain of E. coli that can be controlled to produce different PHA polymers. This is a good depiction of some of the biochemical pathways used to form PHAs. By varying the conditions at each of the steps, the balance between the three products at the bottom can be altered.
¶ List of R&T Projects
There are clearly many challenges ahead to producing PHAs at a commercial scale in an economically feasible manner, so there's a lot to do to stay ahead of the curve. However, as a startup company, we do not have a large team/large amount of resources to tackle multiple large opportunities at once.
We propose broad groupings to the R&T opportunities as follows:
- Making PHAs cheaper to produce (reducing the cost $/kg) - This is fairly straightforward, given the previous content. If the current cost to produce PHAs is ~$3-6/kg, we need to target a ~50-75% reduction in production costs to reach our target of $1.5/kg to produce PHAs.
- Building a market for PHAs - We know that the capital cost for PHA plants is high. Although the American and global plastics market is large, plastics are still a commodity, so the margin between the price they are sold at and the cost of manufacturing them isn't very large. Therefore, when we're initially producing a small scale, the fastest way to recoup our large capital costs for our new plant is to target markets that actually have high margin. If we can find high margin markets for PHA, we'll be able to afford large commercial scale plants in the future!
A few R&T projects worth considering are shown in the Wheelwright and Clark model below. There is a limited amount because this is a small startup company operating in a fledgling market space. They are explained in the table below the graphic.
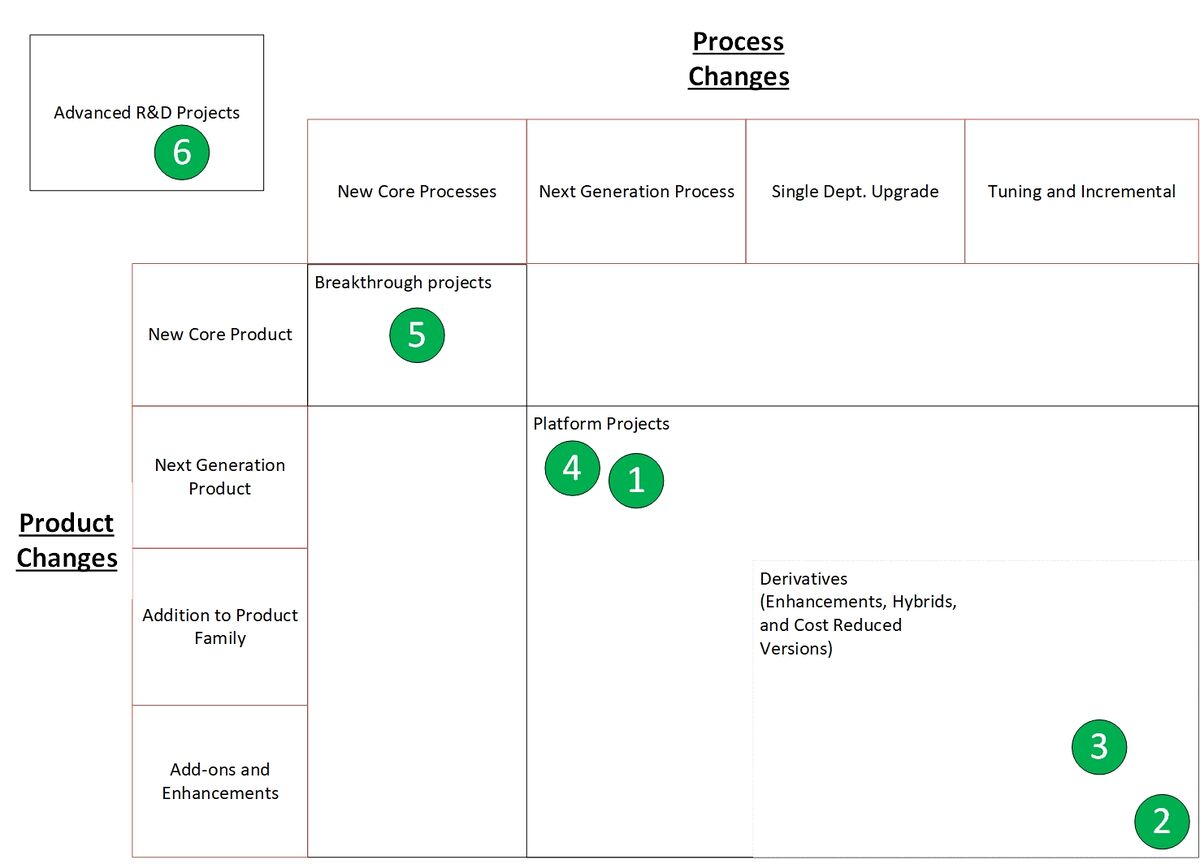
These projects are numbered and ordered in suggested order of priority. When setting the priority, our primary goals were to:
- Capture low hanging fruit quickly, to demonstrate success and build confidence with stakeholders
- Develop risky tech (like the use of extremophiles) in the background (rather than at the forefront) while gradually derisking it, rather than attempt to derisk and commercialize rapidly
This way, each R&D project "forms a bridge to" the next, larger R&D project. We start with known methods and organisms and proceed onwards riskier methods and organisms.
The rationale for each project is explained in the table below as well. To be conservative, we assumed the PHA cost reductions delivered will tend towards the lower end of the ranges supplied below, and the durations of the projects all tend towards the upper ranges.
| Project number reference | R&T project description | Relevant Strategic Driver | Expected impact on FOM | Ballpark cost | Likelihood of success | Timeline | Priority rationale | Source |
|---|---|---|---|---|---|---|---|---|
| 1 (most pressing short-term need) | Altering PHA properties to target high margin applications (such as cosmetics) | Expanding the market/demand for PHAs | - | $200K (6 mos) | 100% | 3 to 6 mos | This is an immediate priority so that our company can target high margin but relatively small volume applications, like PHAs for cosmetics (see http://www.bio-on.it/what.php?lin=inglese), to recoup capital costs for the first plant. | Bonartsev, A. P., Bonartseva, G. A., Reshetov, I. V., Kirpichnikov, M. P., & Shaitan, K. V. (2019). Application of Polyhydroxyalkanoates in Medicine and the Biological Activity of Natural Poly(3-Hydroxybutyrate). Acta naturae, 11(2), 4–16. https://doi.org/10.32607/20758251-2019-11-2-4-16. |
| 2 | Integration of the aqueous two-phase extraction, a downstream process, into the overall process design | Reducing the cost per kg to produce PHA | 5-10% PHA production cost reduction | $200K (6 mos) | 70% (for 5% production cost reduction) | 3 to 6 mos | This is 2nd because it's a relatively easy win. This tech targets the downstream processing section of PHA production which is less connected and influential, but still an area that shouldn't be ignored. In the study referenced, the simulated cost of PHA production was reduced from $6.12/kg to $5.77/kg with this tech. | Yoong Kit, Leong & Show, Pau-Loke & Lan, John & Loh, Sandy Hwei-San & Lam, Hon & Ling, Tau. (2017). Economic and environmental analysis of PHAs production process. Clean Technologies and Environmental Policy. 19. 10.1007/s10098-017-1377-2. |
| 3 | Advanced modelling and simulation of the bioreactor. Includes building a model, installing sensors and collecting data. Results could be changing the bioreactor's operating parameters including strategic nutrient limitations to maximize PHA production. | Reducing the cost per kg to produce PHA | 15%-70% PHA production cost reduction | $1,200K (2 yrs) | 50% (for 20% production cost reduction) | 6 mos to 2 yrs | This might sound like it's too good to be true, but it really could be. The high end of the estimate, 70%, was seen with A. latus just by applying a nitrogen limitation. With R. rubrum, an increase in PHB cell content of 20% was observed when carbon and phosphorus limited versus carbon or carbon and nitrogen limited. Modelling and simulation is still a new field and is not in wide use yet. | Karmann, S., Panke, S., & Zinn, M. (2019). Fed-Batch Cultivations of Rhodospirillum rubrum Under Multiple Nutrient-Limited Growth Conditions on Syngas as a Novel Option to Produce Poly(3-Hydroxybutyrate) (PHB). Frontiers in bioengineering and biotechnology, 7, 59. https://doi.org/10.3389/fbioe.2019.00059 and Choi, J., Lee, S. Factors affecting the economics of polyhydroxyalkanoate production by bacterial fermentation. Appl Microbiol Biotechnol 51, 13–21 (1999). https://doi.org/10.1007/s002530051357 |
| 4 | Optimizing the process at a commercial scale. Includes designing equipment like the fermenter and the air blowers for minimum operating costs (stirrers in the fermenter, backpressure on the air blowers) | Reducing the cost per kg to produce PHA & enables commercial scale production | 15%-70% PHA production cost reduction (linked to #3) | $2,400K (3 yrs) | 80% (for 20% production cost reduction) | 1 to 3 yrs | This is really an extension of #3, but it specifically refers to optimizing for commercial scale production. This will enable our company to make the transition from small-scale to large-scale. Most tests are done today at a lab scale with expensive precursors and demand high amounts of oxygen. By using the processes and information gained from developing models, scale-up is derisked. | Favaro, L., Basaglia, M. and Casella, S. (2019), Improving polyhydroxyalkanoate production from inexpensive carbon sources by genetic approaches: a review. Biofuels, Bioprod. Bioref., 13: 208-227. https://doi.org/10.1002/bbb.1944 |
| 5 | Re-engineering pathways so R. rubrum can profitably make PHAs from syngas | Reducing the cost per kg to produce PHA | 50%-70% PHA production cost reduction (consider the price of plant oils vs the price of methane), and consider hydrogen produced as a byproduct at ~$2/kg to offset the cost of PHA production | $3,200K (4 yrs) | 20% (for 50% production cost reduction) | 3 to 5 yrs | As our company starts producing at a larger and larger scale, feedstock costs will not only become much higher due to the sheer volume and requirements on the supply chain but there could also be political and social backlash due to using a food source for something other than food. Therefore, it is important that we have a longer vision to transition away from using food (even plant oils) as a feedstock to a non-food and more sustainable feedstock. We selected R. rubrum because it carried an apparent advantage in a more efficient pathway to produce PHA than R. eutropha. R. rubrum is also very flexible at being able to handle a number of different substrates to make PHA, but it's not as efficient with those other substrates. By re-engineering the pathway to shortcut the potential loss points and provide a more direct path to producing PHA, we can take advantage of cheaper and more available feedstock. The technoeconomic assessment by Choi suggests that PHA production costs are only $1.65/kg, after factoring in the value of the hydrogen produced. | Guo-Qiang Chen, Xiao-Ran Jiang, Engineering microorganisms for improving polyhydroxyalkanoate biosynthesis, Current Opinion in Biotechnology, Volume 53,2018, Pages 20-25, ISSN 0958-1669, https://doi.org/10.1016/j.copbio.2017.10.008. and Ian Levett, Greg Birkett, Nick Davies, Aidan Bell, Alexandra Langford, Bronwyn Laycock, Paul Lant, Steven Pratt, Techno-economic assessment of poly-3-hydroxybutyrate (PHB) production from methane—The case for thermophilic bioprocessing, Journal of Environmental Chemical Engineering, Volume 4, Issue 4, Part A, 2016, Pages 3724-3733, ISSN 2213-3437, https://doi.org/10.1016/j.jece.2016.07.033. and Choi, D., Chipman, D.C., Bents, S.C. et al. A Techno-economic Analysis of Polyhydroxyalkanoate and Hydrogen Production from Syngas Fermentation of Gasified Biomass. Appl Biochem Biotechnol 160, 1032–1046 (2010). https://doi.org/10.1007/s12010-009-8560-9 |
| 6 | Engineering extremophiles (like Halomonas) to efficiently produce PHAs from methane, CO2 or syngas | Reducing the cost per kg to produce PHA | 20%-40% (??) PHA production cost reduction (certain steps in the PHA production process can be removed or consolidated - lysing, sterilization, etc.) | $4,000K (5 yrs) | 20% (for $20% production cost reduction) | 5+ yrs | The last stop of our company's journey, where it reaches maturity, is where we can use extremophiles to produce PHA instead of regular bacteria. By using extremophiles which are more used to extreme environments, the PHA production process conditions can be significantly altered as there is less fear of going beyond the organism's threshold as there is for regular bacteria. At this stage, the PHA production process will be consolidated and simplified as much as possible - we'll be using the cheapest feedstock possible (methane/CO2/etc.), with the simplest process possible (extremophiles). | Favaro, L., Basaglia, M. and Casella, S. (2019), Improving polyhydroxyalkanoate production from inexpensive carbon sources by genetic approaches: a review. Biofuels, Bioprod. Bioref., 13: 208-227. https://doi.org/10.1002/bbb.1944 and Mitra, R., Xu, T., Xiang, H. et al. Current developments on polyhydroxyalkanoates synthesis by using halophiles as a promising cell factory. Microb Cell Fact 19, 86 (2020). https://doi.org/10.1186/s12934-020-01342-z |
Before R&D, our company started with the following concept:
.jpg)
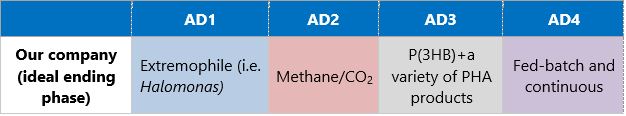
If the R&D is successful, we envision ending with this concept:
¶ Financial Model
The center idea of the business model is to reduce the cost to manufacture PHA so it can compete directly with the PP market (we established in earlier sections that PHA shares similar physical properties with PP). As a quick reminder, the current market price for PP is $1.3-$1.9/kg, so to start being able to compete at scale, we need to be able to sell PHA near this price. When taking into consideration the R&T projects listed above and discounting them by risk factor, we expect to reduce the price of PHA over 20 years so it is within a 30% margin to the projected cost of PP.
IdTechEx/McKinsey study on how much more consumers might pay for green products
This image depicts the relationship between the share of consumers willing to purchase a green product and the premium charged for that green product over an equivalent non-green product. We're using this general relationship (packaging is the closest analogy) to depict how we can access more consumers and a bigger share of the plastics market if we can sell PHAs (profitably) at a lower price.
Based on this data, we can assume that if PHA was $2.5/kg, 1.3x the price of PP (1.3x$1.9/kg upper bound for PP price = $2.5/kg), demand for PHA could be 5% of the total demand for PP. The chart below represents the expected total market demand in North America based on the expected price evolution of PHA over the next 20 years. The cost to produce each kg of PHA is expected to drop as a result of the company's planned R&T activities.
How market demand in NA is expected to change with PHA prices over the next 20 years
The figure below describes a financial model for a project to manufacture PHA at a commercial scale.
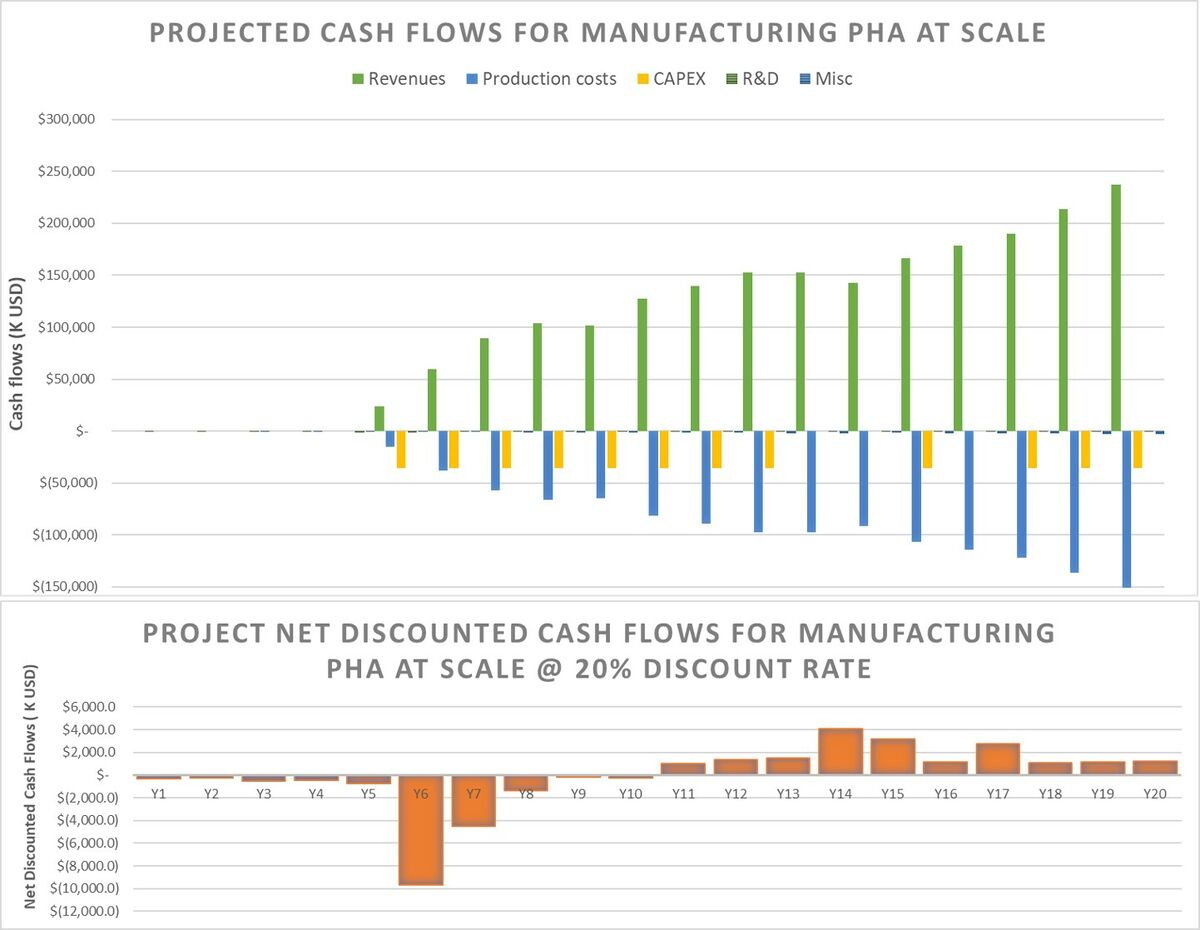
There are a few key elements depicted here:
- R&D costs - This entails the costs of the R&T projects to deliver reductions in the cost to manufacture PHA. The main source of costs is human capital, followed by lab equipment. Based on conversations with existing startups in this space, we know that the cost of engineering an organism that will produce the variant of PHA desired and engineering the process around that organism requires 1-2 full-time staff about 6-12 months.
- Revenue - This is the projected revenue from selling PHA on the market. The revenue is a function of not only the price per kg of PHA but also the amount (kg) of PHA produced. As shown in the IdTechEx/McKinsey graphic above, the higher the premium charged to consumers for a green product like PHA bioplastics, which can be used for packaging and are biodegradable, the lower the share of consumers willing to pay for it. The larger the market base we wish to access, the closer the price per kg of PHA needs to be with its oil-based substitutes. In order to break even on NPV, we must get at least an average 36% gross margin on each kg of PHA sold. This is higher than the average for the plastics industry (27%), but within the realm of feasibility. [source: https://www.abrigo.com/blog/plastics-product-manufacturing-naics-326150-industry-trends/]
- Production costs - This is the projected cost to manufacture PHA. Just like revenue, it's a function of not only the price per kg of PHA but also the amount (kg) of PHA produced. We model the price to produce each kg of PHA as reducing over time as a result of the completion of the R&T activities listed above.
- CAPEX - This is the cost of the manufacturing facilities. We build new production capacity only when the previous year's demand has exceeded the current production capacity, the facility is assumed to be built in waves over several years. According to industry benchmarks, PHA production CAPEX is approximately $3,200/ton of PHA. Therefore, a 50 kiloton/year facility would cost $160 million. In our case, we're building 12 kiloton/year production "modules" which cost $36 million each. We didn't assume any economies of scale at this time due to lack of data, so this is the most conservative approach possible. With this order of magnitude of CAPEX, it becomes vitally important to maximize the margin between the price each kg of PHA is sold for and the cost to manufacture each kg of PHA.
- Misc - This was just modeled as overhead, a fixed percentage (2%) of production costs.
If we're able to operate at 36% average margin for each kg of PHA over 20 years, and there are no tailwinds to help us like economies of scale or subsidies/regulatory incentives, we've estimated a break-even NPV of approximately $0.1 million over 20 years, but there are several areas of interest.
Major points of interest
- We assumed that PHA would replace polypropylene (referenced earlier in the roadmap) over time. PP is a massive market - over 17 million tons are produced in the US and Canada each year. At Year 20, our company aims to be producing 140 kilotons/year, or 15% of the total market demand for PHA (5% of 17 million tons/year PP). As PHA price gradually reduces due to our R&D projects, we can affordably charge less for each kg of PHA, which allows us to capture more and more of the market as we approach PP's price (currently $1.3-$1.9/kg)

- The only way to meet and beat PP spot price is to already start off with a highly cost-competitive PHA manufacturing process with a high margin (36+%) - We must have buyers for PHA at $3+/kg when the first factory is built! The goal is to take advantage of the high prices that a small share of consumers are willing to pay for green products to sell to those consumers at a high margin (profit) to us so we can recoup the large CAPEX expenditures required to expand our production capacity.
- We've assumed a discount rate of 20%, to reflect the risky nature of this business (disrupting oil-based plastics).
¶ Technology Strategy Statement
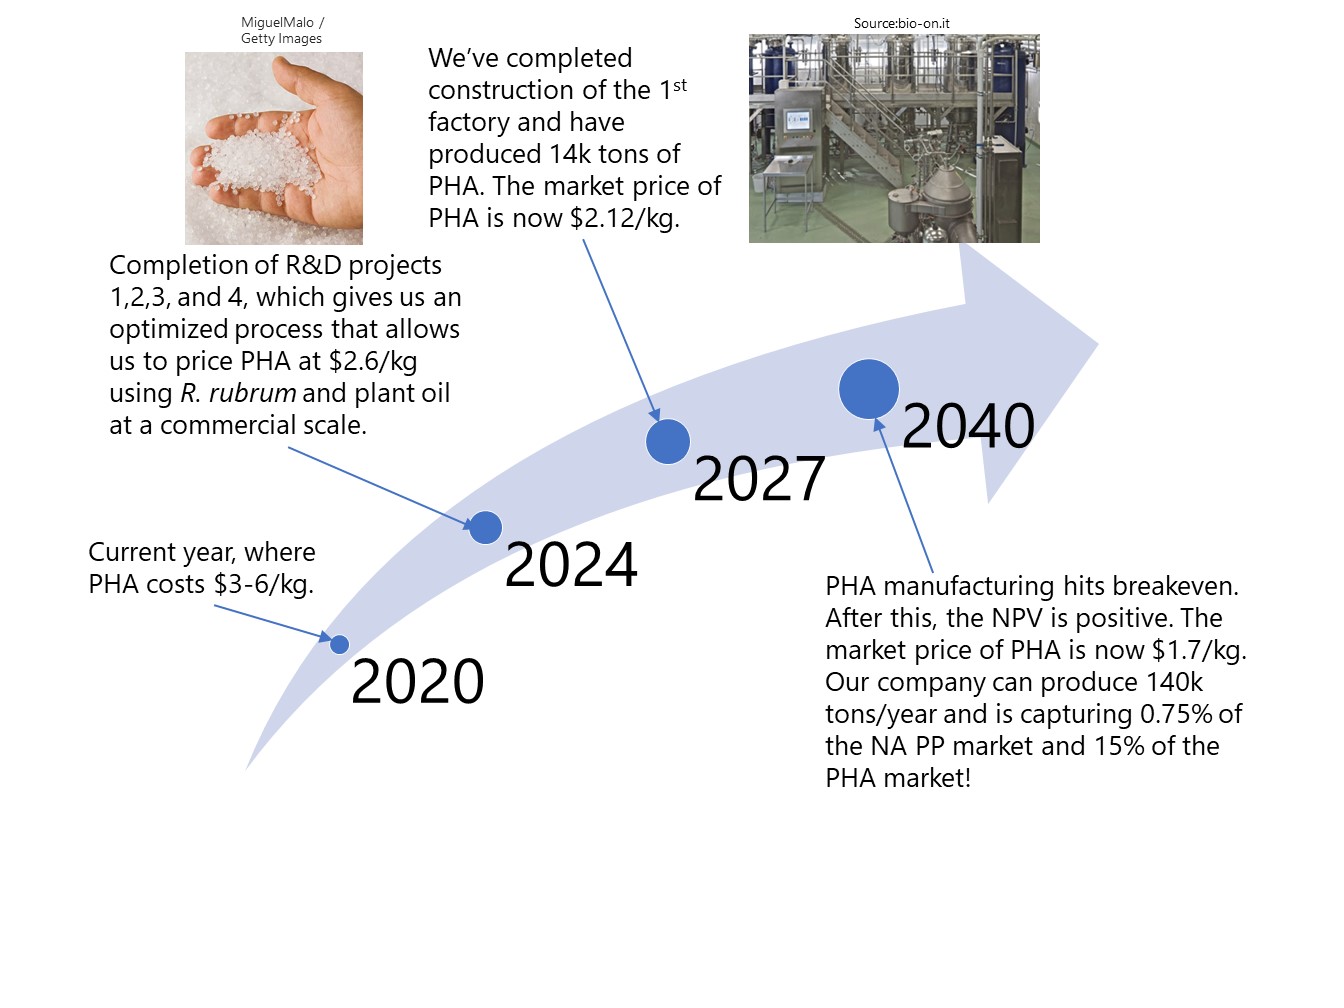
Our target is to develop a cost-competitive process to manufacture PHAs that will allow us to replace oil-based plastics on a commercial scale by 2040.
Our short term goal is to achieve a target price of $2.5/kg of PHA, compared to the current $3-6/kg of PHA today. This is about 30% above the current price of PP ($1.3-$1.9/kg, the best target for PHA to substitute). At this price premium above PP we aim to claim 5% of the PP market by approximately 2025.
In order to achieve our goal of reducing the prince of PHA, we will immediately invest in R&D to reduce the production cost per kilogram of PHAs by studying strains of organisms that can make PHAs economically from inexpensive substrates and by studying and implementing the most efficient fermentation and downstream processes into the process design. Once this R&D has lowered the cost of PHA to ~$2.5/kg by 2025, we will build our first production plant capable of producing 12 ktons/year of PHA.
As our R&D continues, we expect the price of PHA to continue to drop and the demand to increase. As the demand increases, we will continue to build more production capacity as long as there is enough demand to make use of the additional production capacity.
Our long term goal is to disrupt oil-based plastics. By 2040, we aim to achieve a target price of $1.7/kg, comparable with the current price of PP ($1.3-1.9/kg) today. By 2040, we aim to hit breakeven while our company is producing 140 ktons/year of PHA, 15% of the expected PHA market at that time and 0.75% of the North American polypropylene market!
Category: