Building Automation Systems for Energy Management, by Kulkarni, Ozturk, Toeldte
Project Overview
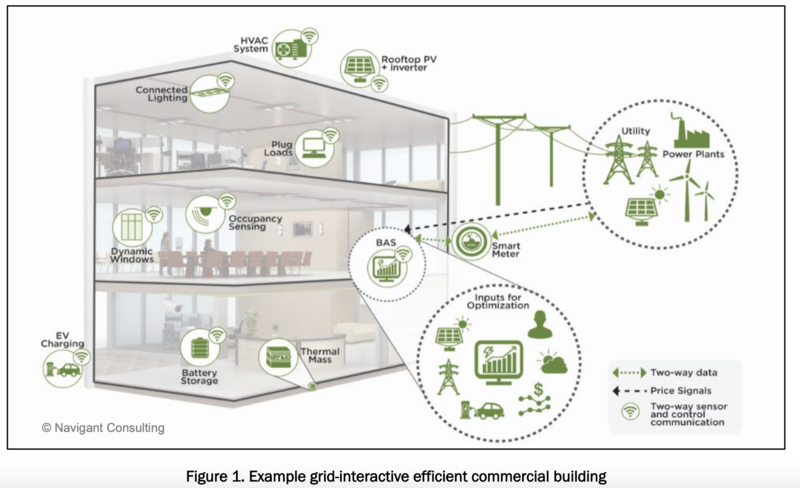
Image source: [6]
Eyrie is a company specializing in building automation systems (BASs). BAS technologies modulate the energy use of building infrastructure to reduce energy consumption while maintaining the desired environment for the occupants. We explore the implementation of building automation systems (BASs) more specifically in commercial buildings rather than residential buildings, for the following reasons:
- The more centralized infrastructure and ownership of commercial buildings makes implementation of BASs easier.
- The economies of scale of commercial buildings will keep capital costs of BAS installation down compared to relative energy savings, making sure that the crossover rate for NPV is less than 5 years.
- The higher sensitivity of businesses to cost relative to residences makes BAS more appealing to commercial building owners.
These kinds of energy control technologies can be game changing in reducing the human footprint on the planet as building energy consumption is the largest contributor of primary energy use in the US, making up 39% of total consumption. Furthermore, there are additional gains to be made in efficiency through reducing peak loads on grids, so we can reduce generation/transmission losses associated with ramping of non-renewable generation, and can rely more consistently on intermittent renewable energy sources instead of fossil fuels.
Unfortunately, the uptake of BAS technologies has been low so far. In 2012, only 37 out of 87 billion sq. ft. of commercial space in the US had any kind of BAS [1]. This is the case because, at 2.5 to 7 $/sqft. just for capital expenses, it often takes firms at least four years to see a return on investment (ROI) [4].
However, the potential energy savings and efficiency gains cannot be ignored, especially as internet-of-things (IoT) based sensors and control technologies improve, and future volatility in energy costs is taken into account. Furthermore, with projected demand of 2 billion sqft. per year for new commercial space, at 2.5 to 7 $/sqft.[4] just for capital expenses, the annual market for BASs in the tens of billions USD, even at low penetration levels. This gives Eyrie the opportunity to be an early entrant and capture significant market share.
BAS technology uses data about the business duty cycle, occupancy as well changing price signals from the grid, to dynamically control building smart devices. This would both allow firms to reduce their primary use of energy without minimal impact to business operations. Furthermore, if businesses choose a low level of penetration for the BAS systems, the technology would inform businesses about their energy use patterns to inform the most effective future automation investments.
DSM Allocation
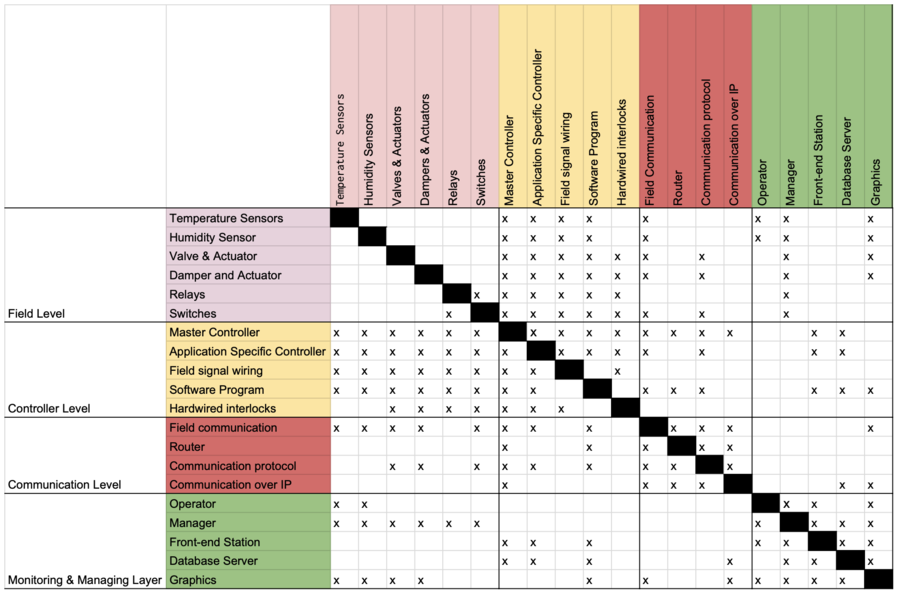
The BAS system standing in the SMART Grid Electrical network is shown below, where BASs are a Level 3 Technology:
This DSM depicts components of the Energy Management System and their interactions.
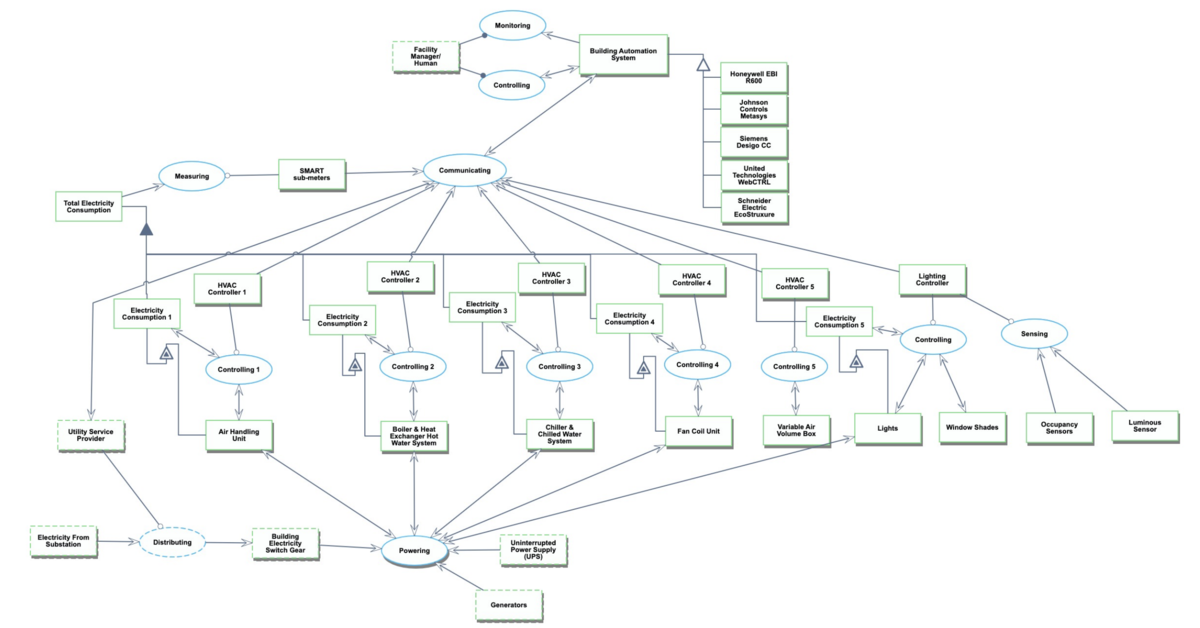
Object Process Diagram - OPD
This Object Process Diagram depicts a high level operation of BASs.
Going one level below, we have the Object Process Diagram (OPD) of the controller operation and some control methodologies used to optimize the use of HVAC equipment.
The detailed explanation of the System in formal language is captured in the Object Process Language at this link: (OPL).
Figures of Merit (FOM)
Energy Efficiency FOMs
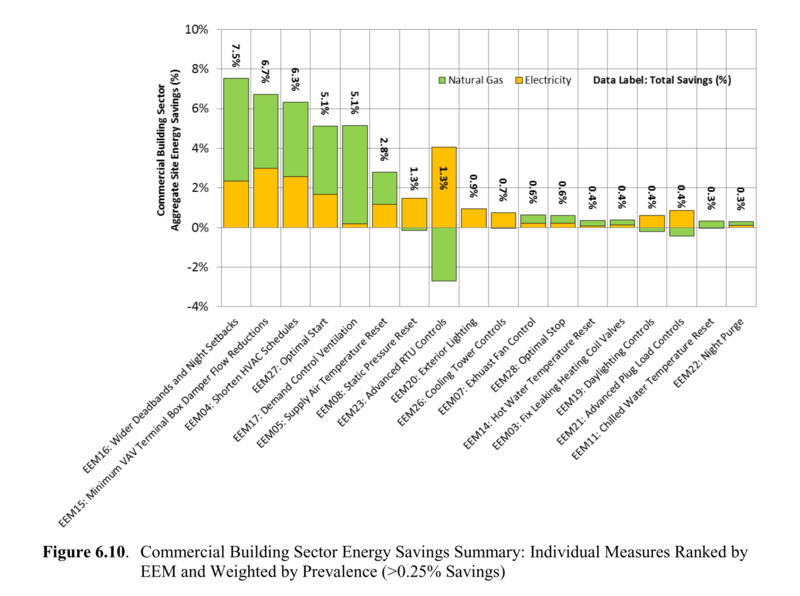
Different kinds of building automation interventions have different levels of efficacy in reducing the primary energy use of commercial buildings. Thus, one of our figures of merit for the efficacy of BAS interventions is the average reduction in total primary energy usage (%), a building-scale independent metric.
Commercial Building Sector Energy Savings Summary: Individual ECMs Ranked. Borrowed from [5].
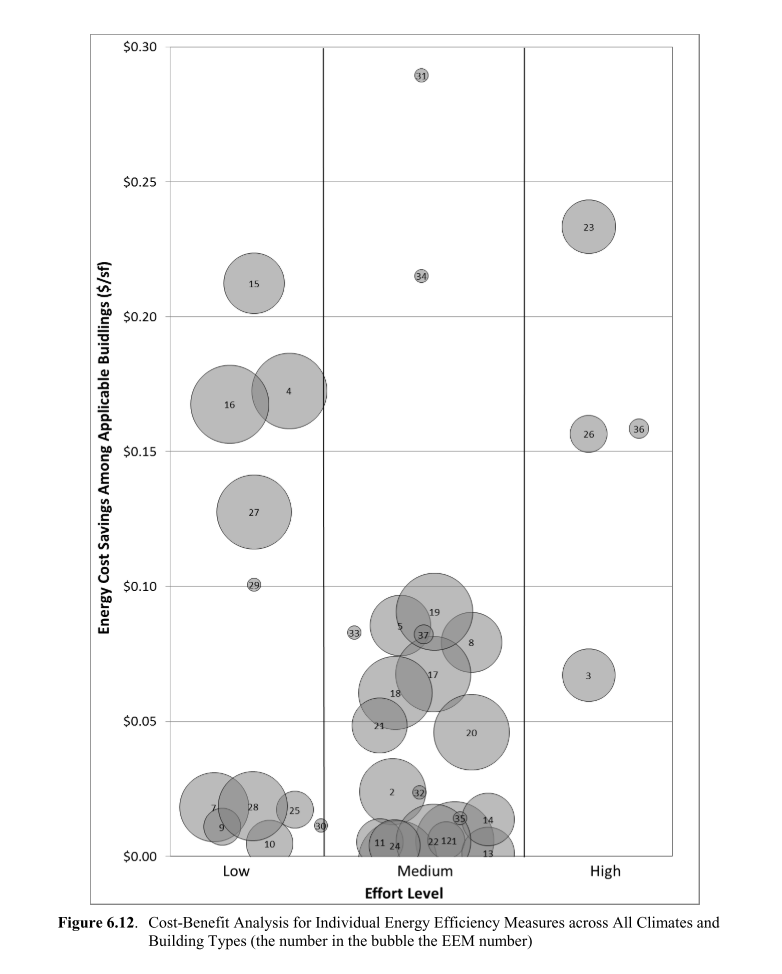
This plot shows the efficacy of different energy conservation measures (ECMs) in lowering commercial building primary energy consumption. Our proposed BAS would implement a combination of the ECMs above considering the average reduction in primary energy usage and projecting the potential savings for specific buildings, as well as taking into account the intrusiveness of implementing the technologies. The actual energy savings of ECMs is reflected to commercial companies through energy cost savings ($/year/sqft), shown by the following diagram.
Commercial building ECM cost-benefit analysis. Borrowed from [5]
The figure above details the expected annual costs savings of different measures, organized by level of effort (expected capital and labor costs) as well as the estimated applicable floor area (size of bubbles). This allows us to prioritize ECMs to maximize savings while minimizing capital expenditures and recurring costs. In economic speak, we want the marginal cost of implementing the next most effective ECM to be equal to the net present value of energy saved in a finite time horizon, justifying the upfront capital investment.
Interoperability FOMs
For building automation interventions, the capability of a system to integrate smoothly with a wide range of appliances, building systems, and sensors is a key factor in determining the potential reach and impact of a particular system. The number of communication protocols a system is capable on integrating with is a good proxy, so we use the number of supported communication protocols (-) as another key FOM. Protocols include: email, SNMP, HTML, Active-X, XML through TCP/IP, OPC, BACnet, MODBUS, LONWORKS® and Ethernet. In recent years, BACNet has emerged as the standard for the industry, but integration with existing building infrastructure requires intercompatibility.
The next stage of interoperability is ability to integrate with wireless protocols associated with IoT technology, which carry the advantage of also not requiring additional cabling in order to retrofit buildings with new interventions.
Capital Cost FOMs
(Some organizations calculate BAS costs based on ($/data points) which relates to the size of building, but we stick to $/sqft.)
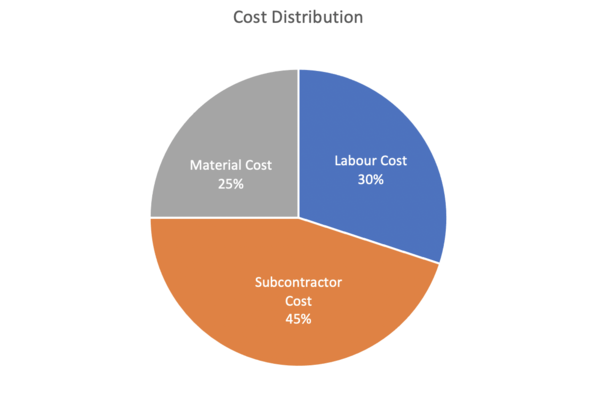
Capital cost of BASs ($/sqft) is calculated based on material cost, labor cost and subcontractor cost as explained below:
1. Cost of the system products provided (Material cost) - the products include the frontend work station and server with license & controllers and panels for all the HVAC systems in the building. The server size depends on the number of data points which is indirectly related to the size of the building & complexity of the HVAC systems
2. Cost of the end devices (Material cost) - these products include sensors, transmitters, valves, actuators, dampers, relays, etc. All these products are not necessarily provided by E-yre and some of them are purchased from 3rd party vendors
3. Cost of Engineering (Labour cost) - this cost includes designing of controls for the HVAC system with hardware deliverables including System Architecture for all the controllers, AutoCAD drawings for Panel design with interlock wiring details, valve, damper and Air Flow Station schedules, Sequence of operation and Bill of Material. These deliverables are approved by the customer and Consultant Engineer before proceeding to future engineering steps. The software deliverables include programming of all the controllers as per the sequence of operation in hardware drawings. The Graphics deliverables include the graphics .html files displaying all the HVAC systems with the customer requested data points linked to the software points
4. Cost of wiring & installation (Subcontractor cost) - this cost includes cost of electricians to wire all the panels as per the design drawings along with the installation and wiring of all the end devices
5. Cost of commissioning (Labour cost) - this cost includes commissioning of all the systems to check their operation as per the customer requirements in others words, the verification and validation of the entire system (end products, controllers & front end graphics) which is called a Site Acceptance Test (SAT)
Based on the type of the project such as greenfield, retrofit, expansion, etc. the weightage of each cost component differs. For a typical greenfield project, the distribution of the installation cost can be represented in form of a pie-chart as shown below:
Other FOMs
Some of our other FOMs are:
- Recurring and/or subscription costs ($/sf/year)
- Commissioning time (months)
- Number of different supported communication protocols (-)
- % of installed systems compatible with supported communication protocols (-)
- # of system nodes supported
- # of integrations supported
- Security level (This XLP site 1 - 10 NSA)
Alignment of Company with Strategic Drivers
Eyrie cannot compete successfully along all the strategic drivers in this industry, so this roadmap is built with the goal of positioning Eyrie as a low-cost competitor, that invests in the technology needed to integrate smoothly with the building construction process. We believe that significant savings, and thus better penetration and a larger impact on the energy consumption at a national scale is best enabled by easy integration, and lower up-front (capital) costs. At present, this positioning required Eyrie to make decisions about which drivers it also should not explicitly pursue, for example extension into the home market, and integration with on-site renewables. The latter could become a focus further in the future (beyond the scope of this roadmap).
The following table lists the strategic drivers of the building automation system technology, and how this translates into company FOM targets.
Positioning of Company vs. Competition
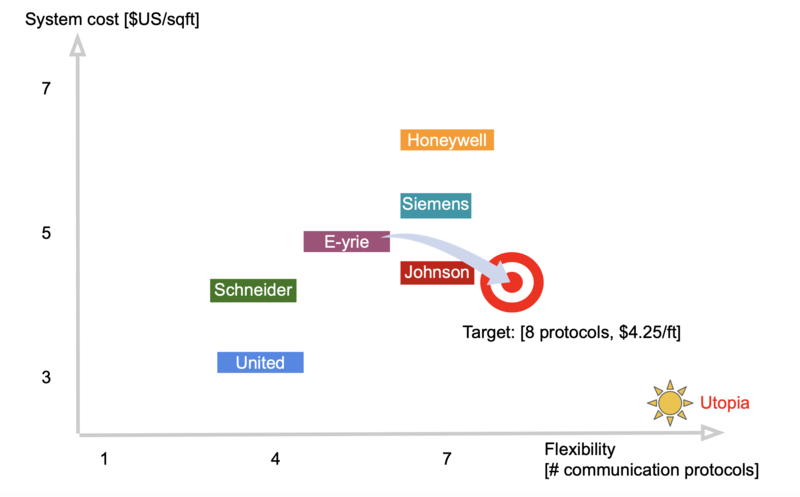
The current performance of top competitors along several dimensions is presented below. Based on the strategic drivers listed above, Eyrie chooses to compete along the dimensions of low cost and high integrability.
Data about the primary competitors is provided below:
Technical Model and ECM Matrix
Technical models exist to model the energy consumption of buildings and by extension the efficacy of ECMs (eg. Scout by US Department of Energy), but the analysis is highly dependent on building infrastructure in question. Buildings are complex ecosystems, where the effectiveness of ECMs is highly dependent on the types of energy loads within buildings and their overall efficiencies.
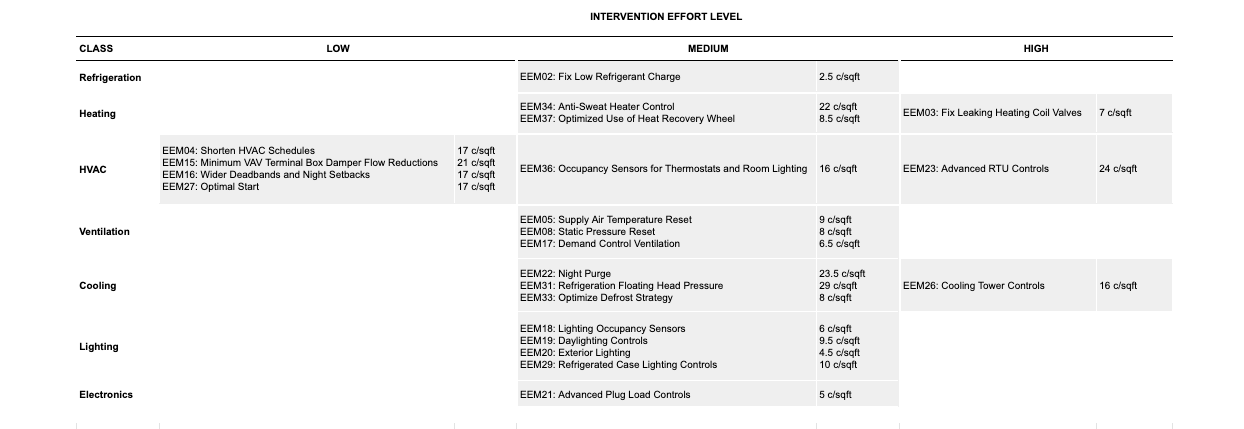
Instead of such a granular analysis of ECMs, we consider the efficacy of ECMs considering the average commercial building, normalized by the floor area. We use data from a literature review of ECMs [5] and group ECMs both by energy system class as well as the level of effort in terms of implementation. We present the ECMs in a matrix, where BASs comprise of a combination of the ECMs, requiring different levels of effort.
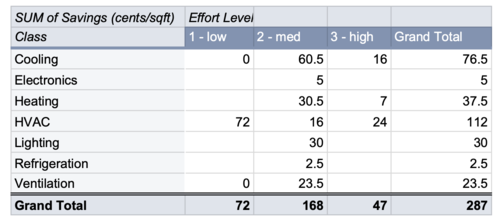
We can compress the data above to show how much energy is saved per unit area ($/sf), for given levels of effort. The simplified model is below:
Financial Model
The cost of BAS is also building-dependent, since it depends on the ECMs implemented as well as the flexibility of the system. The literature claims costs range from 2.5 to 7 $/sqft. We come to the cost analysis from the opposite side. We ignore recurring costs since they have little impact, and attempt to back out the willingness to pay (capital expenditures today) of the average commercial enterprise for different levels of effort of ECMs, given that they want to surpass zero NPV in a finite time horizon. To do this, we define the NPV of ECMs as follows:
Where:
- CapEx is the capital expenditure ($) today for the ECM.
- r is the discount rate (%), which is the opportunity cost rate of return of the money invested in the ECMs.
- h is the time horizon (years) to reach a zero NPV.
- S is the yearly normalized energy savings ($/sqft/year).
r, h and s are our parameters, where h is discrete for simplicity. This kind of analysis allows us to determine the efficacy of different levels of effort of ECMs, and thus determine the benefits of ECMs for firms.
Willingness to pay estimates
So, depending on firm discount rates and time horizon, we estimate their willingness to pay (WTP), and compare these to the costs of different ECM commitments, as shown in the following table.
Green cells indicate the kinds of firms with respect to discount rate and time horizon that experience positive NPV (WTP - capital cost) from BAS. As the discount rate decreases and time period increases, the WTP of firms increases. If firms have lower discount rates, it reflects that they have fewer positive-NPV investment opportunities to spend on, therefore making BAS more appealing. Furthermore, as firms consider longer time horizons for zero NPV, they are more willing to uptake BASs, thus the higher WTP.
If the time period is too short, there are cases when BAS cannot achieve positive NPV in a finite horizon. For high commitment levels, the WTP of firms for incremental levels of ECMs can actually be negative, since the NPV of the marginal ECMs is negative in the short run. For low commitment ECMs, NPV can also be negative since the low commitment ECMs have relatively high capital expenses compared to savings. Since medium commitment ECMs strike good profitability for a range of firm types, we focus on medium commitment for our following sensitivity analysis.
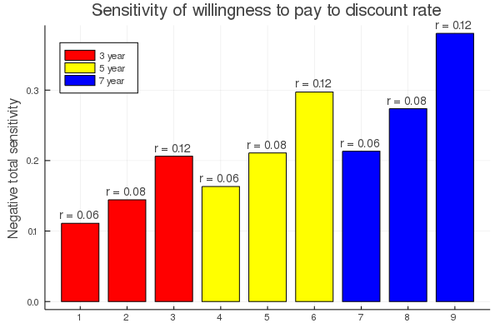
The sensitivity of the WTP with respect to s is not terribly insightful, since it is 1. Instead, we consider the negative sensitivity of the willingness-to-pay w.r.t. the discount rate r, depending on the time horizon and level of ECM effort.
Thus we know the rough capital costs of ECMs (2.5-7 $/sqft), and understand the landscape of WTP for medium-level effort ECMs, as well as the sensitivity of the WTP to the discount rate. When developing ECM infrastructure, these metrics are key to determine what technologies we can include to generate building automation systems with positive profit for our firm, as well as high WTP for commercial building owners.
List of R&D Projects
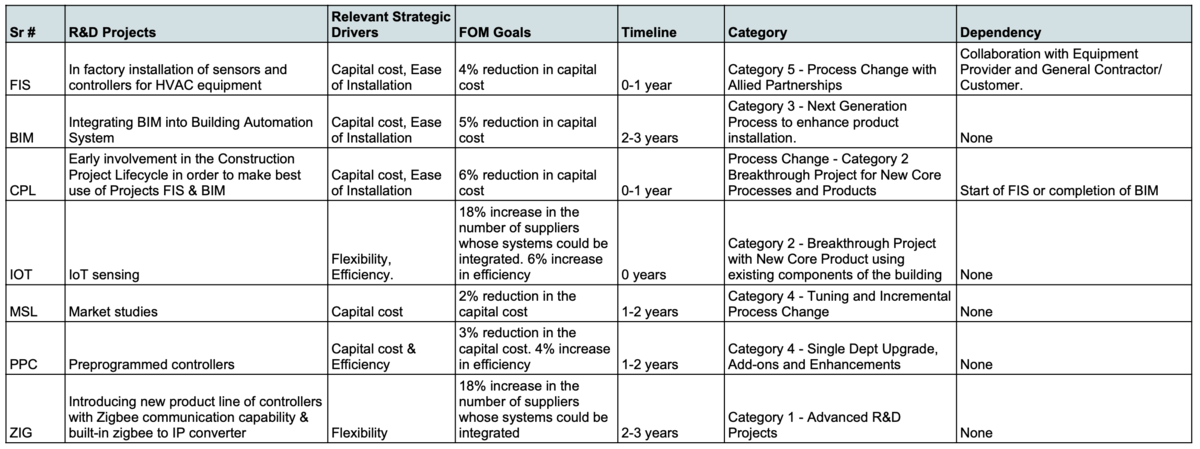
Keeping the strategic drivers and FOMs into account, we have come up with 7 R&D projects which are shown in the table below:
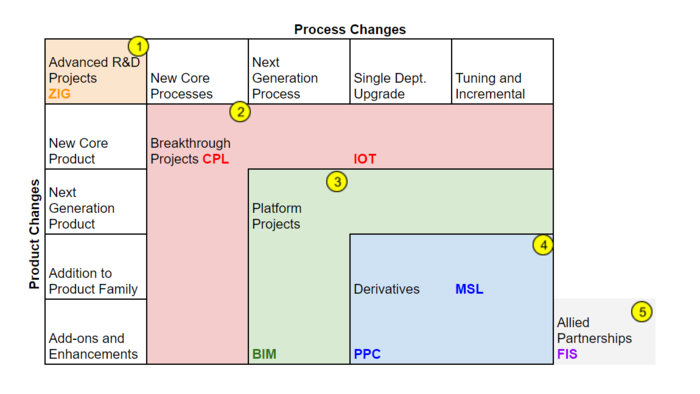
These projects are categorized based on Wheelwright and Clark model as shown below:
Project Description
- FIS: In Factory installation of sensors and Controllers for an HVAC equipment
Currently, the HVAC equipment is built in factory and installed on site. The sensors & controllers needed for HVAC equipment are installed on site. This raises wiring and installation costs for BAS contractors. We propose changes to installation process where the sensors and controllers associated with the equipment are installed during assembly in factory to avoid additional wiring time in the field.
- BIM:Integrating BIM into the Building Automation System
BIM is a 3D modeling tool that allows for the planning of buildings and infrastructure. Being able to plan BAS installation through BIM would allow us to use existing building blueprints to reduce cost and effort of BAS installation. Additionally, this would also reduce dependency of installation process on the completion of hardware AutoCAD drawings and about 30% of the installation work can happen based on the coordinated BIM alone instead of waiting for the entire hardware drawings to be completed.
- CPL: Early involvement in the Construction Project Lifecycle in order to make best use of Projects 1 & 2
Currently, Modeling & layout of different trades in the building happens at a relatively early stage in the construction projects where BAS contractors are not involved. The building and development of HVAC equipment also happen independent of the BAS contractor. In order to better reap the outcomes of our R&D projects 1&2, the BAS contractor needs to get involved in the construction project at the same time as MEP contractors do.
- IOT: IoT Sensing
Using the inherent electronics and sensing infrastructure in the buildings to approximately collect data relevant to energy usage.
- MSL: Market studies. Get greater penetration by selling low intervention
Evaluate the possibility of achieving market penetration by a pilot study selling low intervention systems at low cost, and evaluating rate of adoption of more BAS infrastructure in medium run.
- PPC: Preprogrammed controllers
With the controllers being pre-programmed, the Engineering cost for software development will be significantly reduced lowering the capital cost. Explore the efficacy of a subscription style system for BAS controls. Controllers in this scheme are pre-programmed with different levels of interventions providing an option to choose to match or exceed the required sequence of operation. These intervention levels provide different efficacy levels and the level of subscription determines the efficiency of the system and naturally increasing it.
- ZIG: Introducing new product line of controllers with zigbee communication capability & built-in Zigbee to IP converter
Currently, the Zigbee devices and controllers are available at home automation level where the controller can perform a local control 5-6 household devices such as a home Fan Coil Unit or a Unit Heater, electrical sockets, etc. However, at a building level where these devices are required to be monitored and controlled from a control room front-end, those controllers do not prove useful. In order to achieve that, the data has to be transferred from the controller to the server and having the Zigbee to IP converter built-in the controller will help in carrying out that function.
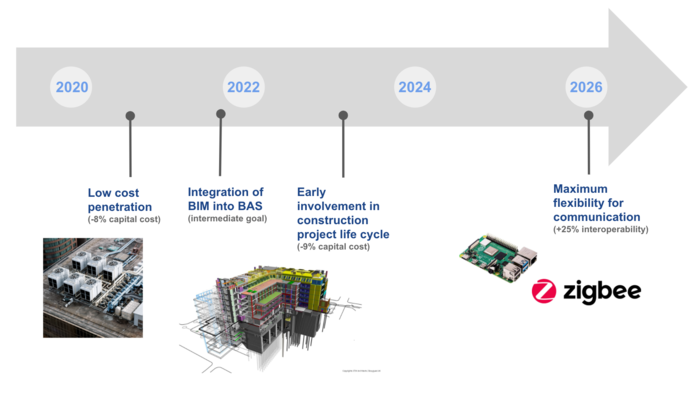
Project timeline
Given our strategic priorities and budget, we have allocated the 7 R&D projects within a 6 year time horizon. The timeline is below.
Financial Projections
Eyrie's discount rate is projected to be 8% per annum until 2030, and our BAS installation price and recurring fees today are $5.31/sqft and $0.50/sqft on average, with 50% margin. We project a 20% decrease in installation price to $4.25/sqft by 2026, with incremental improvements from our 7 R&D projects. Our recurring fees and costs are not expected to change, and our margin is assumed to stay constant. These incremental improvements in installation price and cost are reflected in our installation cost projections.
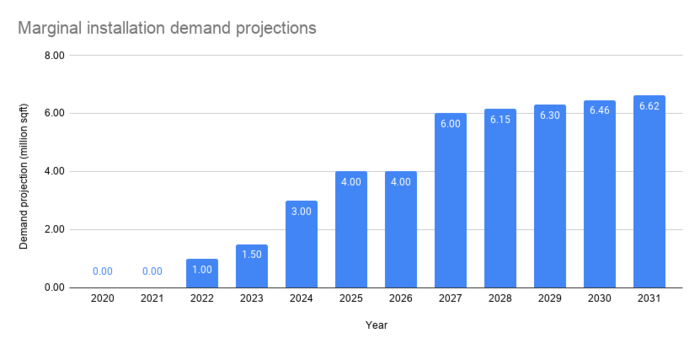
Furthermore, we make projections for new (marginal) BAS installations in million square feet, with associated installation and recurring revenues and costs. We account for demand changes due to flexibility provided by year-to-year conclusion of R&D projects.
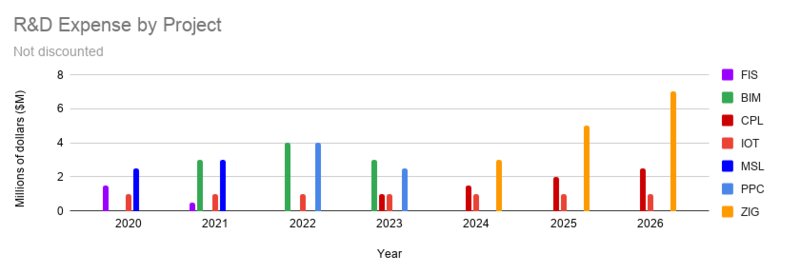
We have defined our R&D cost schedule as follows:
Our installation demand projections are below. Note that the marginal projections start plateauing in 2026 as our current R&D portfolio reaches its conclusion. Future R&D projects will help preserve the upward trends, and will be enabled by the increase in recurring revenue thanks to improvements in market share of BASs.
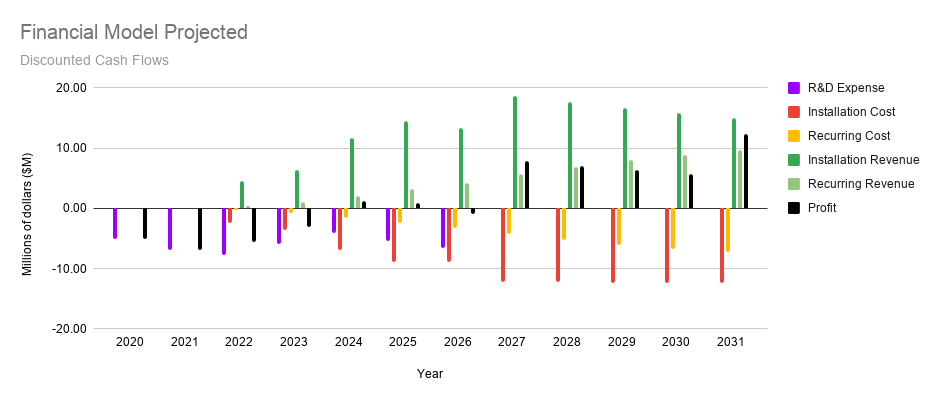
With the associated capital cost reductions, we project both installation and recurrent costs and revenues as follows:
The projected NPV of our R&D until 2031 is $20.2 million in 2020 USD. The R&D projects break even by 2024, but since our R&D portfolio is aggressive we will be solidly in the black only after 2026. Our R&D portfolio will require borrowing $20.5 million in 2020 USD between 2020-2024, and we will break even w.r.t NPV by Sept 2028.
However, after 2026, due to our improved market penetration, Eyrie will have access to relatively stable recurring revenues which will help dampen revenue uncertainty and help pay off R&D expenditures. We do not account for network effects in our model, but it is likely that our demand projections are conservative post-2026. Increased market penetration and consumer trust will have a role in improving Eyrie's installation demand after 2026, although this is hard to quantify.
We have not yet allocated budget for R&D projects post-2026, but given large predicted profit margins (15-20%) we will have flexibility to design R&D projects in 2 years for the 2026-2028 timeframe, to continue to improve BAS technologies and spread to new customers and markets, as well as finance previous R&D investments.
Key Publications and Patents
Publications
- Faruqui, A., and Sergici, S., Household response to dynamic pricing of electricity: A survey of 15 experiments, Journal of Regulatory Economics, 2010:
This is a survey paper on a series of controlled experiments conducted in the US and internationally that evaluate the efficacy of different dynamic pricing schemes for electricity in eliciting a consumer demand response. This paper, while not directly relevant to BASs, is important since it provides estimates for the price and substitution elasticities of demand of homes around the US (95% confidence interval of -0.02 to -0.10 and 0.07-0.40 respectively). Furthermore, it lets quantify the average efficacy of ECMs for consumers across the country.
- Gonzalo Belcredi et al. An implementation of a Home Energy Management platform for Smart Grid, 2015 IEEE PES Innovative Smart Grid Technologies Latin America (ISGT LATAM)[6]:
This paper describes a use case scenario of development and deployment of a Home Energy Management System (HEMS) in an Open Platform on an experimental basis and the observations thus found. The HEMS was built using a Raspberry Pi Model B+ (RPi) single board computer as the backbone of the HEMS also known as Home Energy Controller (HEC) needed to perform the computational work on Linux based Operating System. To implement the setup, the optimization algorithms were programmed in the (RPi) using Raspbian and the monitoring of data was facilitated using an open web based application, Emoncms. The authors concluded that this setup to perform Home Energy Management was useful in determining the latency of the platform, accuracy of measurement and ability of processing complex algorithms. They claim that the energy usage by the appliances was measured with errors less than 5% which was sufficient to push the consumers to take action for optimal use. A review of this publication was useful to know that we have enough technological advancement to apply in a Home Energy setup and convince people to invest in HEMS to get optimal energy utilization at Home level with better control and lower energy bill.
Patents
- EP 2 064 834 B1 for ZIGBEE/IP GATEWAY published on 26.12.2012 with International Publication WO 2008/027615 (06.03.2008 Gazette 2008/10):
The invention under said patent number is filed under under European Patent Specification and it is granted for a method of transmitting a message between a Personal Area Network (PAN) and an Internet Protocol (IP) network and providing a gateway for connecting a Personal Area Network (PAN) with an Internet Protocol (IP) network network. This patent is of significance in BAS, since Zigbee networks can replace the traditional wired sensor and controller interfaces to reduce BAS installation effort, with a small impact to BAS electricity consumption.
- US2008/0082183A1 for BUILDING AUTOMATION SYSTEM WITH AUTOMATED COMPONENT SELECTION FOR MINIMUM ENERGY CONSUMPTION published on Apr 03, 2008 with United States Patent Office:
The invention under the said patent is assigned to Johnson Controls Technology Company and it is for providing a software interface to automatically present options to change different mechanical equipment of a building or components thereof which would result in minimum energy consumption of the said building. To explain - the authors mention that currently, the BAS only control the HVAC systems as they are presented and do not have an ability to improve the efficiency of operation of the systems at its core. They claim that with their software invention, the efficiency of the said systems could be improved by presenting the customers with alternate hardware components such as VFDs, improved AHUs, etc which by design are more efficient. The authors claim that the software will also calculate and present a financial model comparing the energy efficiency of the systems before and after also taking into account the capital cost of installation of new system. This patent provides a leap in the operation of a BAS organization by taking charge of suggesting changes in the HVAC systems of building. If implemented by BAS organizations in conjunction with the regular offerings, this change would help increase the number of buildings with higher energy efficiency.
Technology Strategy Statement
Eyrie's technology strategy targets retrofits of BAS into existing building infrastructure, but is particularly aggressive in trying to capture as much of the 2 billion sqft. per year of new US commercial space as possible. Our primary strategic drivers are the easy installation and commission of BASs, with least capital cost to the customer. Our secondary strategic driver is to upgrade our interoperability features to support subsystems from different manufacturers.
To improve the ease of installation and lower the capital cost to the customer for installation by 20%, we are investing in three R&D projects. One of the projects is FIS where we intend to integrate sensors and controllers for HVAC systems to eliminate the onsite installation cost, reducing capital costs by 4%. The other two projects are CPL and BIM. The BIM project will help in integrating the BIM model into our system so that it could be efficiently utilized in planning and layout to further reduce the cost of installation by 5%. The CPL explores a process change where we plan on speeding up the project booking process so we can have early engagement in new construction projects, reducing overall capital costs by 6%, and conferring large benefits for installation into new infrastructure.
To achieve our second target of interoperability, we are investing in an R&D project to develop a new product line of controllers with built-in Zigbee/IP converter. We project a 25% increase in the number of suppliers whose systems could be integrated into our BAS, by adding this one communication protocol. We are also investing in IoT-based technology to keep at-pace with innovations in extremely low energy sensing and control methods.
Our combined R&D portfolio has an NPV of $20.2 million USD by 2031. The portfolio improves our competitiveness in both ease of integration and cost, and will help us acquire 45 million sqft of the commercial building market by 2031.
References
[1] US Department of Energy, “Innovations in Sensors and Controls for Building Energy Management,” Office of Energy Efficiency & Renewable Energy, 2020.
[2] Faruqui, A., and Sergici, S., "Household response to dynamic pricing of electricity: A survey of 15 experiments", Journal of Regulatory Economics, 2010.
[3] Torriti, J., “Understanding the timing of energy demand through time use data: Time of the day dependence of social practices,” Energy Research and Social Science, vol. 25, 2017, pp. 37–47.
[4] IOT@Intel, "Costs, Savings and ROI for Smart Building Implementation.", 2016, https://blogs.intel.com/iot/2016/06/20/costs-savings-roi-smart-building-implementation/#gs.idiox0
[5] Fernandez, N., Katipamula, S., Wang, W., Xie, Y., Zhao, M., and Corbin, C., “Impacts of Commercial Building Controls on Energy Savings and Peak Load Reduction,” Pacific Northwest National Laboratory, 2017. URL: https://www.pnnl.gov/main/publications/external/technical_reports/PNNL-25985.pdf
[6] Neukomm, M., Nubbe, V., and Fares, R., “Grid-Interactive Efficient Buildings Technical Report Series: Overview of Research Challenges and Gaps,” 2019, p. NREL/TP-5500-75470, DOE/GO-102019-5227, 1577966.
[7] Gonzalo Belcredi et al. "An implementation of a Home Energy Management platform for Smart Grid", 2015 IEEE PES Innovative Smart Grid Technologies Latin America (ISGT LATAM)
[8] EP 2 064 834 B1 for "ZIGBEE/IP GATEWAY" published on 26.12.2012 with International Publication WO 2008/027615 (06.03.2008 Gazette 2008/10)
[9] US2008/0082183A1 for "Building Automation System with Automated Component selection for minimum energy consumption" published on Apr 03, 2008 with United States Patent Office
![2016 US primary energy consumption. Primary source: US Energy Information Administration, 2017. Borrowed from [1].](/images/thumb/a/af/EnergyDiagram_fromUSEIA.png/800px-EnergyDiagram_fromUSEIA.png)
![Diagram of a simple BAS. Source: [1]](/images/thumb/5/5e/BASdiagram.png/800px-BASdiagram.png)

