Computer-Aided Detection Leveraging Machine Learning and Augmented Reality
Technology Roadmap Sections and Deliverables
- 2AIAR - Computer-Aided Detection Leveraging Machine Learning and Augmented Reality
1.1 Roadmap Overview
The working principle and architecture of leveraging Machine Learning and Augmented Reality is depicted in the below.
https://youtu.be/Ipn5fJr7u4Q#t=1m10s (Start at 1:10 and End at 2:17)
This technology uses Computer-Aided Detection (CAD) with Convolutional Neural Network (CNN) deep learning model, leveraging Augmented Reality (AR) for a unique 3D rendering experience. This experience increases the accuracy of interpretation and therefore, proper actions for problem-solving, versus what is available today, which is the simple CAD using high-resolution image processing. In this roadmap, we will present and compare several architectures based on CNN trained to detect and localize objects on the image. These models optimize both the object detection and classifier part of the model at the same time. The interface of these Artificial Intelligence/Machine Learning (AI/ML) models with Augmented Reality (AR) is crucial for new disruptive value to emerge. This presents a number of business and government applications, which can be a great commercial opportunity.
Speed and resolution are key to the success of this interface. For example, and presenting a use case for crime-fighting, as the image above shows: an image is captured through the AR device, processed and detected with a CNN architecture, with the results to be rendered back into the AR device for immediate action. In this case, a most wanted criminal has been detected as a police unit passes through an area of the city.
NOTE: Our team is not focused on the roadmap for AR hardware devices, but on the Machine Learning models and intelligent content that is rendered through these devices. However, at a high level is important to track the interaction and technological progress of AR devices, as our algorithms/system requires interfacing with these third-party devices such as Odyssey, VFX, Hololens, among others (refer to Section 1.6). Refer to the following link for a specific roadmap on hardware devices of AR by our classmates Baylor and LeBLanc: http://34.233.193.13:32001/index.php/Mixed_Reality_(Augmented_%26_Virtual)
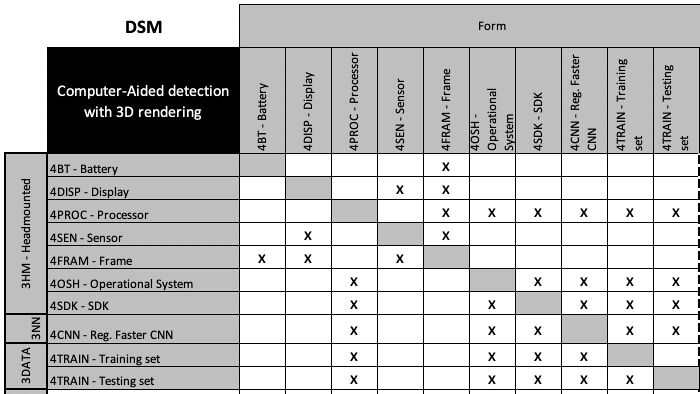
1.2 Design Structure Matrix (DSM) Allocation
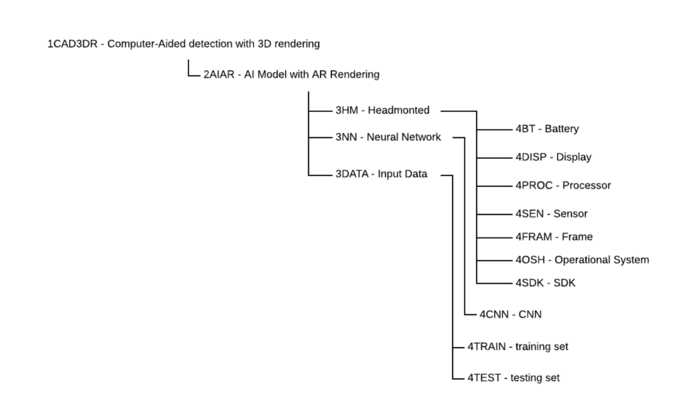
2-AIAR's technical goal is to bring two emerging technologies to complement each other and deliver disruptive value. Both integrate to DETECT and RENDER images or interactive content using subsystem levels:
3HM head-mounted components, 3NN Neural Network algorithms, and 3DATA. In turn, these require enabling technologies at level 4, the technology component level: 4CNN as the level of layer used for the neural network algorithm, 4TRAIN which is the data set to train the model and 4TEST for testing it.
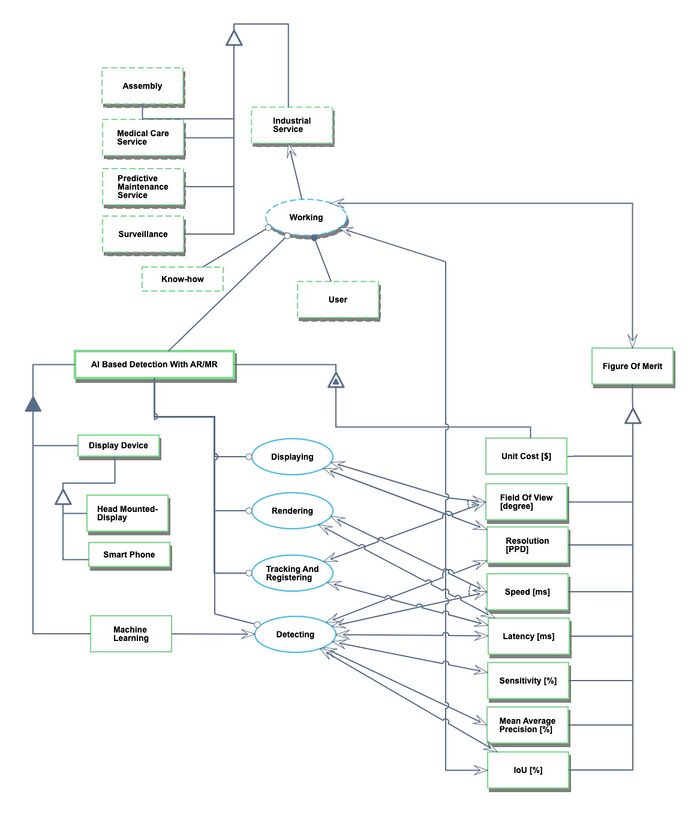
1.3 Roadmap Model using OPM
We provide an Object-Process-Diagram (OPD) of the 2AIAR roadmap in the figure below. This diagram captures the main object of the roadmap (AI and AR), its decomposition into subsystems (i.e. display devices such as head-mounted and smartphones, algorithms and models), its characterization by Figures of Merit (FOMs) as well as the main processes (Displaying, Tracking and Registering, Detecting, Rendering). Industrial services using this technology may include assembly work, medical care, surveillance, and preventive maintenance, but these are outside of the system boundary in this OPD. Here, the user is the agent of each application, not the direct agent of the technology.
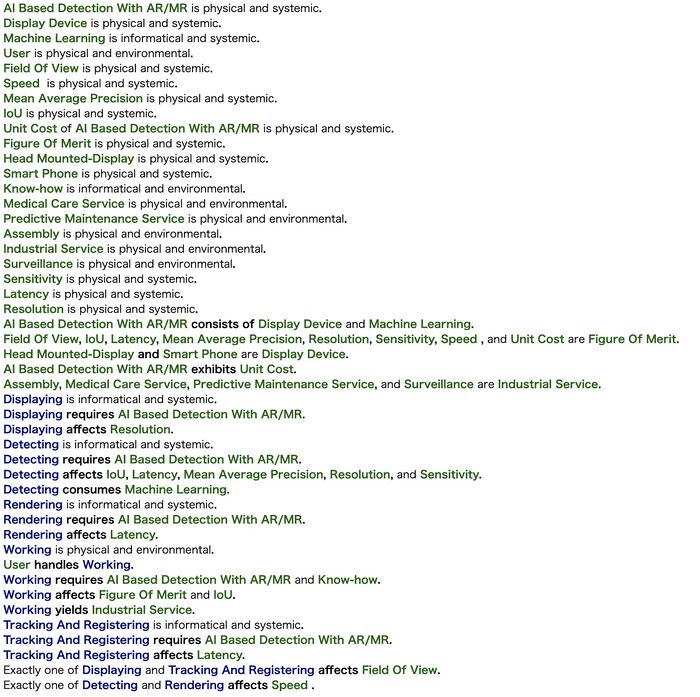
An Object-Process-Language (OPL) description of the roadmap scope is auto-generated and given below. It reflects the same content as the previous figure, but in a formal natural language.
1.4 Figures of Merit
The table below shows a list of FOMs. The first 4 FOM: Resolution, Speed, mAP, and IoU are the primary ones more applicable to the integrated solution of AI and AR. Also, the cost per unit represents the combined utility of both functions: detecting (ML/AI) and rendering (AR). Cost is important, but not a barrier of viability. Therefore, it was not selected as one of the primary ones. The other two FOMs are specifically for the Augmented Reality: Field of View and Resolution. The last two FOMs are for the Machine Learning model: Sensitivity (related to accuracy) and Latency.
| Figure of Merit | Units | Description |
|---|---|---|
| Resolution | [pixels per degree: PPD] | A measure used to describe the sharpness and clarity of an image or picture. High resolution provides quality input to AI models. |
| Speed | [ms] or [FPS] | Inference speed of the object detection model can be expressed in millisecond or frames per second. |
| mAP | [%] | Accuracy of object detection by machine learning. mAP (mean average precision) is the average of AP. The general definition for the Average Precision (AP) is the area under the precision-recall curve. |
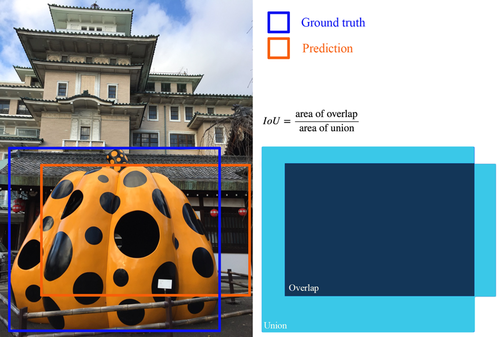
| IoU | [%] | IoU (Intersection over Union) measures the overlap between 2 boundaries. IoU can be used to measure how much predicted boundary overlaps with the ground truth (the real object boundary). |
| Unit Cost | [$/unit] | Cost of processing, analyzing, and displaying one image. |
| Field of View | [degree] | The observable area a person can see via a display device. Typically, a greater field of view results in a greater sense of immersion and better situational awareness. |
| Latency | [ms] | It’s the amount of delay (or time) it takes to send information from one point to the next. It is essential to display the detection results on display in real-time. |
| Sensitivity | [%] | Accuracy of object detection by machine learning. This is called sensitivity and it is calculated as follows: True Positives/(True Positives + False Negatives) |
The table below contains the FOMs to track over time, as it uses three of the primary FOMs that are underlined by the technology. The purpose behind this is to track accuracy, speed, and field of view, which is important for the overall user experience.
1.5 Alignment with “Company” Strategic Drivers: FOM Targets
The table below shows the strategic drivers for the technology and its alignment with the commercial plan.
The list of drivers shows that the company views integrated AR/AI software as a potential new business and wants to develop it as a commercially viable (for profit) business. The roadmap focuses on the B2B segment, not consumers. In order to do so, the technology roadmap performs the analysis using a set of FOM targets that state that IoU needs to achieve an accuracy in object detection of ~95% (although it also depends on the industrial application, lower accuracy can be accepted), a resolution of 60ddp, latency of 20ms, and close to 60fps.
The roadmap confirms that it is aligned with this driver. This means that the analysis, technology targets, and R&D projects contained in the roadmap support the strategic ambition stated by driver 1. The second driver, however, which is to use this AI/AR technology for consumers or domestic applications, is not currently aligned with the roadmap. Our hypothesis is that for the consumer, the evolution of the form factor for the AR device plays a key role and another roadmap needs to be created.
1.6 Positioning of Key Players in AR (Potential Partners): FOM charts
NOTE: The team is not AR devices as part of the roadmap. However, it is important to track the interaction and technological progress of those components, as our algorithms/system requires interfacing with these third-party devices. Therefore, this analysis help us assess potential partnerships for our technology in the future.
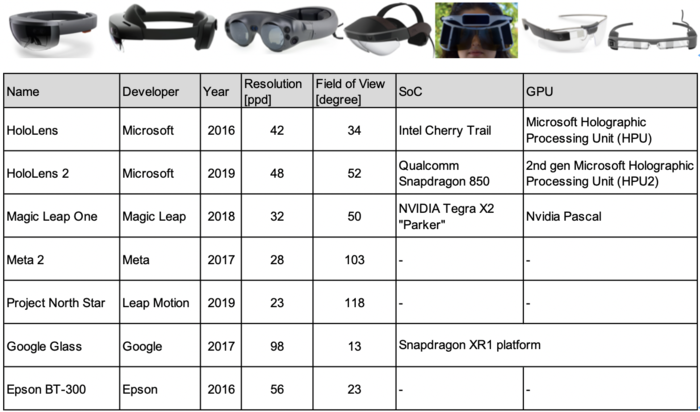
The figure below shows a summary of the holographic AR device, Head-mounted displays and smart glass, that are intended for performing AR applications from public data.
In recent years, wearable devices that can execute AR / MR applications other than smartphones have been developed. The demand is increasing in the industrial use or entertainment fields since, for example, both hands can be used freely. However, there might be less successful products in business today.
These products can be categorized into smart glasses and head-mounted holographic AR device.
- Head-mounted display: Hololens, Hololens 2, Magic Leap One, Meta 2, and Project North Star
- Smart glass: Google Glass and Epson BT-300
Among these products, HoloLens 2 and Magic Leap one might be ahead. For using AI, the GPU performance of Holens 2 seems to be excellent. Microsoft has applied a unique architecture that has been developed by Microsoft to optimize for the better AR / MR experience.
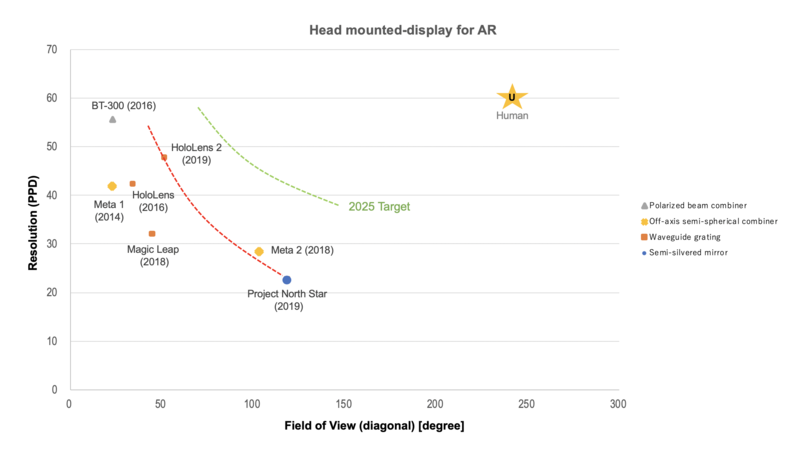
The chart shows that the wearable devices are put on by the type of combiners. Currently, the waveguide grating technique is paid attention to improving FoV. The technique is applied to HoloLens and Magic Leap One. The Pareto Front, that is shown in red, shows the best tradeoff between Field of View and Resolution for actually achieved. Based on the patent research, we predict the technology improvement as shown in the green line.
Human spatial cognitive limits will also become a limitation in the improvements in technology. According to Dagnelie and Gislin (2011), humans have 200 degrees wide and 135 degrees tall in binocular visual fields.
Dagnelie, Gislin (2011). Visual Prosthetics: Physiology, Bioengineering, Rehabilitation. Springer Science & Business Media. p. 398.
1.7 Technical Model: Morphological Matrix and Tradespace
Defining the use case was the starting point to define the Forms and Functions needed to evaluate our FOM and sensitivities. Our use case is to identify a criminal in a crowded street. One policeman is walking in a crowded street using a glass. That glass has sensors that scan people's faces. The person image is processed by a machine learning program. This program compares the image and identifies the person ID (name, address, gender, criminal records). If the person has any pending criminal record issue. The glass will project a red box in the lens. This red box indicates this person should be arrested.
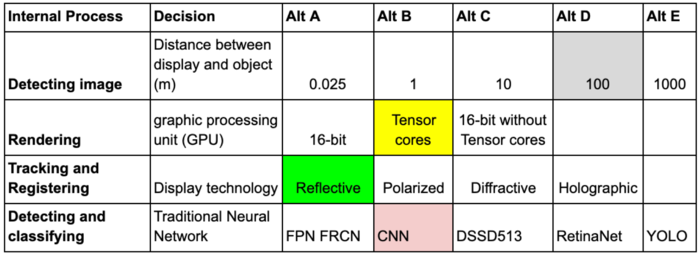
The Morphological Matrix - Table 1 - is the Level 1 Architecture decisions to define our concept. Then we can choose the FOM levels, list of parameters and sensitivity.
The first and most important architecture decision is the distance between the image and the lens. It has an impact on the hardware and software specifications. We defined the maximum distance should be 100 meters. The other architecture decisions are colored in yellow, green and pink to facilitate the visualization.
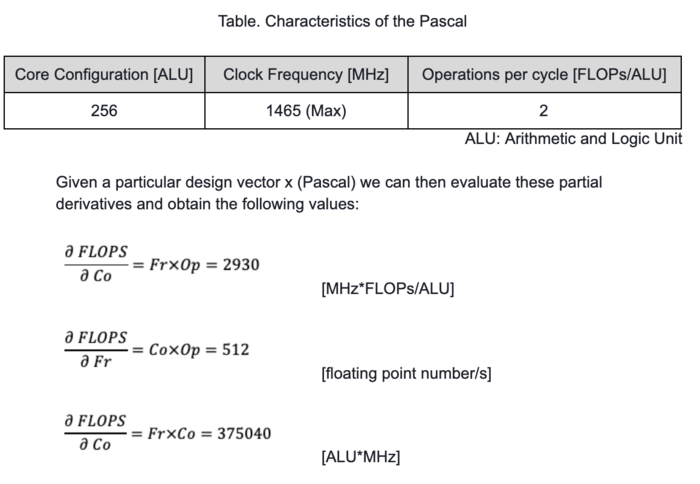
Graphics Processing Unit - GPU - a performance that supports Augmented Reality: FOM: Flops.
For AR applications, many elements are required to work in tandem to deliver a great experience. The features include cameras, vision processing, graphics, and so forth, which leads to needing more GPU to compute abilities that can run the Convolutional Neural Networks that will power the vision processing systems used by AR applications. In 2019, the choice of a GPU has been more confusing than ever: 16-bit computing, Tensor Cores, 16-bit GPUs without Tensor Cores - See Morphological Matrix - multiple generations of GPUs which are still viable (Turning, Volta, Maxwell). But still, FLOPs (Floating Point Operations Per Second) is reliable performance indicators that people can use as a rule of thumb. Therefore, we view FLOPs as a Figure of Merit for AR. Certainly, it contributes to the performance of AI as well. FLOPs equation is here:
FLOPS= Co∗Fr∗Op
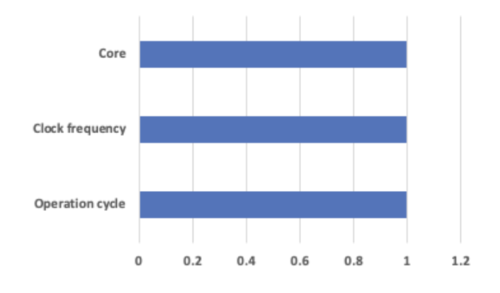
Therefore the normalized tornado plot:
To build a Tradespace for real-time object detection model, we are using the design vectors, fixed parameters, and attributes as presented in the chart below.
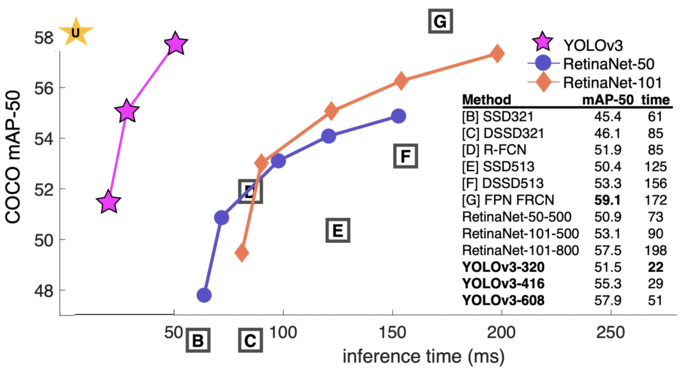
From the Tradespace below, we can see the optimal point or Utopia is where the AI/ML model accuracy is high, and the speed is very high. According to Redmon. J and Farhadi. A (2018), as derived in the Tradespace, algorithms of object detection have been developed rapidly today. The chart given below shows the trade-off between “inference speed” and “recognition accuracy (mean Average Precision: mAP)” with COCO that is a large-scale object detection, segmentation, and captioning dataset. Multiple models with the same name represent differences in network size and network depth. The Tradespace shows how the accuracy of YOLOv3 is comparable to RetinaNet with setting the “mAP-50” to a specific threshold, which in this case, the IoU equals 0.5 (50%). The chart says that YOLOv3 has an overwhelming inference speed with reasonable recognition accuracy so that it might be an excellent model for practical use. YOLO v3 could be the best choice between three models, and it would be Pareto front. However, it should be noted that the speed of technology improvement in this field is super fast. In fact, every year, new models emerge and disrupt old ones. The shift of old S-Curve to a new one is so fast that you need to keep track of the improvements carefully.
1.8 Financial Model
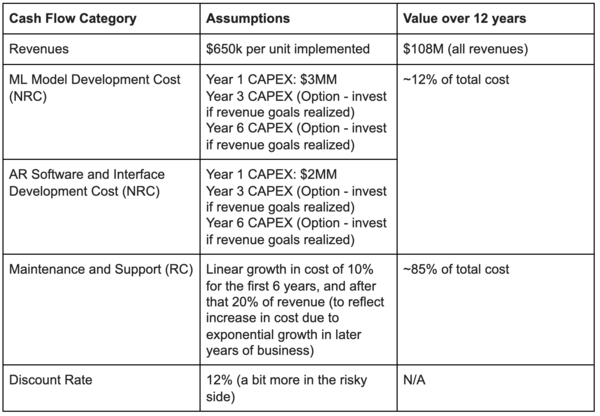
The NPV model presents the financial analysis for the AI/AR R&D project (Computer-Aided Detection Leveraging Machine Learning and Augmented Reality). For the financial model, the following assumptions were made:
1. No revenue until the third period (year 2)
2. Linear growth until period 6, and exponential from that point on (typical in the software industry)
3. Price of technology based on experience in B2B for that type of system (value-based pricing is more appropriate in this case for B2B)
4. Cost of marketing is presented as a percentage of revenue (from best practices in marketing expenditure for technology as presented in Worldwide Microsoft Partners Conference, Las Vegas, NV, July 2019)
5. Initial development cost data based on interviews with SMEs in software for B2B
6. Demand is a conservative number but has a much higher potential due to its government and business applications
The figure below shows the non-recurring cost (NRC) of the product development project (PDP), which includes the R&D expenditures (not presented as a sunk cost - which is typical in financial analysis). A ramp up-period of immediate revenue with just 1 customer for year 2, a linear growth for the first 7 revenue years, and then from period 8 until 12, the growth has a more exponential behavior, as it is typical for this type of technology in the B2B segment. The R&D project will focus on the first 12 periods, with a more R&T project during the first 7 years, and a more R&D for the later periods as it will switch to incremental improvements of a more matured technology with other competitors in the market.
The model presents a positive NPV higher of $500,000. As aforementioned, the periods have been marked as R&T investment years versus R&D, and the forecast of linear growth versus exponential growth.
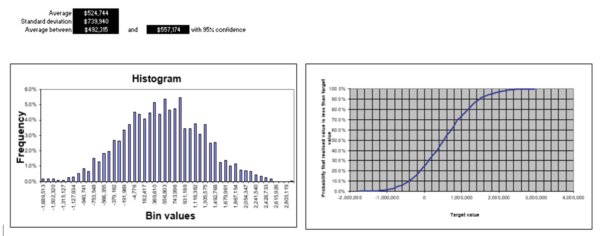
Doing a Monte Carlo simulation for 2000 runs, to test the uncertainty of the demand using a random generator with a uniform distribution, and 20% uncertainty, it yields an average ~$500k, with a high standard deviation (a lot of variability), and a 95% confidence that the NPV will be between $492k and $557k.
Given the lack of models available with both AR and AI/ML in the market, a baseline NPV could not be derived. However, with research and the experience of the team with these technologies, we believe that the delta NPV% presented in the table below is a very realistic forecast given the dramatic improvements presented in the FoMs.
1.9 List of R&T Projects and Prototypes (R&D Portfolio)
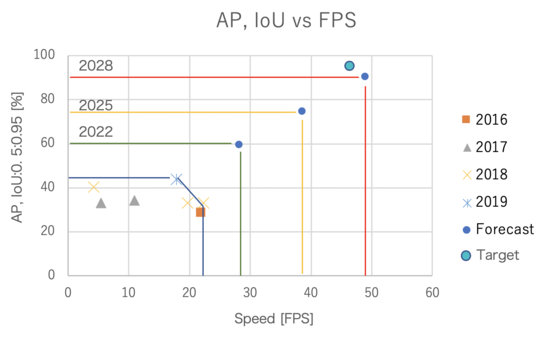
To support and decide on the list of projects, we present the work of Zhao et al. (2019), who shows a different perspective of detection accuracy and speed comparisons of machine learning models for object detection: SSD512, DSSD513, RetinaNet500, CornerNet, YOLOv3, RefineDet512, and M2Det. mAP with IoU and Area as the threshold is a metric (FoM) of the accuracy of the detection result. There are several models in the same year, but the better model the year is picked up and plotted on the following chart. With this data, our team presents below linear approximations to suggest the improvement of the models up to 2028. The work to achieve these improvements make up the list of R&T projects within our technology roadmap.
The diagram given below shows the accuracy and speed of the models based on the above results. Targets depend on application requirements. Some applications would require high speed and accuracy, and others might satisfy high speed and middle-level accuracy. As an example, higher accuracy and speed target is plotted on the chart. If a company wants to release an application that requires more than the target point within 2025, the company should decide to invest the technology improvements to achieve the goal. In a case where it should be released by 2030, the company may want to wait for the models to be improved on their own without investments. However, these improvements are so fast that the forecast should be revised regularly and short-term. However, new models for object detection are proposed every year. Therefore, it is not always a good strategy to invest in R&T for the development of a specific model. Instead, it would be good to invest human resources who can conduct to examine these rapid technology improvements and accommodate them to applications that will be made for a specific purpose by companies. Actually, M2Det was said to be good at the beginning of 2019, but Cascade Mask R-CNN (Triple-ResNeXt152, multi-scale) seems to attract attention more in the second half of 2019. Also, the limits of technological improvement should be observed.
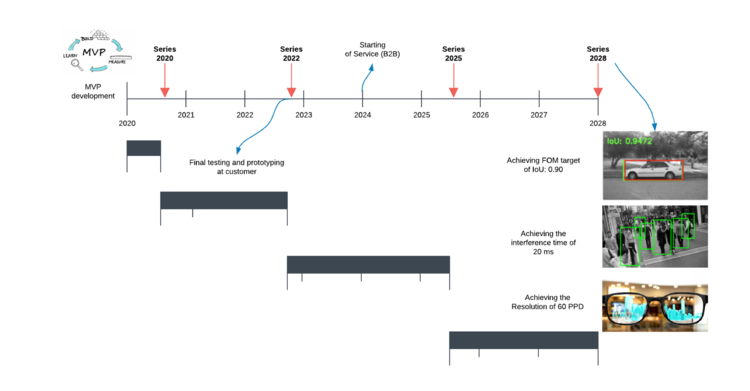
The Figure of Merit (FOM) was organized into two main categories, Machine learning and Augmented reality. We established the long-term targets of the ideal product values. The current technology isn't ready to achieve the target levels, are a result of this we organized our Product Roadmap into 4 main products: Series 2020, 2022 and 2025 and 2028. The FOM's values were based on the linear approximations of the models up to 2028. The green highlighted cells are in the year the product achieve the Target.
The Gantt Chart bellow is the expected timing the products will be launched into the market.
1.10 Keys Publications and Patents
Publications:
1. P. Milgram and A.F. Kishino.
Historically, the first concept of Mixed Reality (MR) was proposed by Milgram et al. (1994). Mixed reality (MR) experience is one where a user enters the following interactive space:
- Real world with virtual asset augmentation (AR)
- Virtual world with augmented virtuality (AV)
P. Milgram and A.F. Kishino. (1994). Taxonomy of Mixed Reality Visual Displays. IEICE Trans. Information and Systems, vol. E77-D, no. 12, pp. 1321-1329.
2. Huges
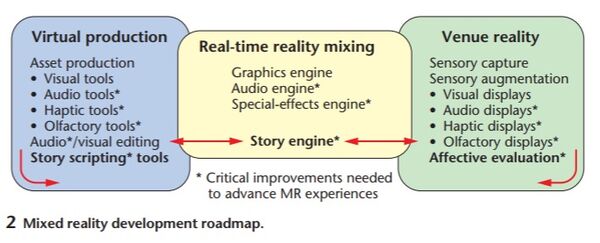
Hughes (2005) gave shape the concept of MR. MR content is the mixed visual and audio one for both AR and AV.
- AR: image, sound, smell, heat. The left side of the figure below
- AV: virtual world overlaid with information of real-world obtained with such as camera and sensors. The right side of the chart below, which is captured, rendered and mixed by graphics and audio engines.
D.E.Hughes. (2005). Defining an Audio Pipeline for Mixed Reality, Proceedings of Human Computer Interfaces International, Lawrence Erlbaum Assoc., Las Vegas.
3. Adriana et al.
Adriana et al. (2009) sophisticates the definition of Mixed Reality (MR): MR is the merging of real and virtual worlds to produce new environments and visualizations where physical and digital objects co-exist and interact in real-time. This paper removes the somewhat confusing concept of Augmented Virtuality (Virtual world overlaid with information of real-world obtained with such as camera and sensors) from MR and added real space instead (meaning has not changed). This paper also emphasizes spatiality, interactivity, and real-time nature.
Silva, A. de S. e., & Sutko, D. M. (2009). Digital cityscapes: merging digital and urban playspaces. New York: Peter Lang.
Currently, methods to realize AR technology could be categorized as location-based AR and vision-based AR.
- Location-based AR: it presents information using location information that can be acquired from GPS and so forth.
- Vision-based AR: With technology such as image analysis and spatial recognition, Vision-based AR shows information by recognizing and analyzing a specific environment. Vision-based AR is further divided into two types: marker type AR and markerless type AR.
We think about applying AI into Vision-based AR with markerless type. The following papers gave us insights into design space about a combination of AI and AR.
4. Huang et al.
This paper aims to serve as a guide for selecting a detection architecture that achieves the right speed/memory/accuracy balance for a given application and platform. To this end, the authors investigate various ways to trade accuracy for speed and memory usage in modern convolutional object detection systems. Some successful systems have been proposed in recent years. Still, apples-to-apples comparisons are difficult due to different base feature extractors (e.g., VGG, Residual Networks), different default image resolutions, as well as various hardware and software platforms. This paper presents a unified implementation of Faster R-CNN, R-FCN, and SSD systems, which is viewed as “meta-architectures.” It traces out the speed/accuracy trade-off curve created by using alternative feature extractors and varying other critical parameters such as image size within each of these meta-architectures.
Huang, J., Rathod, V., Sun, C., Zhu, M., Korattikara, A., Fathi, A., and Murphy, K. (2017). Speed/Accuracy Trade-Offs for Modern Convolutional Object Detectors. 2017 IEEE Conference on Computer Vision and Pattern Recognition (CVPR). doi: 10.1109/cvpr.2017.351.
5. Liu et al.
This paper provides the perspectives of object detection by AI in AR applications. Most existing AR and MR systems can understand the 3D geometry of the surroundings but cannot detect and classify complex objects in the real world. Convolutional Neural Networks (CNN) enables such capabilities, but it remains difficult to execute large networks on mobile devices. Offloading object detection to the edge or cloud is also very challenging due to the stringent requirements on high detection accuracy and low end-to-end latency. The long latency of existing offloading techniques can significantly reduce the detection accuracy due to changes in the user’s view. To address the problem, the authors design a system that enables high accuracy object detection for the commodity AR/MR system running at 60fps. The system employs low latency offloading techniques, decouples the rendering pipeline from the offloading pipeline, and uses a fast object tracking method to maintain detection accuracy. The result shows that the system can improve the detection accuracy by 20.2%-34.8% for the object detection and human keypoint detection tasks, and only requires 2.24ms latency for object tracking on the AR device. Thus, the system leaves more time and computational resources to render virtual elements for the next frame and enables higher quality AR/MR experiences.
Liu, L. Li, H. and Gruteser, M. (2019). Edge assisted real-time object detection for mobile augmented reality, MobiCom, ACM.
6. Zhao et al.
Zhao, Q., Sheng, T., Wang, Y., Tang, Z., Chen, Y., Cai, L., & Ling, H. (2019). M2Det: A Single-Shot Object Detector Based on Multi-Level Feature Pyramid Network. Proceedings of the AAAI Conference on Artificial Intelligence, 33, 9259–9266. doi: 10.1609/aaai.v33i01.33019259
Feature pyramids are widely exploited by both the state-of-the-art one-stage object detectors (e.g., DSSD, RetinaNet, RefineDet) and the two-stage object detectors (e.g., Mask RCNN, DetNet) to alleviate the problem arising from scale variation across object instances. Although these object detectors with feature pyramids achieve encouraging results, they have some limitations due to that they only simply construct the feature pyramid according to the inherent multiscale, pyramidal architecture of the backbones which are originally designed for object classification task. Newly, in this work, we present Multi-Level Feature Pyramid Network (MLFPN) to construct more effective feature pyramids for detecting objects of different scales.
Patents:
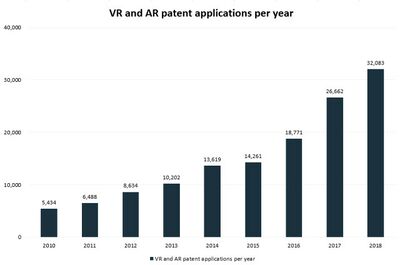
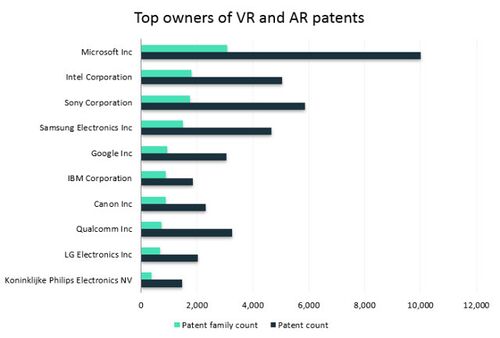
iam-media.com analyzed 140,756 patents. The figure given below illustrates the number of patent applications between 2010 and 2018. Patent filings have more than doubled in the past four years. The data shows that an increasing number of companies are applying for patent protection.
(Source: iam-media.com)
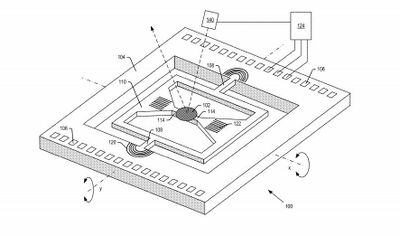
The figure shows that Microsoft, Intel, and Sony are the three most active VR and AR-related patent owners. In this section, we mention the Microsoft patents that are related to the field of view.
(Source: iam-media.com)
1. WAVEGUIDES WITH EXTENDED FIELD OF VIEW
Using embodiments described herein, a large FOV of at least 70 degrees, and potentially up to 90 degrees or even larger can be achieved by an optical waveguide that utilizes intermediate-components to provide pupil expansion, even where the intermediate-components individually can only support of FOV of about 35 degrees. Additionally, where only a portion of the total FOV is guided to disparate intermediate-components, a power savings of up to 50% can be achieved when compared to a situation where the FOV is not split by the input-coupler.
2. MEMS LASER SCANNER HAVING ENLARGED FOV
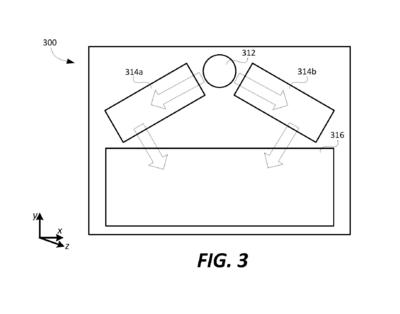
Like current augmented reality headsets with liquid crystal on silicon (LCoS) or digital light processing (DLP) display engines, a MEMS laser scanner projects images by reflecting light onto gratings on a display. While the FoV of a MEMS laser scanner display is usually only 35 degrees, the patent application calls for the display to generate light in two different directions, with the projected images potentially overlapping in the middle. As a result, the field of view could approach 70 degrees, according to the patent summary.
1.11 Technology Strategy Statement
Our target is to develop technology that creates AI-based content for augmented reality leveraging the most advanced machine learning models to solve complex business, industrial, and societal problems. This technology advances augmented reality to the point of real time capturing of object/image, at the highest quality, with instantaneous object detection through a trained machine learning algorithm. To achieve this, our company will focus in a series of projects to maximized accuracy of detection and speed, specifically to be interfaced and rendered to AR devices. Our target is to obtain a ~60fbs (measure of speed), and for the CNN (ML) models a mAP (mean Average Precision) of 95% for an IoU (Intersection over Union) range between 0.5 and 0.95, and taking into account latency (~20ms). These projects should be developed in the next 3 years with final testing and prototyping at a customer site starting in 2023 to go into service in 2024. Both could be developed in partnership with companies like Google, PTC, or others. This is based on a seamless interface between both technologies to be rendered through most AR devices available in the market with a spec equivalent to a 4-Core NVIDIA Titan X today 12 years from now. Business targets are expected to be met by ~2030.
