Ground Based Radar For Space Situational Awareness
Technology Roadmap Sections and Deliverables
This technology roadmap is identified as:
- 2GREAT - Ground Based Radar For Space Situational Awareness
Or as Ground-based Radar to Enable Awareness and Tracking (GREAT)
Space Situational Awareness and Tracking (SSA) is the operational concept to detect, identify, and track Resident Space Objects (RSOs), orbiting around the Earth. The SSA/T enterprise is comprised of ground-based and space-based sensors with a broad customer base. SSA originated from the need to track RSOs in orbit to support data analysis and collision avoidance of active satellite vehicles (SVs), inactive SVs, and orbital debris. As of 1 September 2023, the European Space Agency estimates about 8600 functioning SVs, over 1,036,500 objects greater than 1cm, and more than 11,000 tonnes of mass in orbit1.
The figure below illustrates the levels within the SSA/T enterprise. Many systems comprise the architecture, each with technological challenges, advantages, and disadvantages.
Ground Based Radar For Space Situational Awareness and the SSA Enterprise
Roadmap Overview
Space Situational Awareness and Tracking (SSA) was initiated in the 1950s to support missile warnings of intercontinental ballistic missiles. The first of these radars was developed to identify and track missiles when they reach the apogee of their suborbital flight and begin their re-entry. In 1955, shortly after the sub-orbital radars began operation, the Soviet Union launched its first satellite, and a new space race began. With the growing concern about the need to track low earth orbit (LEO) satellites, most suborbital missile warning radars began to support detecting and tracking satellites.
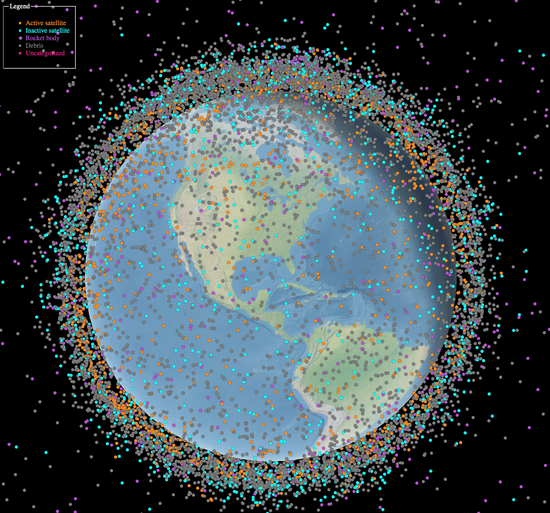
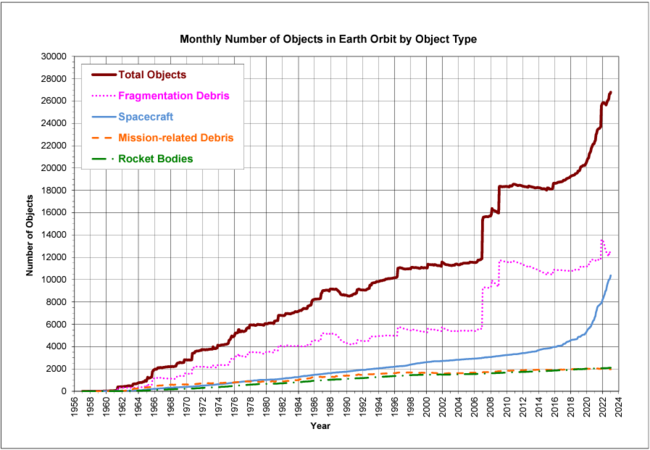
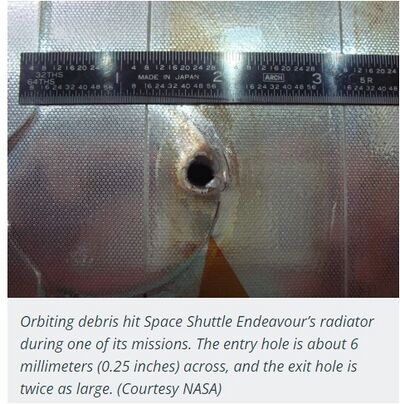
Today, over 26,000 objects over 10 cm are tracked by the United States SSA network, and countless more pieces of debris under 10 cm. This debris poses a risk to satellites in orbit, space stations, launch vehicles, and satellites transit through orbits.
Anthropogenic Space objects in Low Earth Orbit, Accessed 28 October 2023. https://ibm.github.io/spacetech-ssa/ ; Amount of Orbital Debris by Type, from NASA Quarterly "Orbital Debris" March 2022 Newsletter, Accessed 02 October 2023. https://orbitaldebris.jsc.nasa.gov/quarterly-news/pdfs/ODQNv27i1.pdf
Example of damage caused by orbiting debris under detectable size (<1cm2), Accessed 20 October 2023. https://www.earthdata.nasa.gov/learn/sensing-our-planet/rubble-trouble
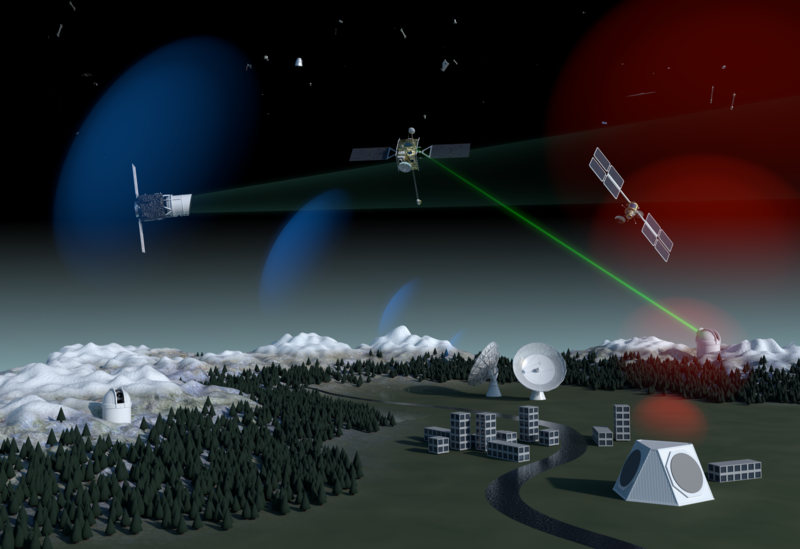
The Ground-based SSA network consists of multiple active and passive sensors. The most capable systems are ground-based radars. A ground-based SSA radar has varying subsystem architectures such as phased arrays, single arrays, monostatic, or bi-static systems. Each radar system varies in frequency and power based on the needs of that radar site. Many SSA systems are networked to support the shared object identification and tracking catalog.
Artist's impression of various SSA systems comprising a full SSA architecture. “Space Surveillance and Tracking - SST Segment.” Accessed October 1, 2023. https://www.esa.int/Safety_Security/Space_Surveillance_and_Tracking_-_SST_Segment.
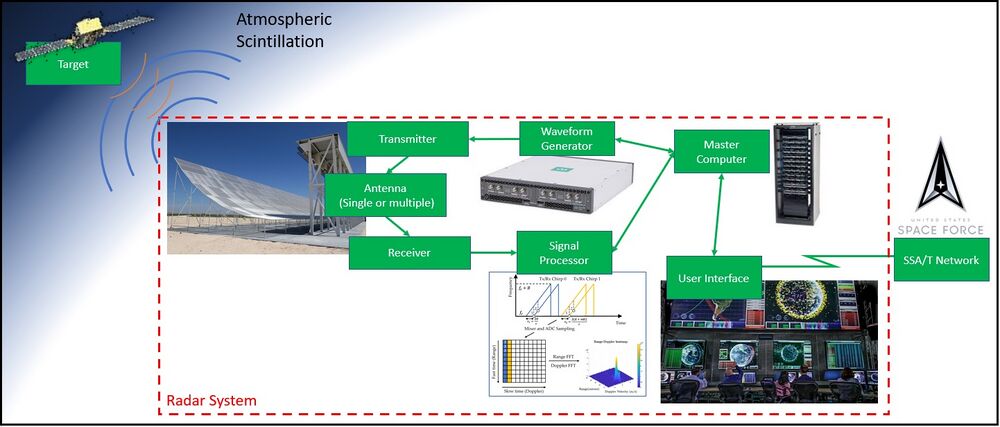
Broadly speaking, a ground-based radar consists of a radar transmitter and receiver, a master computer, and a user interface. The system emits a high-power waveform and then attempts to identify radar returns from the received noise. This process is not trivial. The system must transmit with enough power to overcome path loss, which reduces the range of a radar by Range4, and Atmospheric Scintillation in both directions. The return signal is often so faint that the main computer must use advanced signal processing and detection algorithms to find the return signal in the noise. The signal must then be tracked to collect its azimuth and elevation from the radar and the range and range rate. This data can then be used to identify and provide the object's location, as a two-line element set (TLE), to cataloging agencies such as the United States Space Force.
Diagram showing Ground-Based Radar Overview
This Roadmap will explore what technology has driven the success of SSA radars, how to optimize the system further, and what innovative, potentially disruptive, technologies are on the horizon.
Design Structure Matrix (DSM) Allocation
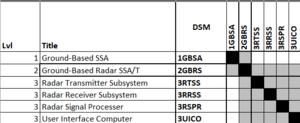
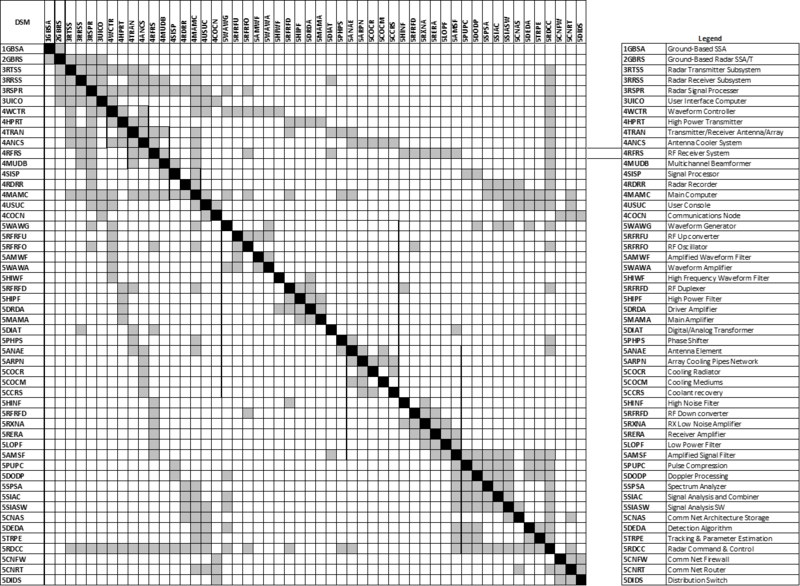
The DSM below provides a 52x52 mapping of the ground-based radar SSA system technologies. The DSM identifies the connective relationship between elements within the matrix (grey).
Roadmap Model using OPM
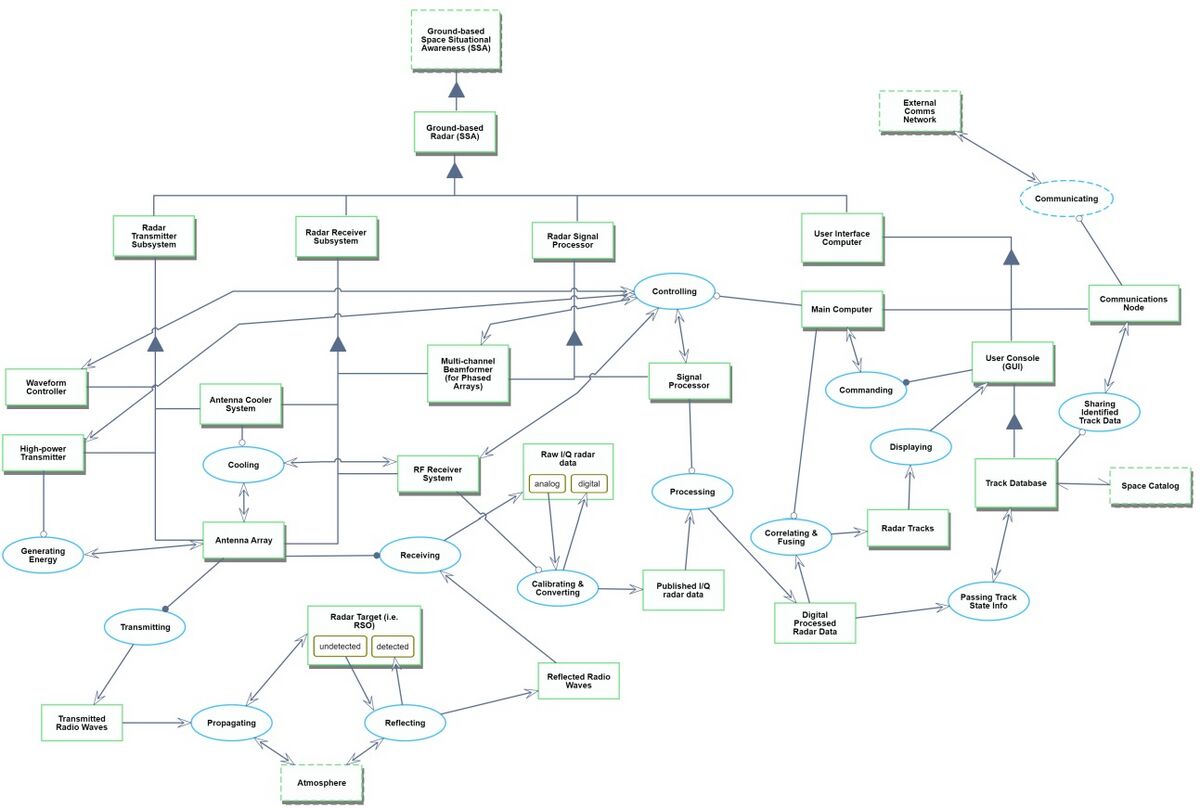
The Object-Process Diagram (OPD) is of a Ground-based Radar with the mission of tracking Resident Space Objects (RSOs) in support of Space Situational Awareness. The Radar has four primary subsystems: the Radar Transmitter Subsystem, Radar Receiver Subsystem, Radar Signal Processor System, and the User Interface Computer. These four subsystems operate the process of transmitting radio waves to reflect off a RSO target, receiving the return reflected radio waves, and then processing the received radar data into digital tracks to be displayed to an operator and passed to external communication networks.
The Object-Process-Language (OPL) description of the roadmap scope is auto-generated and provided below. It reflects the same content as the previous OPD figure, but in a formal natural language.
Figures of Merit
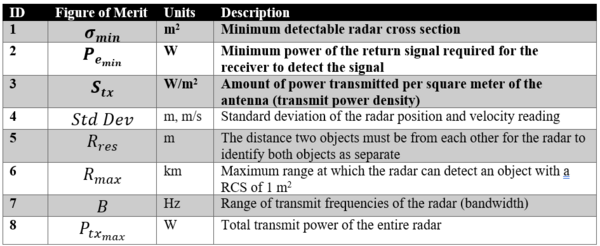
The table below shows the Figures of Merit (FOMs) that can be used to assess the improvement of Ground-Based Radars for Space Situational Awareness. The key FOMs are indicated in bold.
The governing equations for the key FOMs are listed in the table below. Note that the first two equations are both interpretations of the radar range equation.
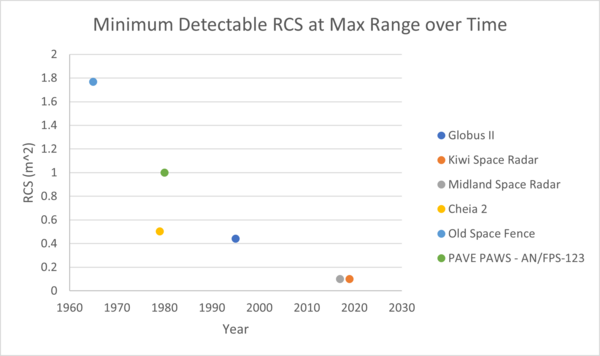
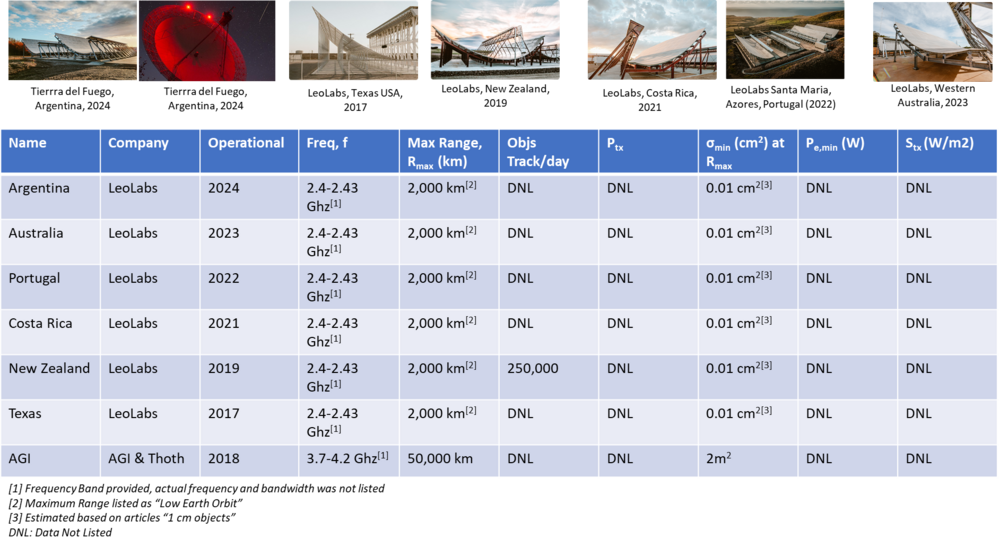
Data collection was limited due to the highly propriety nature of commercial systems (e.g., LeoLabs) or due to the information protection enforced on military-funded programs (e.g., MIT Milestone or Lockheed Martin’s Space Fence). However, the team was able to collect and compare the advertised minimum detectable radar cross-sections at each system’s stated range. A plot of the minimum detectable radar cross-sections at maximum range over time can be seen below.
Notice that the trend is sloping downwards and beginning to level out. The downward slope indicates an improvement of the technology over time. The minimum detectable radar cross section can never be zero, as it is not physically possible to see something with a diameter of 0 meters. However, the goal, and thus theoretical limit, would be to approach zero.
Sensitivity
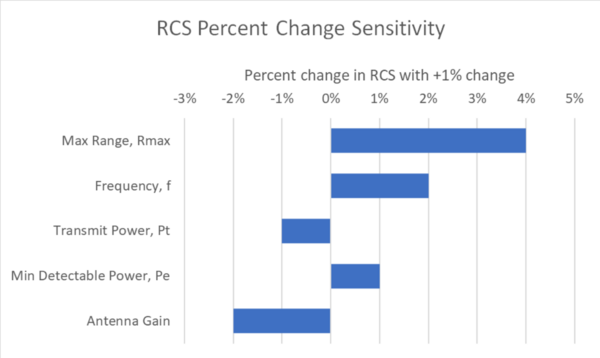
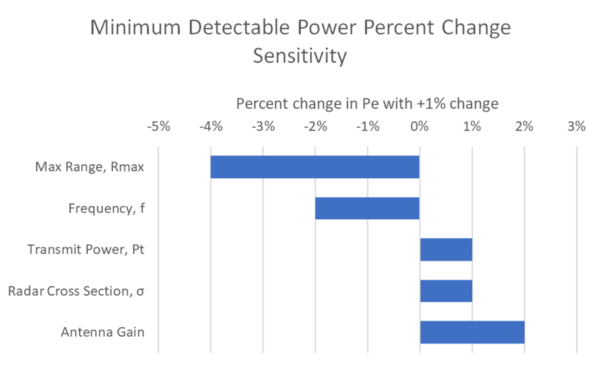
Out of the three key figures of merit, two focus on enhancing the performance of the radar. Using the radar range equation, the sensitivity of the variables are presented below as they would respond to a 1% change in the respected figure of merit with all else being held constant.
This is properly read as follows: For the range row, if you increased the range by 1%, the detectable radar cross section would increase by 4%. Because the goal is to decrease the detectable cross section, an ideal design plan would be to increase transmit power or antenna gain or decrease range, frequency, or minimum detectable received power.
This figure is read the same as above. However, unlike the FOM, this indicates pure received power, not the actual system minimum. Thus, with all else equal, if you increase the range by 1%, the received power will decrease by 4%. This may be impossible for the system to pick up. Design choices should be based on increasing the received power, thus "enhancing" the received signal. Therefore, to improve signal reception, designers should decrease range or frequency or increase transmit power or antenna gain. Note that these design choices match those above focused on decreasing the detectable radar cross section.
Technical Model
A system's requirements drive many architectural decisions. Each architectural decision comes with a design tradeoff that impacts the Range Equation and data accuracy in its own way.
Number of Antenna Elements
The number of antennas directly affects how many objects a radar can track. Each antenna records the signal and will have a receiver to evaluate the dedicated data. The number of antennas also has limitations, such as maximum power, complexity, and sparing. Multiple elements in an array are referred to as a phased array, and they come in three types: 1)frequency scanning, 2) linear, and 3) planer. All three have the same generic limitations. There are maximum powers that can be sent to an element in a phased array to prevent arching across elements. Additionally, each element has to be tuned to prevent interference with each other increasing the system's complexity. Lastly, the system requires more maintenance and sparing to keep all arrays healthy and operational. If an array fails, the entire array is affected due to its complex tuning.
Frequency
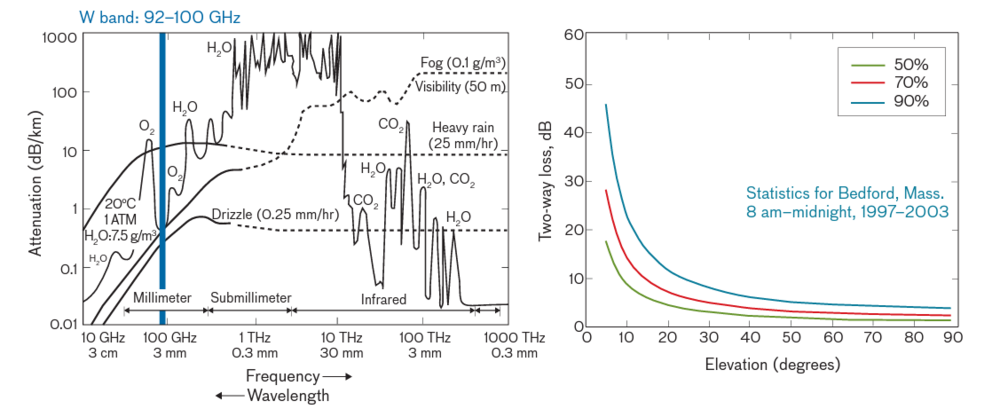
Three factors primarily drive the frequency of a radar: 1) Bitrate, 2) Maximum desired power, 3) atmospheric attenuation trade-offs. Higher frequency antennas can easily span wider bandwidths and have a higher bit rate. This is extremely important for imaging radar systems or communication systems. There are two opposing forces on high-frequency systems. There are current technological limits for higher power at higher frequencies. There are limits at which amplifiers can support the higher frequencies before the dielectrics breakdown and arching within the system occurs. The other opposing force is atmospheric attenuation. As shown in the figure below, the attenuation generally increases with the frequency, thereby demanding more power out of the system. The MIT Lincoln Laboratories HUSIR antenna was recently modified for a low-power X-band system, targeting the O2 notch at that frequency. The result was a highly capable antenna, requiring significantly less power.
Antenna Architecture
The antenna architecture determines a system's beam width and gain. Flat panel antennas use phased arrays with relatively low gain. They rely on their maximum power out and beam steering to collect better data. Many parabolic antenna systems exist, including axial, offset, and Cassegrain. Axial and offset systems have a single element or a linear array affixed to a non-steerable antenna. Axial is used for larger parabolic antennas, pointing near the zenith. Offset antennas allow a partial parabolic dish to be pointed in an optimal direction, but have a small beamwidth. Cassegrain systems are used for extremely narrow beamwidths that produce high-gain systems. Cassegrain antenna is rarely used with phased arrays because the gain coming into the antenna is so high that the elements arch.
Target Range
The planned range the system will operate at directly affects the systems RCS accuracy (refer to the range equation). High-range requirements drive other architectural decisions such as minimum RCS, minimum power out, SNR within the system, and gain. For SSA radars, these are traditionally broken up by orbit type: LEO (160-2000 km), MEO (2000-35785km), and GEO (35786 and beyond).
Steering
Steering is described as how the beam of an antenna is manipulated to follow a target. This can be physically (i.e. steerable) or done at the receiver level (i.e., beam steering). Some architectures are fixed and are best described as a "space Fence". These antennas have a static coverage area that identifies and tracks RSOs as they move through the area.
Primary Radar
Two primary radar architecture decisions drive the physical architecture: 1) monostatic or 2) bistatic. Monostatic radar transmits and receives using the same element(s) and antenna. Bistatic delegates transmit and receive to two separate antenna systems. Monostatic systems have a lower infrastructure cost but limit the signals that can be received. The monostatic radar requires a switch that determines of the antenna is in transmit or receive, meaning signals that could be received during the transmit function are not received. Therefore bistatic systems tend to be capable of tracking more objects per day.
Processing Facility
A radar does not require that the signals be completely processed at the same location as the radar. Within the receiver, there is some signal processing that occurs, but there is an option to pass the data to a larger data facility that can combine the data from each sensor to build a more complete or concise picture. Satellite communication systems such as the Deep Space Network and Air Force Satellite Command networks operate as a centralized processing facility. However, due to the sensitive nature of radars, most systems process on sight so that there are no additional line loss or signal decay.
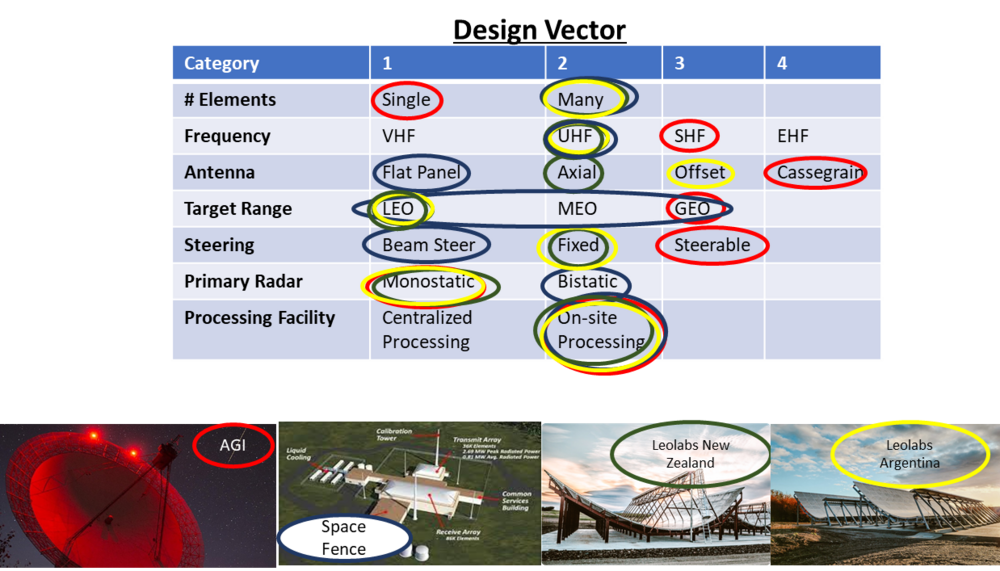
Design Vector
(References 8, 9, 12)
Each radar system listed above has a varying architecture directly related to the requirements and the cost allowed for each system. The AGI system is tasked with geosynchronous orbit (GEO) (and beyond) data processing, therefore, it prioritizes high data rate, high power, and high gain architectures. The United States Air Force's Space Fence is an exquisite system that utilizes flat panel arrays to track large amounts of objects and beam steer on select resident space objects (RSOs). Therefore, it does not use a parabolic antenna (prevents beam steering) and is bistatic.
Alignment with Company Strategic Drivers
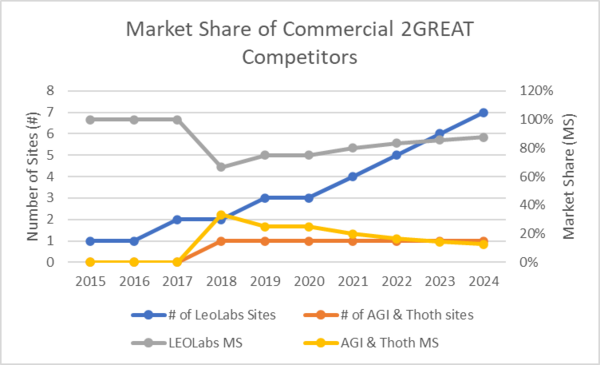
There is only one company, LeoLabs, that has developed a commercial radar system that has been deployed to multiple sites. Only one other commercial company entered the market, Ansys Government Initiative (AGI), but their market driver was primarily driven to create a better data analysis tool.
While each LeoLabs site has some variability, they all leverage a similar architecture. The system consists of a space fence type of architecture (phased array, stationary antenna), which trades accuracy and min RCS for many objects tracked per day. However, as LEO orbit has become more congested, systems with low RCS cannot differentiate between two CubeSats spaced close together and have less two-line element set (TLE) accuracy. The saturation of low-accuracy data is causing significant issues in the space catalog (e.g., misidentification based on poor orbit prediction). Additionally, with more congestion comes more debris or debris potential. This will drive a need for low RCS tracking to ensure full coverage from 1+ cm objects, which can threaten life and property.
| Strategic Driver | Alignment and Targets |
|---|---|
| To develop a commercially available ground-based SSA radar to achieve 30% of the commercial radar market share by 2035. | The 2GREAT Technology Roadmap will target the commercial market to compete with LeoLabs monopoly. The system will focus on providing a capability that capitalizes on a separate trade space to avoid a performance Nash Equilibrium. |
| To develop an antenna architecture that will outperform LeoLabs systems with a lower minimum RCS, providing accurate TLEs for objects not able to be tracked by LeoLabs. | The company will pick an architecture focusing on the ability to track small objects with an RCS as low as 1.0 cm2 for a longer period of time. |
| To develop commercially available signal processing Machine Learning models/algorithms that can decrease the minimum detectable power, Generating $250m profit by 2035. | The 2GREAT roadmap will decrease the Pe by 2e-19 Watts through the implementation of ML algorithms which can find low power patterned signals in the background noise. |
Positioning of Company vs. Competition
As mentioned above, LeoLabs dominates the commercial market of SSA radar systems and they do not publish their full systems capability. [References 8 & 9]
The selected strategic drivers' emphasize a design architecture that develops accurate two-line element sets (TLEs) through data collection and advanced signal processing. Two primary factors drive inaccuracies in TLEs:
1) Target Dwell Time: The two-line element is an orbit prediction based on the satellite's position and velocity. The longer a radar tracks an RSO, the more refined the orbital prediction is.
2) Radar Cross Section (RCS) Sensitivity: If a system has a high minimum detectable RCS, it will struggle to differentiate between two objects close together. This leads to mischaracterization or identification of RSOs in the catalog. The minimum RCS (as shown in the governing range equation) is driven by many architecture decisions and is driven by max power, low noise within the system, and antenna gain.
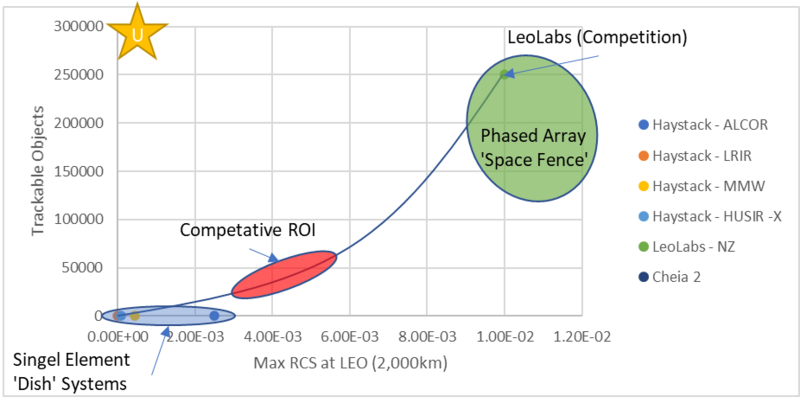
Traditionally, systems with a high target dwell time (steerable antennas) and low RCS detection capabilities are prioritized to track RSOs in MEO and GEO, where systems like LeoLabs cannot provide value. MIT Lincoln Labs' Haystack Observatory manages many systems like this and has extremely high RCS track capability. Their operations focus on high-fidelity data on RSO TLE and imaging of MEO and GEO RSOs, and therefore only track 1-2 objects daily. Comparing their performance with that of LeoLabs yields the following trade space Pareto plot:
Rather than compete with LeoLabs in the high number of objects tracked daily and at low accuracy, our strategic drivers are to take advantage of a different region along the Pareto front, balancing accuracy and dwell time. Rather than focus entirely on just 1-2 objects per day, like the exquisite MIT Lincoln Labs systems at Haystack, our system will develop better tracking algorithms so that dwell time can be decreased and more objects can be tracked per day.
Financial Model
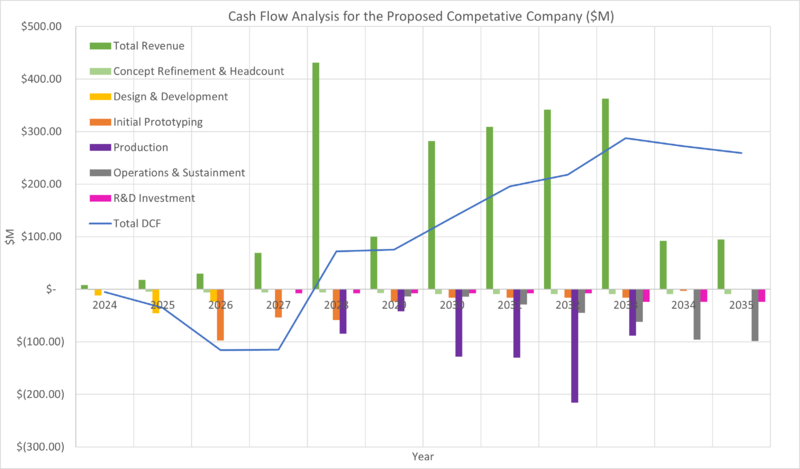
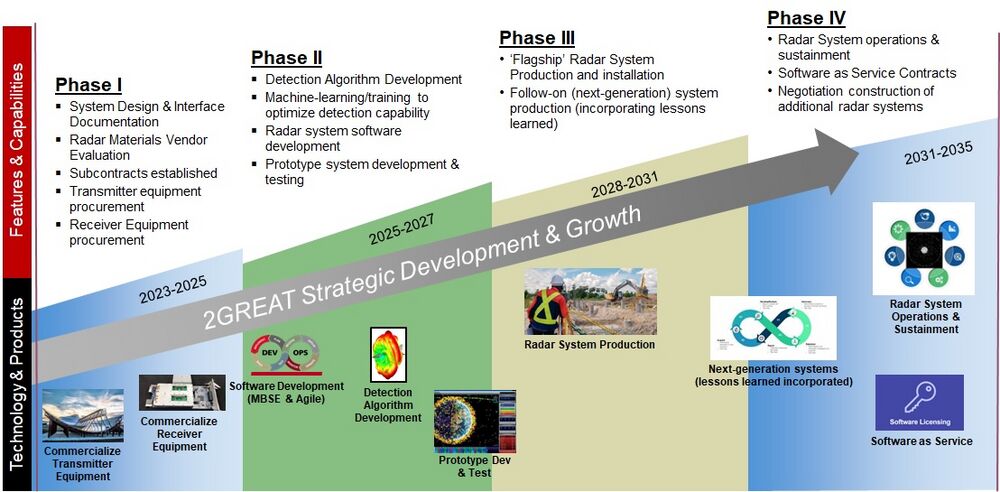
Based on LeoLabs current growth and prospects, 5 systems will need to be built to achieve 30% of the Market Share in only 12 years. This aggressive schedule requires continued funding for prototyping, concurrent activities, and continued investment in research and development. A financial model was made to represent costs across the Product Development Process (PDP). The model accounts for concurrent software and hardware iterations so that the prototype system is upgraded with each new version of the produced system. The long-term financial viability of the company requires other sources of revenue. These are Operations, sustainment, and software as a service.
To remain competitive versus other Government-run contractors, the company must be committed to providing up-to-date software and hardware at smaller margins. Developing early intellectual property and then providing standardized, cost-effective operations and sustainment will provide strong motivations to maintain operations and sustainment into the future. Secondly, the company will leverage data collected and operator feedback to refine detection and tracking algorithms to develop software as a service for other systems/governments, developing another source of income.
The financial model below reflects a discounted cash flow with a 10% discount rate. This rate was chosen to garner early venture capitalist investment.
(Data based on LeoLabs historical performance, see references 9-11)
Early in development, the company will need to focus on developing commercial and robust versions of transmitters and receivers. Government Research and development have already created the top-performing capabilities of radar equipment but at a high price. Commercial companies are poised to take advantage of these breakthroughs and develop less capable, but more cost-effective components. These costs represent an initial start, followed by a significant procurement effort in the second year. Secondly, the company will need to invest in meeting the other strategic object of developing capable ML tools that can detect low signals in the noise and the software that will package the system together. These costs are primarily labor-driven and are significantly lower than the hardware costs.
The prototyping costs align with the developmental cost and assume some risk in concurrent opportunities. The prototyping cost is based on the current LeoLabs cost for developing one site [Reference], spread over 3 years. The prototyping will also leverage procurement during design and development. Due to the aggressive schedule, these costs account for higher procurement costs associated with upgrades during the design and prototyping costs. This financial chart's schedule assumes 2 years of testing and evaluation followed by continued prototype upgrades and testing as new systems are procured and fielded. This accounts for upgrades and changes made as systems are developed and fielded.
Production costs are based on LeoLabs procurement costs and assume a high-profit margin (65% for the first unit and 50% for the remaining units) to repay the company for the high research, design, and development PDP.
The system will be designed with a 5 person team to conduct site operations and maintenance. This is a lean estimate but can be scaled up if needed. The sustainment costs also include a 5% annual modernization and sparing cost.
The company intends to continue to invest heavily in new systems, detection algorithms, and software to ensure long-term radar products and software as a service product success. LeoLabs has had a monopoly on the market, and the company will only remain relevant if it can react quickly to other market changes and demands. Aggressive product investment also allows for further market share growth.
There are four sources of revenue: Initial CAPEX from Venture Capital (trend based on LeoLabs), radar system sales, operations and sustainment services, and software as a service (based on LeoLabs contracts with the US Government).
In total, the discounted cash flow can be plotted based on each cost and expense as:
The chart shows a high return on investment, but negative overall performance in the out-years. Ideally, the company will continue fielding of systems and scale up the software as a service to additional companies and governments.
List of Demonstrator Projects
As ground-based radars are a relatively mature and developed technology, many of the latest demonstrator projects more on specific improvements to the technology rather than general success of technology. For example, many demonstrator projects are focused on detecting smaller objects, or, more formally, decreasing the minimum detectable radar cross section. Other focus areas include using machine learning to improve data and improving power amplifiers, to name a few. Below are some examples of recent demonstrator projects for technologies surrounding ground-based radar for space situational awareness.
Deep Space Advanced Radar Capability
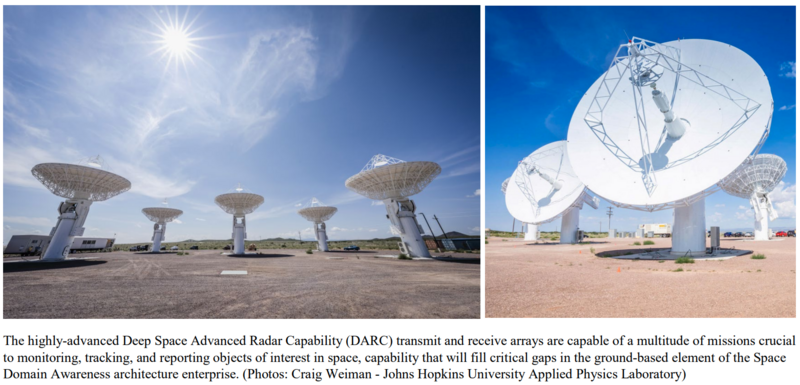
The United States Space Force's Space Systems Command recently had a successful test demonstration of their Deep Space Advanced Radar Capability (DARC). DARC will "use existing technologies to detect small space objects or satellites quickly and with highly precise orbital information."2 DARC will be used to better observe debris and other threats to satellites. Investment in such technology demonstrations matches our financial model plans to emphasize transmitter and receiver technologies.
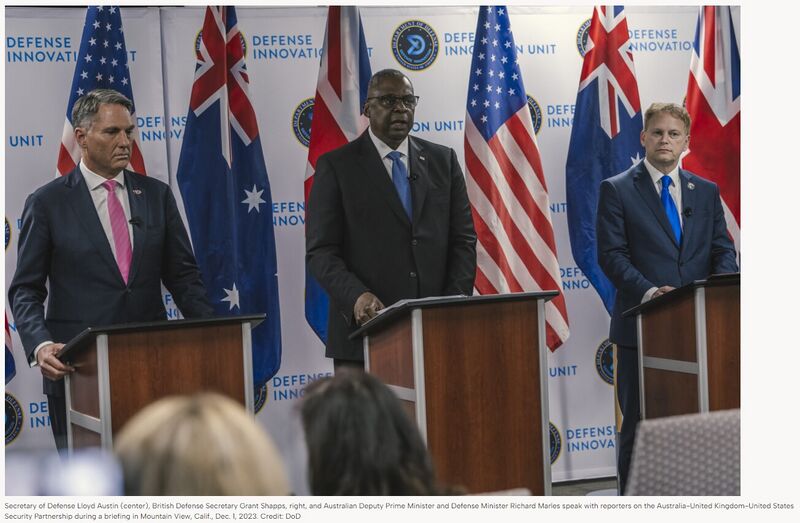
On December 1st, 2023, the United States, United Kingdom and Australia announced that they will host and operate DARC as part of the trilateral security partnership known as AUKUS.14
Condition-Based Health Management
Air Force Research Laboratory's Data Fusion & Neural Networks created Condition-Based Health Management (CBHM), a machine learning software that does "data-driven abnormality detection, characterization, and event tracking" to determine "unexpected abnormally correlated behavior for many thousands of inputs in real-time." 3 This matches the financial model plans to also invest in ML algorithms and software packages.
List of R&D Projects
2GREAT's proposed initial R&D projects to include the following:
| Project | Funding | Duration | End Goal / FOM Target |
|---|---|---|---|
| Commercialization of Ground-based Radar Transmit & Receive Equipment | $10 million | 12 months | Radar system commercial product line established, enabling 2GREAT to pursue business captures with countries with light-defense spending, as well as private U.S. space surveillance companies, to capture 30% of market share in GBR SSA industry. |
| Detection Algorithm development and training | $5 million | 36 months | Decrease in minimum detectable radar cross section (RCS) at maximum range from 10cm2 to 1 cm2. |
| Software development | $7 million | 36 months | Develop licensable tracking software and increase target processing capacity from 2000 to 7000 targets per day. |
Key Publications and Patents
Rowland, J., McKnight, D., Pino, B. P., Reihs, B., & Stevenson, M. A. (2021, September). A worldwide network of radars for space domain awareness in low earth orbit. In Advanced Maui Optical and Space Surveillance Technologies Conference (AMOS), Maui, HI, USA. https://amostech.com/TechnicalPapers/2021/Poster/Rowland.pdf
This paper outlines a plan to conduct space object detection and tracking for Low Earth Orbit using radar. It discusses the company's network of radars around the world, as well as how the company plans to use these radars to track objects. Finally, it characterizes and projects the performance of its systems. This paper is authored by one of the initial, main commercial space domain awareness companies, LeoLabs.
J. Ender, L. Leushacke, A. Brenner and H. Wilden, "Radar techniques for space situational awareness," 2011 12th International Radar Symposium (IRS), Leipzig, Germany, 2011, pp. 21-26. https://ieeexplore.ieee.org/stamp/stamp.jsp?tp=&arnumber=6042108
This paper discusses the advantages and disadvantages of using radar for space object detection and tracking. It discusses the university’s (FHR) contributions to radar-enabled space situational awareness. It has facilities that develop, test, and analyze radar techniques. This paper is useful in defining pros/cons of radar for space situational awareness as well as providing insight into methods of tracking improvement.
US1981884A: Systems for detecting objects by radio (1933) Inventors: Albert H Taylor, Leo C Young, Lawrence A Hyland
This patent outlines how to detect objects using radio signals. It includes drawings of system diagrams and plots of signals, and it shows how this technology could be used to locate an airplane as well as a ship. This is one of the earliest patents on radar-type technology, and it outlines generically how objects are detected.
US11592549: Calibrating radars and tracking space objects (2020)
Inventors: LeoLabs (Michael Nicolls, John Buonocore, Daniel Ceperley, Edward Lu, Steven Chen, Christopher Rosner, Matthew Stevenson, Craig Trumbull, Gerald Wong, Matthew Adelman, Inkwan Park, Nathan Griffith, Sanado Barolli)
This patent describes and shows how to calibrate 1D phased array radars, and it outlines the general construction of the radars. It discussed the composition of the radars and how parts should communicate with each other. It also discusses the general process flow of object detection to orbit determination. This patent is from one of the initial, main commercial providers of space object tracking using radar.
US10734182B2: Ultra-high efficiency single-beam and multi-beam inductive output tubes (2020)
Inventors: Georgia Tech Research Corporation (Walter Sessions, Henry Freund)
This patent describes an invention of using multi-beam splitting for amplification of an RF modulating signal. It includes drawings of the technology and descriptions of how it will amplify the signal and modulate it onto electron beams. Instead of klystrons, this proposes using several inductive output tubes in parallel. This patent relates directly to one of the 2GREAT figures of merit, as it focuses on improving the efficiency of output signal power.
Technology Strategy Statement
2GREAT’s target is to become a significant player in the commercial space-sensing radar industry by developing and producing cutting-edge ground-based radar systems to support space situational awareness (SSA). By 2035, 2GREAT seeks to build and operate at least five commercial systems for international clients, as well as license out software as a service. We will invest in R&D to establish a unique antenna architecture focusing on tracking small earth-orbiting objects with a radar cross section as low as 1.0 cm2 for a longer track history than the industry standard. We will also develop advanced signal processing and machine-learning algorithms that will decrease minimum detectable power required to achieve equivalent radar system detection performance. These technology pursuits will enable 2GREAT to achieve at least a 30% gain in market share in the industry, as well as generate a minimum of $250M in profit in the next 12 years.
References
[1] European Space Agency, Space Environment Statistics, Accessed 1 October 2023 https://www.esa.int/Space_Safety/Space_Debris/About_space_debris#:~:text=In%20more%20than%2060%20years,10%20cm%20in%20low%2DEarth
[2] “DARC Technology Demonstrator Test a Success.” 22 Dec. 2021, https://www.ssc.spaceforce.mil/Portals/3/DARC%20Technology%20Demonstration%20test%20a%20success.pdf.
[3] Stewart, Dennis. “Neural Networks for Space Situational Awareness - Success Story.” DVIDS, Air Force Research Laboratory, 3 Dec. 2020, www.dvidshub.net/video/774914/neural-networks-space-situational-awareness-success-story.
[4] Czerwinski, Mark et al, Development of the Haystack Ultrawideband Satellite Imaging Radar, Lincoln Laboratory Journal, Volume 21 Number 1, 2014.
[5] Murray, J et al, Haystack Ultra-Wideband Satellite Imaging Radar Measurements of the Orbital Debris Environment: 2018, NASA Orbital Debris Program Office, Technical Paper 2020-5006606
[6] Lewis, George, Space Surveillance Sensors: Haystack Auxiliary Radar (July 21, 2012), https://mostlymissiledefense.com/2012/07/21/space-surveillance-sensors-haystack-auxiliary-radar-july-21-2012, Accessed 30 October 2023
[7] Macdonald, Michael, et al., The HUSIR W-Band Transmitter, Lincoln Laboratory Journal, Volume 21 Number 1, 2014.
[8] LeoLabs Radars, https://leolabs.space/radars/, Accessed 01 October 2023
[9] Foust, Jeff. AGI establishes commercial deep space radar tracking system, SpaceNews, https://spacenews.com/agi-establishes-commercial-deep-space-radar-tracking-system/, accessed 27 October 2023
[10] Sheetz, Michael. Space debris tracker LeoLabs raises $65 million as satellites launch to orbit at unprecedented rate, CNBC News, https://www.cnbc.com/2021/06/03/space-debris-tracker-leolabs-raises-65-million.html, accessed 11 November 2023.
[11] Erwin, Sandra. DoD awards $15 million Defense Production Act contract to LeoLabs, Space News, https://spacenews.com/dod-awards-15-million-defense-production-act-contract-to-leolabs/, Accessed 11 November 2023.
[12] Rowland, J., McKnight, D., Pino, B. P., Reihs, B., & Stevenson, M. A. (2021, September). A worldwide network of radars for space domain awareness in low earth orbit. In Advanced Maui Optical and Space Surveillance Technologies Conference (AMOS), Maui, HI, USA. https://amostech.com/TechnicalPapers/2021/Poster/Rowland.pdf
[12] Lockheed Martin, Space Fence, https://www.lockheedmartin.com/en-us/products/space-fence.html, Accessed 01 November 2023.
[13] J. Ender, L. Leushacke, A. Brenner and H. Wilden, "Radar techniques for space situational awareness," 2011 12th International Radar Symposium (IRS), Leipzig, Germany, 2011, pp. 21-26. https://ieeexplore.ieee.org/stamp/stamp.jsp?tp=&arnumber=6042108
[14] AUKUS Security Pact to operate DARC, SpaceNews, https://spacenews.com/u-s-u-k-australia-sign-agreement-to-jointly-operate-deep-space-radar-network/, Accessed 04 December 2023.
