Mixed Reality (Augmented & Virtual)
Technology Roadmap Sections & Deliverables
First, the technology roadmap is given a clear and unique identifier:
- 2MRH - Mixed Reality Headset
This indicates that we are dealing with a “level 2” roadmap at the product level, where “level 1” would indicate a market level roadmap and “level 3” or “level 4” would indicate an individual technology roadmap of a specific component of the Mixed Reality product.
Roadmap Overview
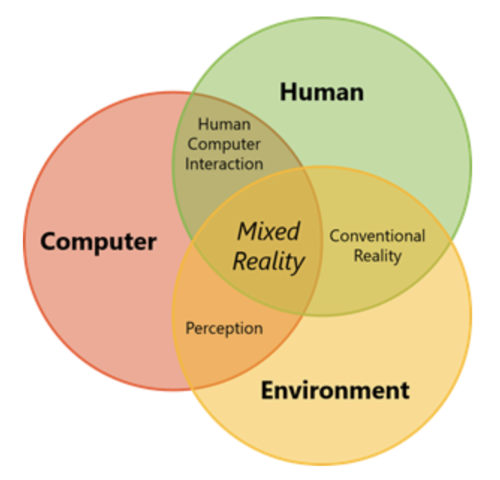
Augmented, virtual, and mixed realities reside on a continuum and blur the line between the actual world and the artificial world - both of which are currently perceived through human senses.
Figure 1 - Reality-Virtuality Continuum
Augmented reality devices enable digital elements to be added to a live representation of the real world. This could be as simple as adding virtual images onto the camera screen of a smartphone (as recently popularized by mobile applications Pokemon Go, Snapchat, et al). Virtual reality, which lies at the other end of the spectrum, seeks to create a completely virtual and immersive environment for the user. Whereas augmented reality incorporates digital elements onto a live model of the real world, virtual reality seeks to exclude the real world altogether and transport the user to a new realm through complete telepresence.
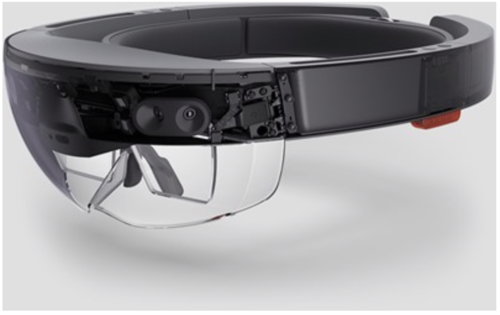
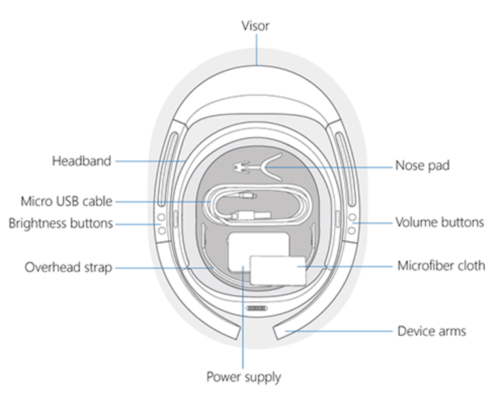
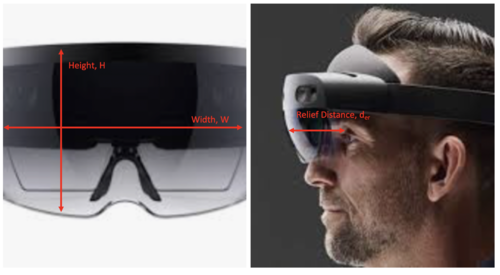
Mixed reality, on the other hand, incorporates both of these ideas to create a hybrid experience where the user can interact with both the real and virtual world. Mixed reality devices can take many forms. For the purposes of this technology roadmap we've elected to narrow our focus to wearable headgear (heads up) devices. These devices are typically fashioned with visual displays and tracking technology that allow six degrees of freedom (forward/backward, up/down, left/right, pitch, yaw, roll) and immersive experiences. The elements of form for an example mixed reality product, the Microsoft HoloLens (1st generation), are depicted in the figures below.
Figure 2 - Mixed Reality Example (Microsoft Hololens)
In terms of functional taxonomy, this technology is primarily intended to exchange information. The design of these devices today allow for information to be exchanged through two of the five human perceptual systems: (1) visual system & (2) auditory system. The combination of hardware, software, and informational/environmental inputs allow mixed reality users to interact and anchor virtual objects to the real world environment.
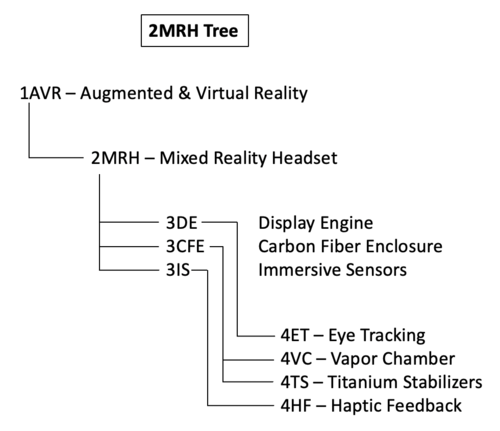
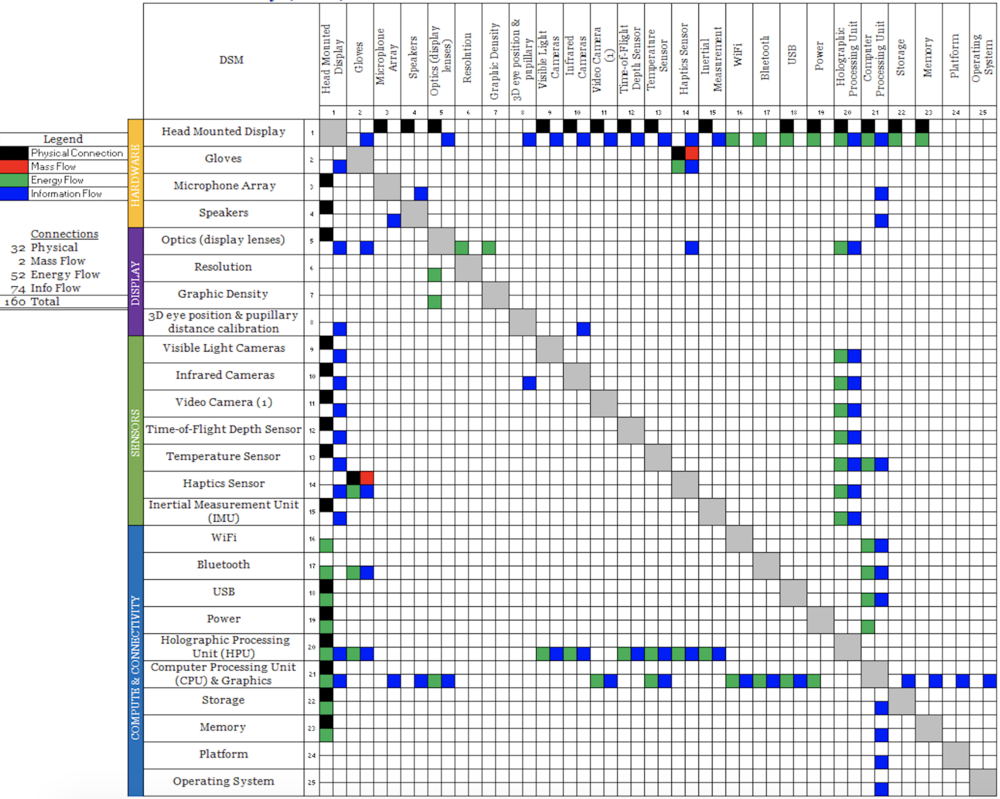
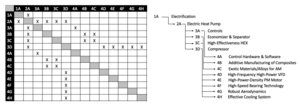
The 2-MRH tree that we can extract from the DSM below shows us that the Mixed Reality Headset (2MRH) is part of a larger company-wide initiative on Augmented and Virtual Reality (1AVR), and that it requires the following key enabling technologies at the subsystem level: 3ED Display Engine, 3CFE Carbon Fiber Enclosure, and 3IS Immersive Sensors. In turn, these require enabling technologies at level 4, the technology component level: 4VC vapor chamber components in the back of the processing units, 4ET eye tracking technology improvements, 4TS titanium stabilizers and spacers that make the headset more comfortable and stable and 4HF haptic feedback sensors (e.g., gloves or control panels that exchange tactile information).
Design Structure Matrix (DSM) Allocation
Figure 3 - Mixed Reality DSM
The DSM above shows us that mixed reality technology requires the following key enabling technologies at the subsystem level: Holographic Processing Units (HPU), Computer Processing Units (CPU) / advanced computing capabilities, sensors (e.g. this includes various optic sensors, haptic sensors, etc), and connectivity (e.g. WiFi, Bluetooth, etc).
Roadmap Model using Object-Process-Methodology (OPM)
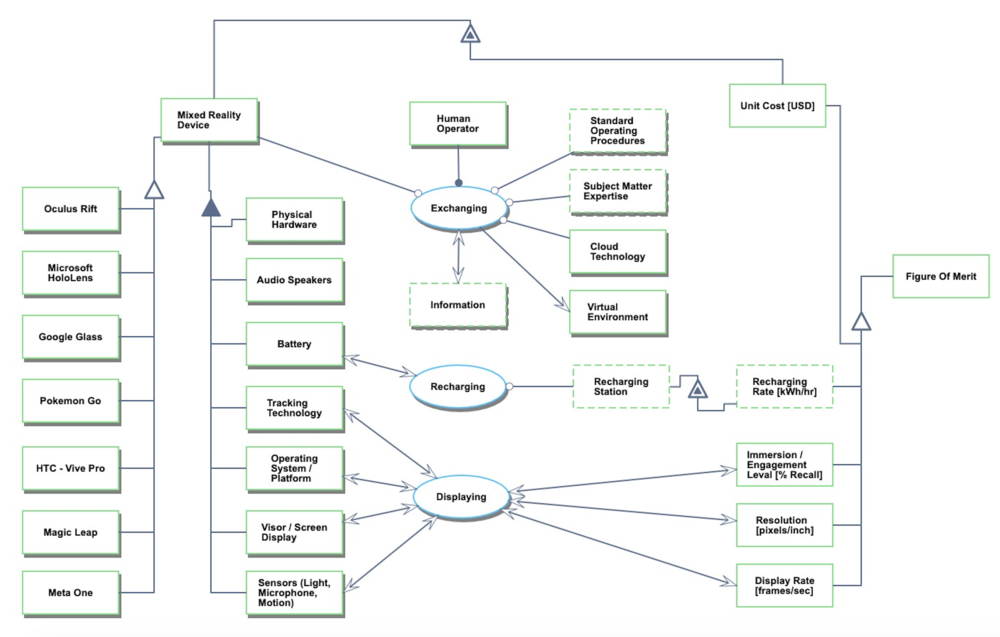
We provide an Object-Process-Diagram (OPD) of the augmented, virtual, and mixed reality roadmap in Figure 3 below. This diagram captures the main object of the roadmap, mixed reality device, its various instances including main competitors, its decomposition into subsystems (hardware, battery, operating system, etc), its characterization by Figures of Merit (FOMs) as well as the main processes (Exchanging, Recharging, and Displaying).
Figure 4 - Mixed Reality OPD
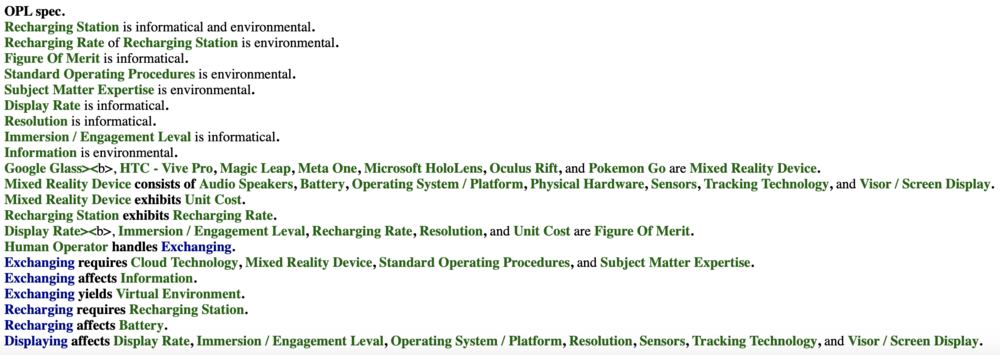
An Object-Process-Language (OPL) description of the roadmap scope is auto-generated and given below. It reflects the same content as the previous figure, but in a formal natural language.
Figure 5 - Mixed Reality OPL
Figures of Merit (FOM) Definition
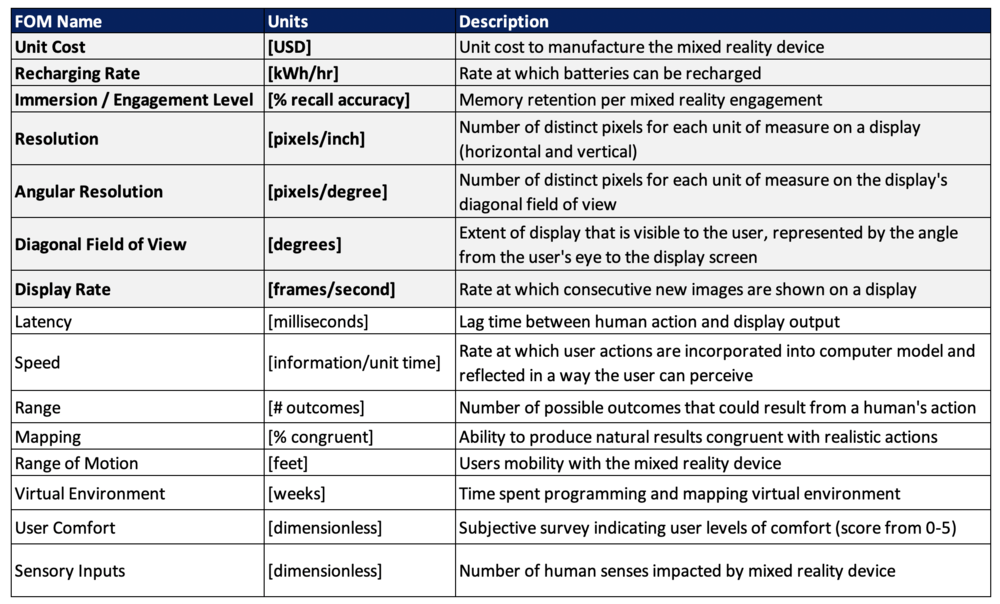
The table below shows a list of FOMs by which mixed reality devices can be assessed. Many of the FOMs shown in bold were included on the OPD; the others will follow as this technology roadmap is developed. Several of these are similar to the FOMs that are used to compare traditional motion pictures, modern gaming consoles, and other technologies that aim to exchange information.
It's worth noting that several of the FOMs are requisites to the mixed reality Immersion / Engagement Level, one of the primary FOMs. In this way, these can be thought of as a FOM chain. Latency and Mapping, for example, contribute greatly to the overall memory retention per use of the mixed reality device. This is true for many of the FOMs listed below.
Figure 6 - Mixed Reality Figures of Merit
Besides defining what the FOMs are, this section of the roadmap also contains the FOM trends over time dFOM/dt as well as some of the key governing equations that underpin the technology. These governing equations can be derived from physics (or chemistry, biology, etc) or they can be empirically derived from a multivariate regression model. The specific governing equations for mixed reality technology will be updated as the roadmap progresses.
Display Rate Trajectory
The human visual system can typically perceive images individually at a rate up to 10-12 images per second; anything beyond that is perceived as motion to the human eye. This is the starting point for humans to perceive motion pictures, and it began in earnest in 1891 with the invention of the kinetoscope, the predecessor to the modern picture projector. Although the primary comparison for this FOM resides in the film industry, it is not the only use. The gaming industry, theme parks, and now mixed reality technology all have a stake in optimizing this FOM for performance.
To create a convincing virtual experience, experts claim that 20-30 frames per second is required. That said, there is a long way to go for display rates to truly make the digital world indistinguishable from the real world. There will come a point when the display frame rate for mixed reality devices reaches the temporal and visual limit for human beings. In this case, humans will be unable to distinguish between the virtual environment and the real world. Some editorials refer to this as the “Holodeck Turing Test.”
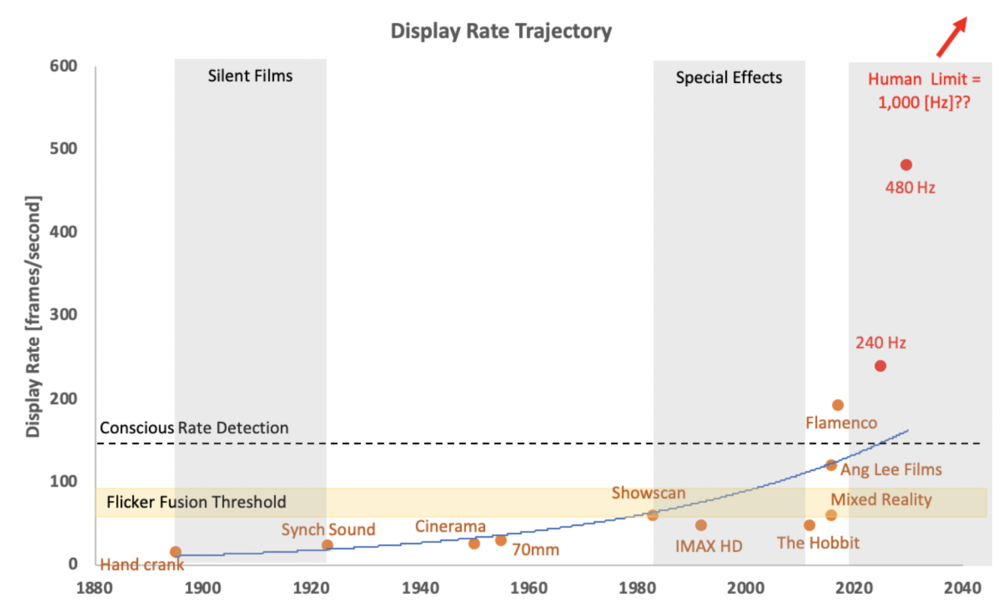
It's worth noting the distinction between the Conscious Detection Rate and absolute human limits of perceiving display rates. This is called out in the technology roadmap because even though humans may no longer be able to consciously detect the frame rate above a certain point, there remains motion blurring that designers intentionally add to image frames to prevent stroboscopic effects. Because this added blur can also cause nausea and motion sickness for the user, Mixed Reality devices in the future must discover means to both remove blur and the stroboscopic effects. The only way to do this is through increasing frame rates, particularly above the Conscious Detection Rate. This provides an interesting challenge for our company's future R&D projects (see R&D section below) because increasing display rate reveals an interesting trade space between FOMs related to the display engine. (https://forums.blurbusters.com/viewtopic.php?f=20&t=3858)
The rate of improvement for this Figure of Merit is shown in the chart below. Given the trajectory, the technology appears to be in the “Takeoff” stage of maturity (as it relates to the S-Curve). This is further supported by the gulf between the current Figure of Merit value (~120-192 frames/second) and the theoretical limit as we understand it today (~1,000 frames per second). It is reasonable to expect “Rapid Progress” in the near future because the interdependent technologies that have historically limited growth (projection equipment, resolution technology, 3D motion pictures, etc.) are undergoing their own technology takeoff.
Figure 7 - Display Rate Trajectory
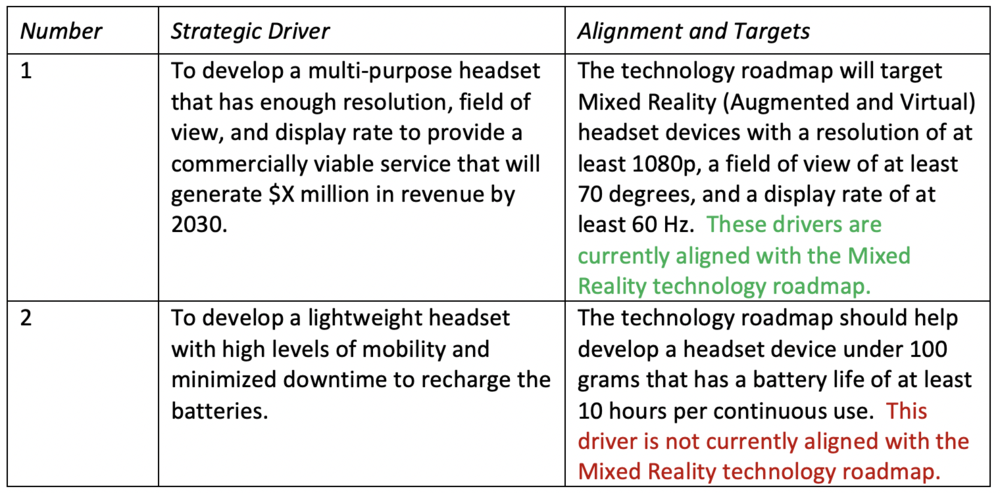
Alignment with Company Strategic Drivers
Figure 8 - Mixed Reality Strategic Drivers & Alignment
Positioning: Company versus Competition FOM Charts
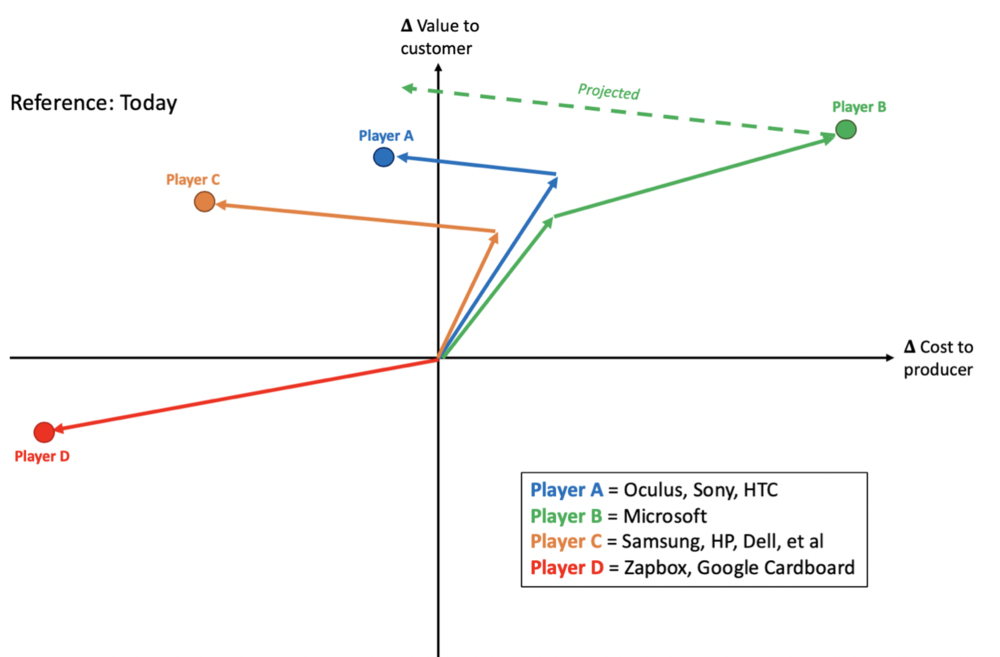
A summary of the overall AR, VR, and MR competitive positioning is depicted below in the Vector Chart. Player A represents the early VR players who got control of the market early and have not had to make salient strategic moves given the lack of competition in the early days of the marketplace. Player B is meant to represent Microsoft specifically and align with their recent strategies. Player C comprise the Low Cost Providers who have recently cropped up in an attempt to claim market share. Player C (like Player A) began as a fast follower but quickly shifted to focus on a low cost option. Finally, Player D presents the extremity of a Low Cost Provider. These companies truly sacrificed FOMs for the sake of low cost. Although their hardware is made largely from cardboard and their products lack the overall utility of other players, they have been able to provide the semblance of a virtual experience for as low as $30/unit.
Figure 9 - Mixed Reality (Augmented & Virtual) Vector Chart
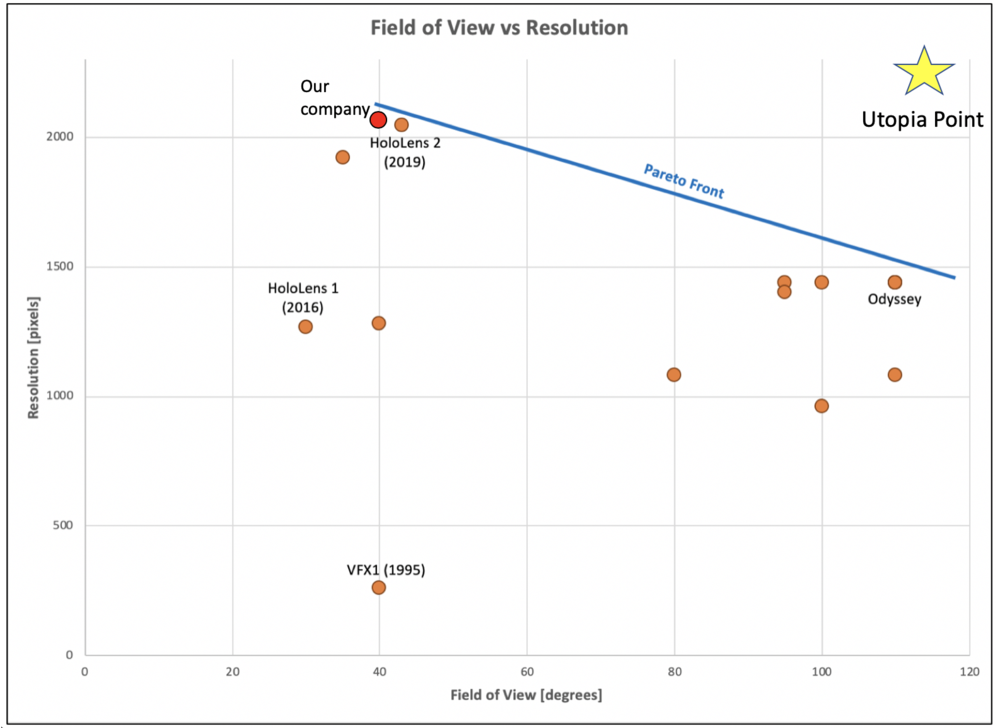
The key FOM trade space for AR, VR, and MR revolves around display resolution and field of view (FOV). The associated FOM chart is shown below in Figure 10. The governing principle behind this is simple. As the FOV is stretched by the width and height of the display, the density of pixels are reduced. In this example, the reference case for resolution (pixel density) is said to be the ability to read 8-point font on a website. The HoloLens 2 capabilities currently align with this reference case.
Figure 10 - Field of View vs Resolution FOM Chart
As Figure 10 illustrates, Microsoft are currently pushing the Pareto Front boundaries in terms of resolution and FOV. The 1995 VFX1 product is also included in this FOM chart to illustrate where the Pareto Frontier existed 25 years ago. The leap from HoloLens Gen 1 to HoloLens Gen 2 is quite impressive and clearly separates HoloLens as the top provider of display resolution.
This particular trade space is critical because at higher resolution and pixel density devices also incur a draw on power and processing capability. Subsequently, a heavier unit may be required to accommodate these FOM tradeoffs, which may be detrimental to the overall user experience and customer satisfaction.
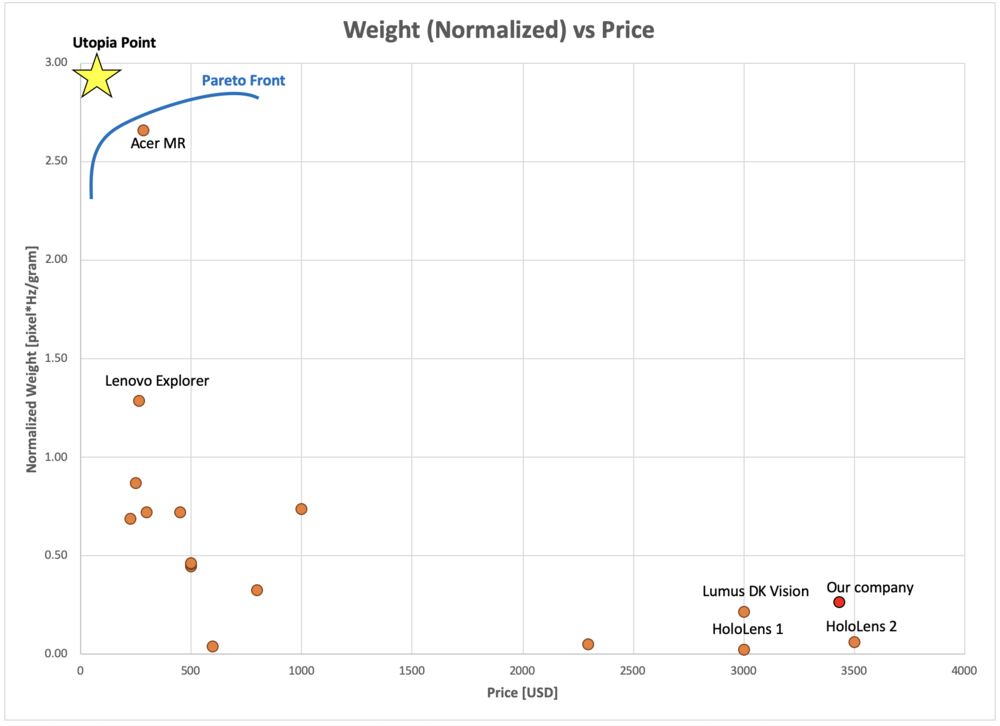
The FOM chart for weight and price is shown below in Figure 11. In this case, Microsoft has immense incentive to develop technology breakthroughs that enable the HoloLens to retain its superior display FOMs while doing so in a more light-weight and compact package. Several of Microsoft’s competitors have already attacked this aspect of the user experience and seek to provide a light weight, low cost product.
Note: In this case, the direct weight vs price graph did not yield a clear Pareto Front and was therefore not as useful for the technology roadmap. Instead, the weight was normalized by key performance FOMs to derive a more clear Pareto Front for our company to consider. Specifically, the weight was normalized by display resolution and frame rate - (resolution*frame rate)/weight. This normalized FOM provides a more clear Pareto Front in Figure 11 and demonstrates which Mixed Reality products on the market achieve high display performance relative to the unit weight.
Figure 11 - Weight vs Price FOM Chart
Technical Model: Morphological Matrix and Tradespace
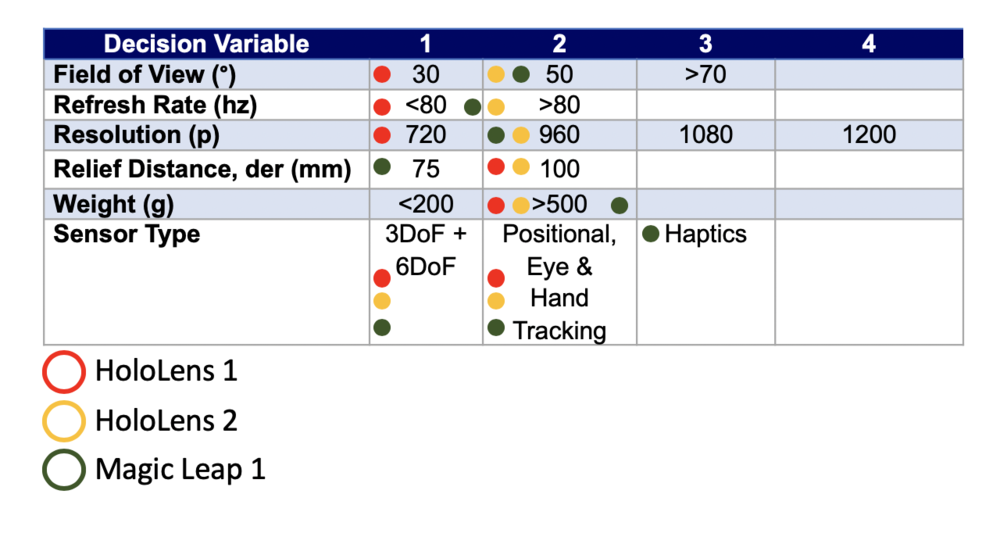
In order to assess the feasibility of technical (and financial) targets on the Mixed Reality roadmap it is necessary to develop a technical model. The purpose of such a model is to explore the design tradespace and establish what are the active constraints in the system. The first step can be to establish a morphological matrix that shows the main technology selection alternatives that exist at the first level of decomposition, see the figure below.
Figure 12 - Mixed Reality Morphological Matrix
To begin the detailed technology analysis of AR, VR, and MR devices; we first define the key system aspects.
Mixed Reality (Augmented & Virtual) Analysis:
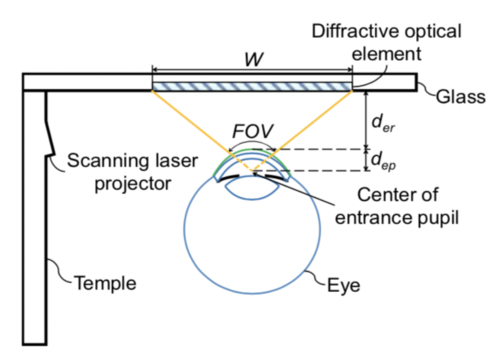
- Fixed Parameter: Anatomy of the eye (distance from pupil to the tear, dep [mm])
- Design variables: Display width, W [mm]; display height, H [mm]; relief distance, der [mm]; horizontal and vertical resolution, Nh & Nv [pixels])
- FOMs: Diagonal Field of view, FOV_D [degrees]; angular resolution, AR [pixel/degree]
An illustration of the human eye is shown below in Figure 13 to help clarify these parameters, variables, and FOMs.
Figure 13 - Illustration of the Eye
By breaking the Mixed Reality products down into these characteristics, we are able to provide a solid basis for the technology roadmap and better understand potential use cases, performance benchmarking, and targets for future improvement.
To provide a quantitative example for the analysis, the characteristics of the Microsoft HoloLens are shown below in Figure 14. It should be noted that the values for the display dimensions and relief distance were estimated based on offset competitor data; Microsoft has not publicized the specific dimensions of the HoloLens display. This comparison to the HoloLens will serve as a useful proxy to our company's Mixed Reality device.
Figure 14 - Characteristics of the Microsoft HoloLens Gen 2
Now, we know that users will ultimately need to perceive images on the display smaller than the equivalent of 8-point font (reference case). As such, we can simulate the changes required to the HoloLens baseline characteristics to read words in 6-point font (equivalent to 55 pixels/degree for the purposes of this analysis). 55 pixels/degree is currently available on the market, so it is a realistic simulation to understand what Microsoft can do technically to achieve this performance improvement.
The following governing equations of retinal display are used to conduct the analysis.
In short, the following technical changes will result in a higher Angular Resolution (pixel density). This is based on the aforementioned governing equations for retinal displays. Note: the dep parameter (distance from the display to the outer eye surface) is a fixed parameter based on the anatomy of the human eye; for this analysis dep will always equal 3.05 mm.
- Decrease width
- Decrease height
- Increase relief distance
- Increase resolution
Next, we modify these variables one at a time until we can meet the new target for pixel density (55 pixels/degree).
First, we could reduce the width of the display from 100 mm to 26 mm (75% decrease). This may be feasible with significant increases in technology, especially for the MR devices that use a single wide display to begin with. A shift of this magnitude would result in MR displays looking more like traditional reading glasses as opposed to the bulky displays currently on the market.
Another technical change to increase pixel density is to increase the relief distance to 160 mm (60% increase). While technically feasible, increasing this parameter too much may detrimentally impact the overall level of immersion and user experience. If the display itself is too far away from the user, the MR hardware design may be impractical and overly bulky.
Finally, a 61% increase in Horizontal Resolution or a 159% increase in Vertical Resolution would result in a pixel density of 55 pixels per degree. This can certainly be achieved from a technical perspective, but there are compounding effects of such a change. The computer and holographic processors, for example, would need to significantly increase to achieve this level of resolution. This, in turn, would have an impact on battery life and unit price.
In practice, Microsoft will probably choose a combination of these technology improvements to realize an increase in AR performance. They have already shown with the improvements from HoloLens Gen 1 to HoloLens Gen 2 that they are capability of sustaining the levels of resolution while increasing the FOV.
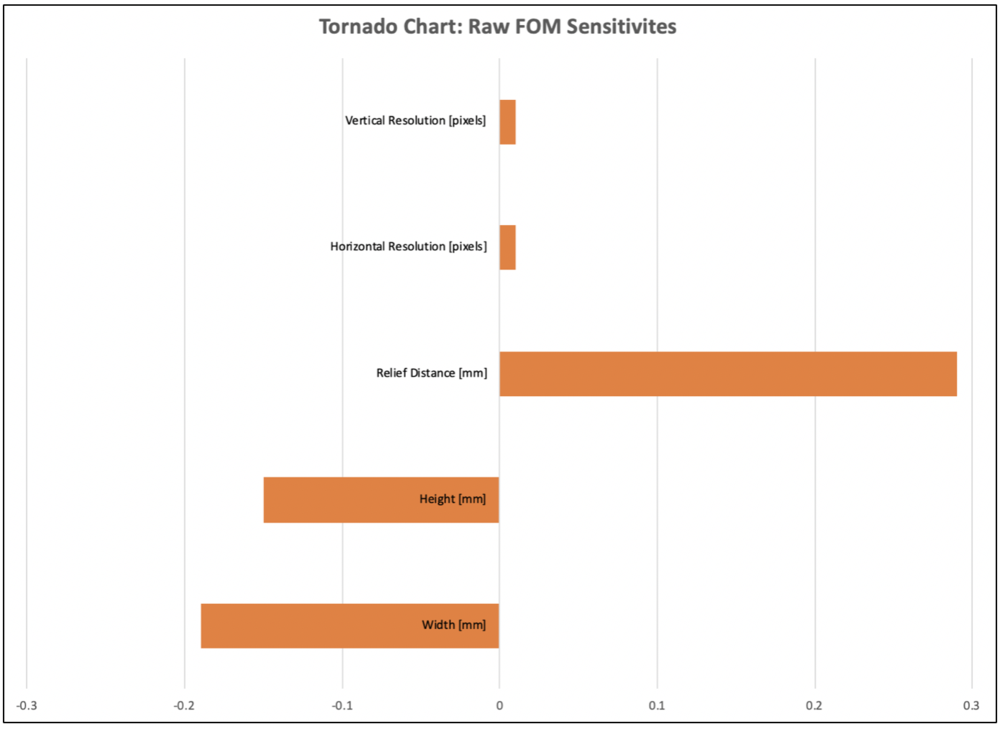
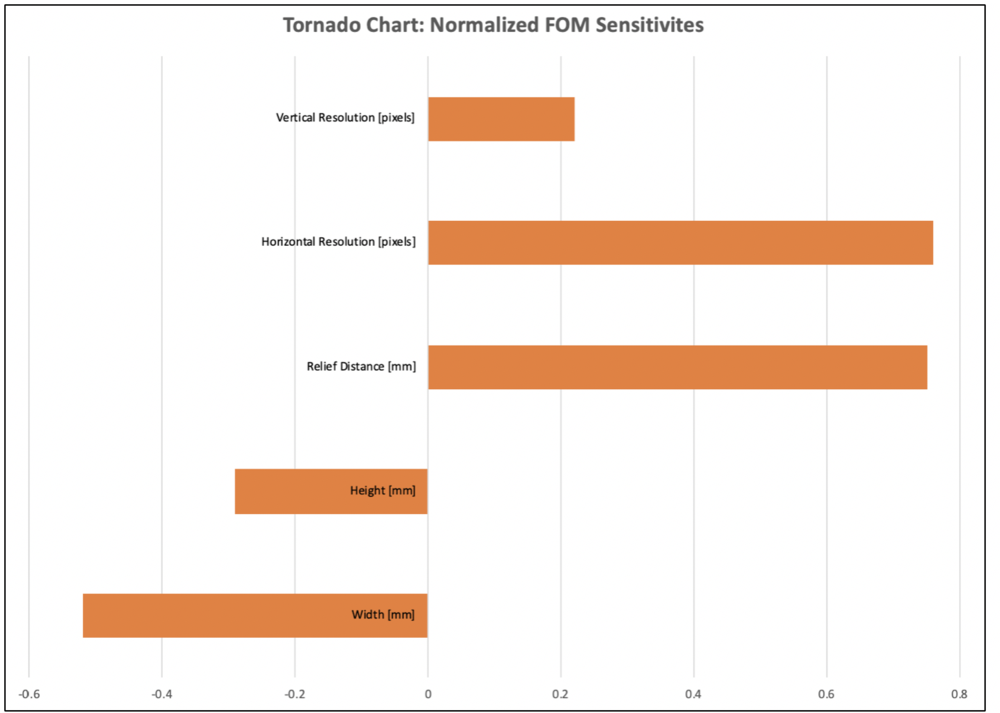
The next step of the technology analysis tests the sensitivities of our FOMs to changes in the design variables. This was done in two stages. First, the raw sensitivities were obtained. This illustrates how the AR FOM changes with an increase or decrease of one unit of the selected design variable. Next, the sensitivities were normalized so we are able to compare FOM impacts at a constant relative step size. The associated tornado charts are found below in Figures 14 and 15.
- Width
- Raw: Decreasing 1 unit of W = 0.19 degree/pixel increase in AR
- Normalized: 1% decrease in W = 0.52% increase in AR
- Height
- Raw: Decreasing 1 unit of H = 0.15 degree/pixel increase in AR
- Normalized: 1% decrease in H = 0.29% increase in AR
- Relief Distance
- Raw: Increasing 1 unit of relief distance = 0.29 degree/pixel increase in AR
- Normalized: 1% increase in H = 0.75% increase in AR
- Horizontal Resolution
- Raw: Increasing 1 unit of H = 0.01 degree/pixel increase in AR
- Normalized: 1% increase in H = 0.76% increase in AR
- Vertical Resolution
- Raw: Increase 1 unit of H = 0.01 degree/pixel increase in AR
- Normalized: 1% increase in H = 0.22% increase in AR
Figure 15 - FOM Sensitivities (Raw)
Figure 16 - FOM Sensitivities (Normalized)
Overall, the results of the normalized FOM sensitive tell us that increasing relief distance and horizontal resolution will have the highest impact on the angular resolution FOM. Conversely, decreasing the display width will have the greatest increase in angular resolution. Given that these are the most sensitive variables in our technology model, future R&D projects and innovation efforts should focus on these three factors as they would present opportunities to get the most bang for our buck.
Financial Model : Technology Value (𝛥NPV)
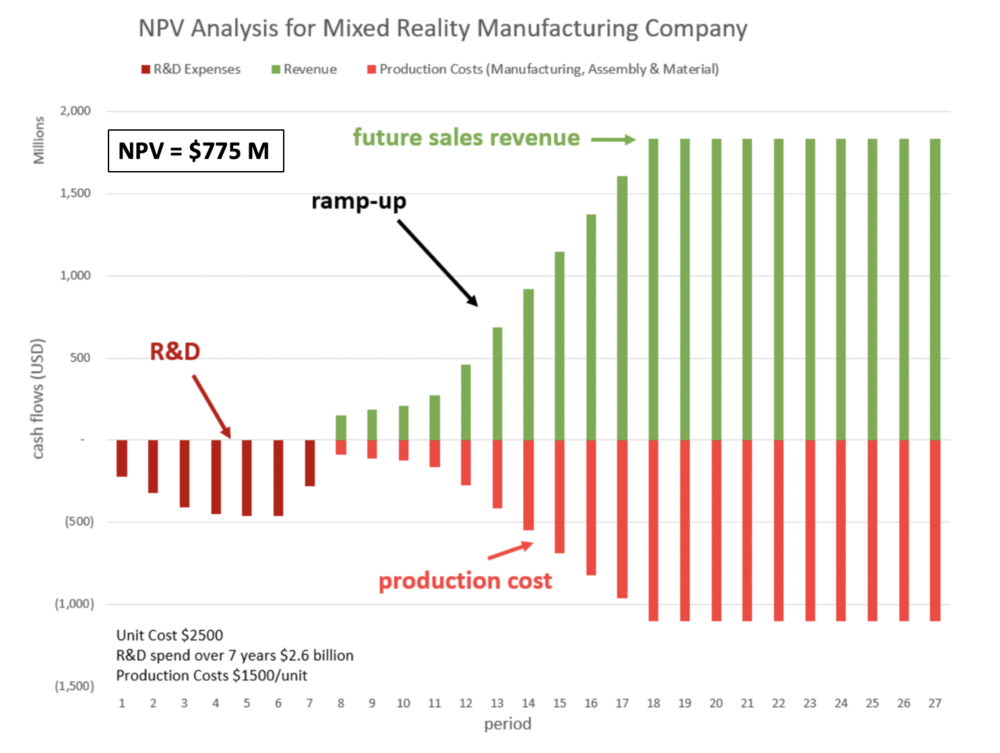
The figure below contains an NPV analysis underlying the Mixed Reality roadmap. It shows the production cost of device development, which includes the R&D expenditures as negative numbers. A ramp up-period of 5-7 years is planned with a flat revenue plateau and a total program duration of 27 years.
Figure 17 - Mixed Reality Financial Model
List of R&T/R&D Projects and Prototypes
The overarching goals of our R&D projects are based on three key FOMs: (1) Levels of Immersion / Engagement, (2) User Comfort, and (3) Value-to-Price Ratio. These factors are evident in the 2-MRH technology roadmap tree, where we've extracted elements of each to guide our component level technology roadmaps related to Mixed Reality. Once these three FOMs have reached a certain threshold, our company will be ready to launch its commercial Mixed Reality product.
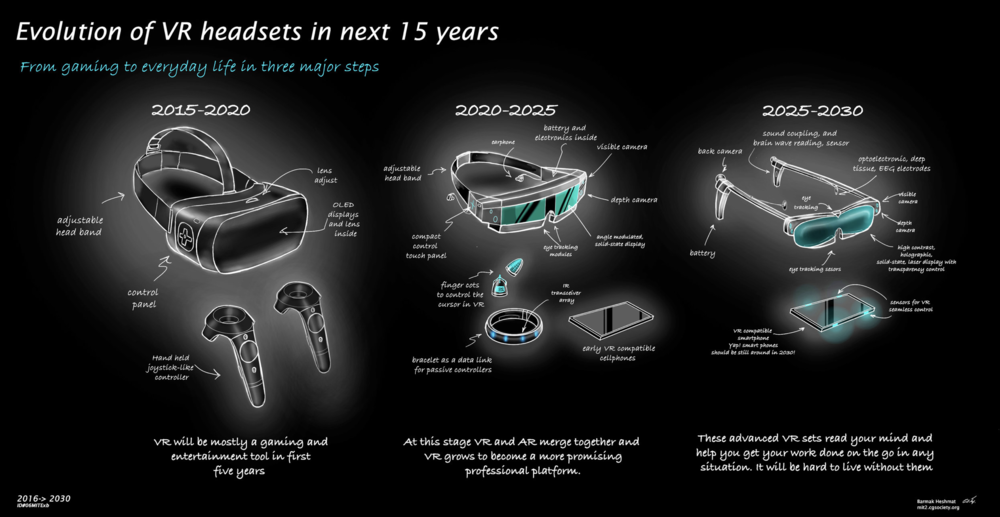
In order to select and prioritize R&D (R&T) projects to achieve these strategic ambitions, we recommend using the technical and financial models developed as part of the roadmap to rank-order projects based on an objective set of criteria and analysis. The figure below illustrates one high level vision of how technical models can be used to make technology project selections, e.g based on the previously stated 2030 target performance. This representation for future Mixed Reality devices is courtesy of Barmak Heshmat; MIT Media Lab.
Figure 17 - Sample Mixed Reality Roadmap
Figure 17 embodies the three key FOMs mentioned above. For starters, innovations to the visual display will add to the user experience and overall immersion. Achieving our desired field of view and angular resolution FOMs for the Mixed Reality display, given its emphasis in our technical model and normalized sensitivity results, is the highest priority R&D project. In addition, the reduced size of the headset across the iterations and improved hardware lead to high levels of comfort for commercial users. The inclusion of haptic sensors also adds to the overall user immersion and levels of engagement. Ultimately, our aim is for these proposed rank-order R&D projects to realize technology improvements and increase value to the customers at today's equivalent price or lower.
In summary, the prioritized list of R&D projects is as follows:
1. New display engine (improved angular resolution & field of view)
2. Improved carbon fiber enclosure and reduced hardware size
3. Added haptic feedback
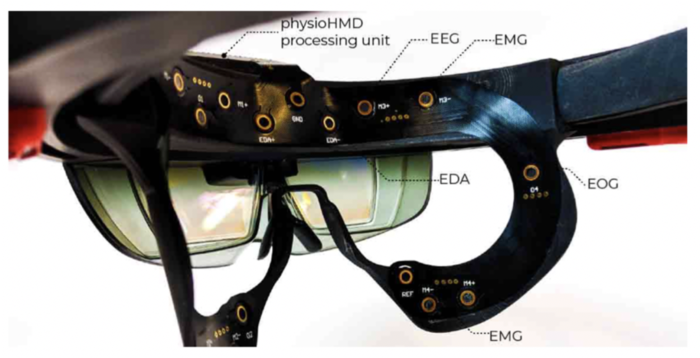
At the end of the day, the emphasis for our products is on the users. For our R&D projects to be successful, we must focus on the people wearing the Mixed Reality headsets. To supplement the three R&D projects mentioned above, we will also be introducing a new method to gather data as test users interact with our prototypes. This technology, which is courtesy of the MIT Media Lab (https://www.media.mit.edu/projects/physiohmd/overview/; Bernal et al.), will allow us to understand users in a natural and instinctive way. This will provide useful information and feedback as we test the effectiveness of the R&D projects above.
The particular device being used in this case, PhysioHMD, incorporates bio-potential input signals. The position of the device on the face of the user permits the collection of facial expressions as well as data from the neocortex and frontal cortex of the human brain. This data is gathered from the bio-facial sensors included as part of the PhysioHMD architecture. An example of the PhysioHMD sensors is shown in Figure 18.
Figure 18 - View of the PhysioHMD Hardware
Specifically, the sensors are able to measure the user’s cognitive state and level of arousal in real-time through the use of an electrocardiogram (ECG) and Electrodermal Activity (EDA). In addition, Electrooculography (EOG) and Electroencephalography (EEG) collect data related to the user’s attentional resources, and Electromyography (EMG) provide information on the facial expressions that result from positive or negative experiences. The bio-potential input signals are then fed into the PhysioHMD software, which employs a five-layer convolutional neural network to classify the data and recognize patterns. These bio-facial sensors, coupled with the machine learning package, are the critical attributes of the PhysioHMD that can provide benefit to our R&D projects. This new method of data collection will allow our R&D researchers to track the expressions, feelings, and stresses of the PhysioHMD Mixed Reality user - ultimately allowing us to better run our R&D programs and ensure user immersion is the primary focus.
Keys Publications, Presentations and Patents
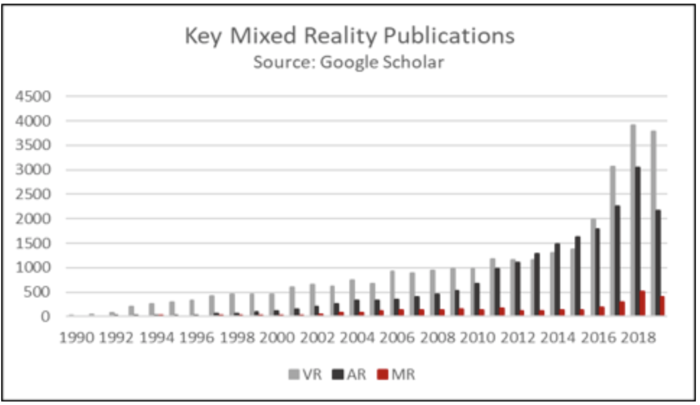
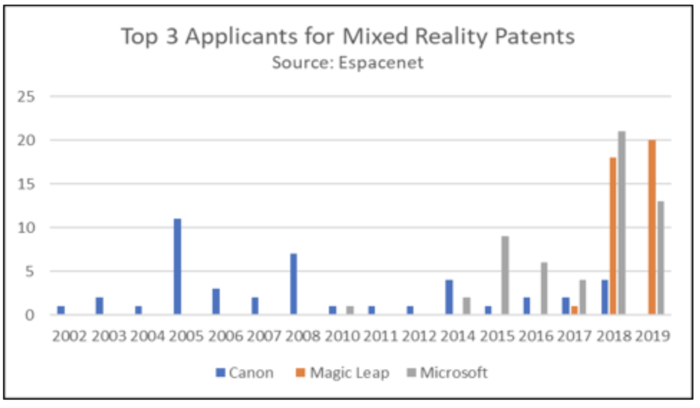
This technology roadmap includes information on literature trends, papers published at key conferences, and patents. Summaries of the publication types and companies involved are found below.
Figure 19 - Numeric Count of AR, VR, MR Publications
Figure 20 - Top MR Patent Applicants
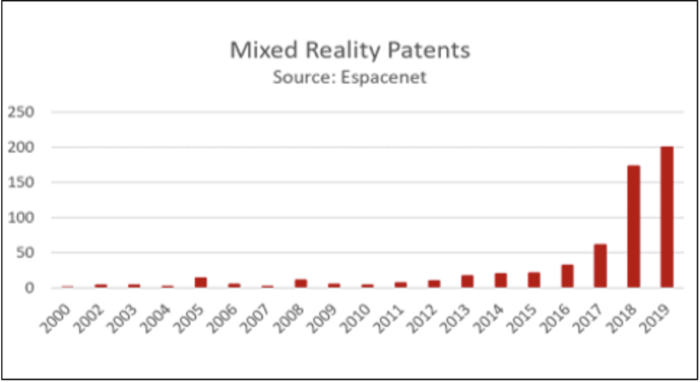
Figure 21 - Numeric Count of MR Patents
Technology Strategy Statement
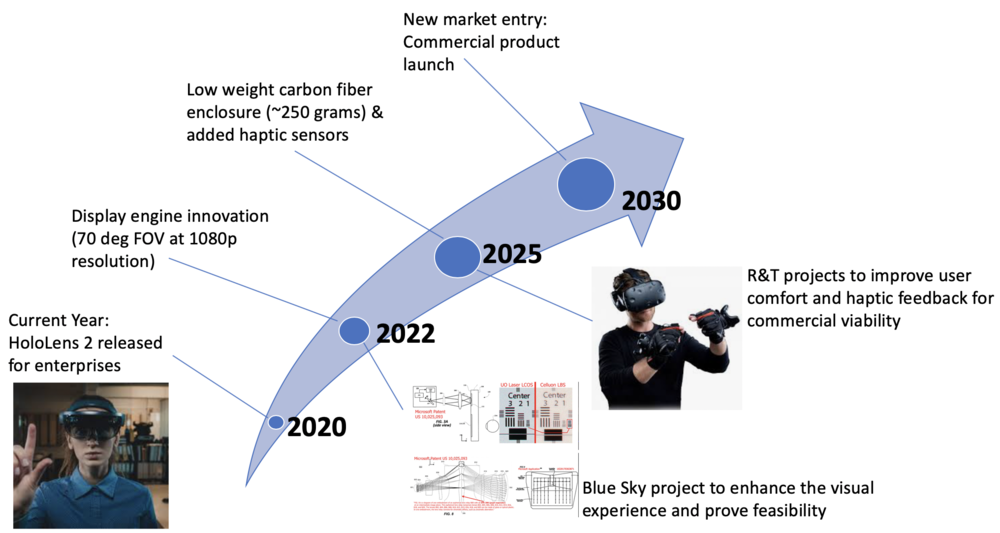
Our target is to develop a mixed reality device with an entry into the consumer market of 2030 with a target of a head mounted device of less than 250 g, field of view of 70 degree at high resolutions, and a haptic sensor. To achieve the targets we will invest in R&D projects that (1) improves field of view and angular resolution to enhance the immersive experience of holograms, (2) reduces the overall weight of the device to enable a more comfortable user experience, and (3) increases the amount of sensor interaction capabilities. We will first launch a Blue Sky research project to advance the Mixed Reality display engine and prove basic feasibility by 2022. Once the ability to provide a 70 degree FOV at high resolution is achieved, the project will move through the phases of R&D to reach our ultimate success of commercial success by 2030. These are enabling technologies to reach our 2030 technical and business targets.
Figure 22 - Mixed Reality Technology Strategy Arrow Chart
Roadmap Maturity Assessment
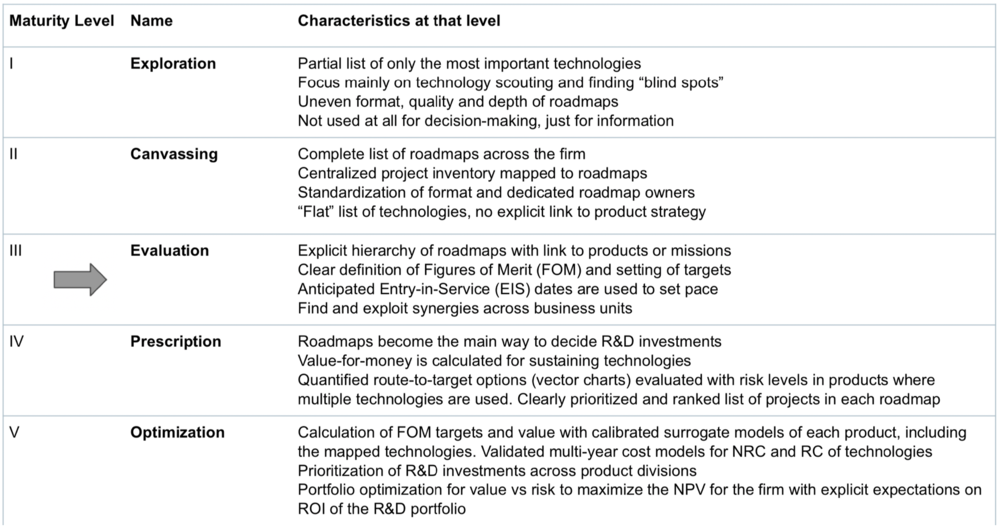
As per Figure 23 below, our company's technology roadmap for Mixed Reality is considered to be at Level 3 maturity (Evaluation).
Figure 23 - Mixed Reality Technology Roadmap Maturity Assessment
References
1. Bernal, G., Yang, T., Jain, A., & Maes, P. (n.d.). PhysioHMD: A Conformable, Modular Toolkit for Collecting Physiological Data from Head-Mounted Displays. PhysioHMD: A Conformable, Modular Toolkit for Collecting Physiological Data from Head-Mounted Displays(pp. 160–167). https://dam-prod.media.mit.edu/x/2018/10/26/p160-bernal.pdf.

