Orbital Launch Vehicles Roadmap
Executive Summary
Roadmap Overview
Orbital launch vehicles (LV) are internally propelled vehicles used to carry payloads from Earth’s surface to Earth orbit or beyond. The payloads vary from case to case but they can be satellites, spacecraft or interplanetary probes. Today, Orbital Launch Vehicles are powered by rocket engines that generate large amounts of thrust even in a vacuum by means of expelling hot gas through a nozzle. The primary function of rocket engines is to convert chemical energy to kinetic energy. There are several different styles of rocket engines that are used today (all of which meet the primary functional requirements); however,they perform those functions in slightly different ways with slightly different architectures. These architecture of the engine is primarily determined by their fuel type and their fuel consumption method. The primary rocket engine that will be discussed in this roadmap is the full-flow staged-combustion closed-cycle liquid fueled rocket engine.
This roadmap is a Level-1 point of view of the launch vehicles as a technology that enables the Human race to transport cargo from the surface of the Earth to outer space as well as a Level-2 roadmap of liquid-fuel rocket engines which are one of the most used technologies of rocket engines. The corresponding IDs for both roadmaps are 1LV and 2RE.
Roadmap Hierarchy
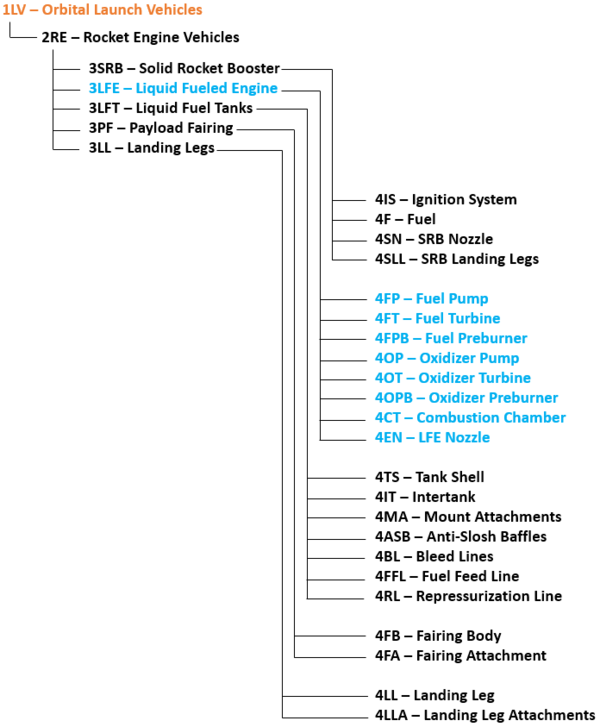
The following hierarchy shows the structure between the L1 Roadmap for Orbital Launch Vehicles and its decomposition into L2, L3, and L4 technologies. Note that the L1 Roadmap decomposes into L2 Rocket Powered Vehicles which in turn decomposes into it's elements. Much of this following analysis takes place at L1, L2, and L3 with in this structure.
DSM Allocation
1LV DSM Allocation
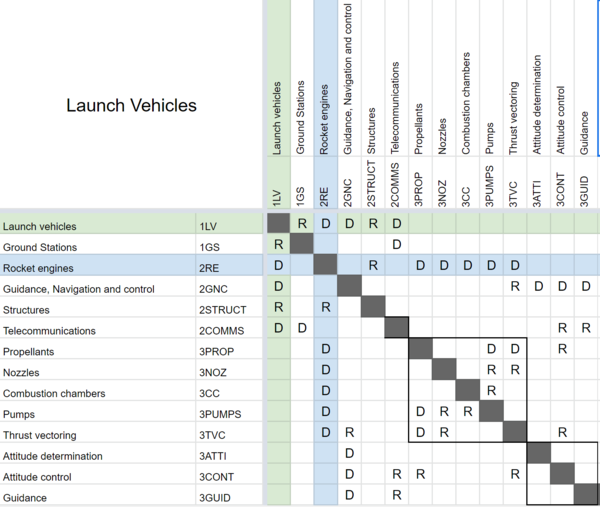
The following DSM shows the relationship of the Launch Vehicles roadmap to other high or lower level roadmaps. The Green cells represent the location of this roadmap and the Blue cells represent the location of the 2RE roadmap detailed below. The letters R and D are for required and dependency respectively.
The following tree structure can be also extracted from it:
- 1LV Launch vehicles
- 2RE Rocket engines
- 3PROP Propellants
- 3NOZ Nozzles
- 3CC Combustion chambers
- 3PUMPS Pumps
- 3TVC Thrust vectoring
- 2GNC Guidance, Navigation and control
- 3ATTI Attitude determination
- 3CONT Attitude control
- 3GUID Guidance
- 2STRUCT Structures
- 2COMMS Telecommunications
- 2RE Rocket engines
- 1GS Ground Stations
2RE DSM Allocation
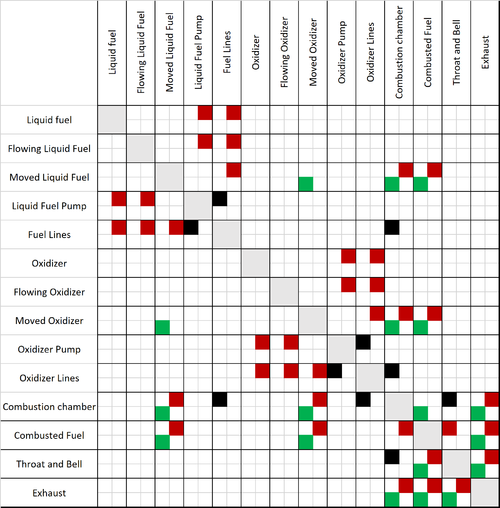
Below is a schematic DSM for the simplified and generalized liquid-fuel rocket engine described in the first section. Cells colored black indicate a physical connection between formal elements. Red indicates a mass flow between formal elements. Green illustrates an energy flow between formal elements. There can be multiple colors for a single cell.
Roadmap model using OPM
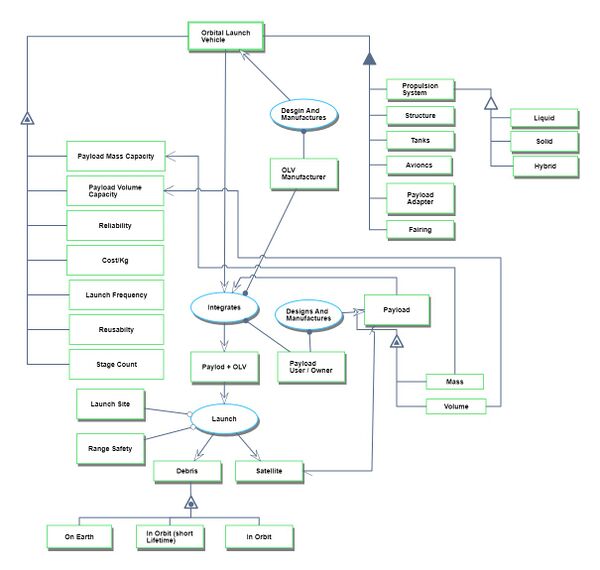
The following Object Process Diagram describes the Orbital Launch Vehicle technology point of view for this roadmap. The main object of the diagram is the different launch vehicles, its decomposition into main components/subsystems like propulsion system, structures, tanks, avionics, payload adapters, and the main attributes. Finally, the processes in the lifecycle are described as the integration of the payloads and the actual launch.
The attributes exhibited by the LV object such as Payload mass capacity, payload volume capacity, reliability, cost/kg, Launch frequency, Reusability and Stage count that are the main FOMs of a Launch Vehicle.
Full-flow, Closed-Cycle, Staged-Combustion Engine
A full flow staged combustion closed cycle engine takes advantages of oxidizer rich and fuel rich closed cycle designs. This design is technically the most difficult to successfully built, and only one engine has ever been flight tested with this configuration. The key differentiator is that flowing fuel and oxidizer are never directly connected to the main combustion chamber. Instead, they are all directed through turbopump assemblies. One assembly is responsible for producing an oxygen rich exhaust – which drives the oxidizer turbopump – and the other assembly produces a fuel rich exhaust – which drives the fuel turbopump.
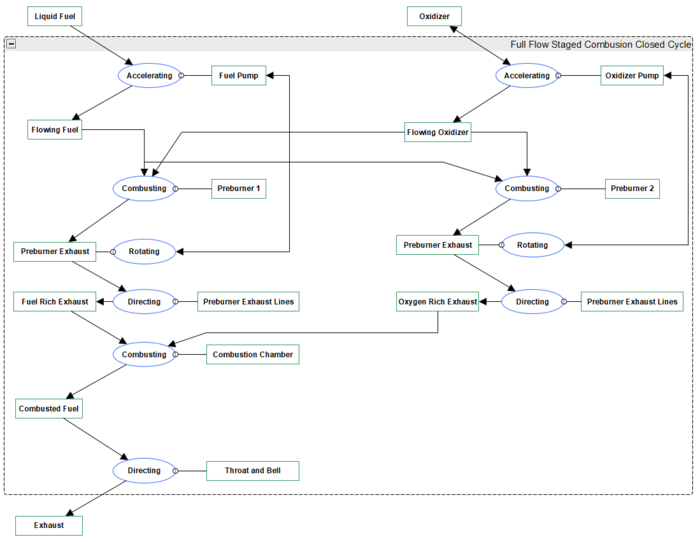
There are only three engines which have ever attempted this design, and only one has ever flown. The soviet RD-270, the Rocketdyne integrated powerhead demonstrator (never tested), and the Raptor engine, which was first flown in August 2019 for a 1 minute 150m flight demonstration.
Figures of merit
1LV FOMs
The table below shows a list of FOMs by which Orbital Launch Vehicles can be assessed.
| Figure of Merit | Units | Description |
|---|---|---|
| Payload to LEO | [Kg/Year] | Payload mass that can be put into a 500 Km circular low earth orbit for a specific launch vehicle every year. This takes into account the production rate of the rockets and, if applicable, the reusability. |
| Payload to mass Ratio | [Kg/Kg] | Mass capacity to LEO over total LVs mass (including the payload). |
| Reliability | [non-dimensional] | Successful launches over total launches. |
Cost per Kg as a FOM wasn't considered in this roadmap because of the difficulty of obtaining accurate data.
Physical principles
In order to put a payload in orbit, an OLV needs to accelerate to a certain velocity in a certain direction at a specific altitude from the center of the Earth. This requirement can be derived from Newton’s Universal Gravitational Law and can be approximated for circular orbits as:
Where G is the universal gravitational constant, M the mass of the Earth and r the distance to the center of the planet of the orbit. So for example, a 500km circular orbit around the Earth will require a velocity of approximately 7.61 km/s or 27405 Km/h. A few more km/s are usually needed to account for atmospheric losses and other non-idealities.
In other to achieve that velocity, OLV uses rockets engines that use a combination of fuel and oxidizers (known as propellants) to create a high-pressure gas that is then accelerated by a converging-diverging nozzle to create thrust.
- <math>\Delta v = v_\text{e} \ln \frac{m_0}{m_f} = I_\text{sp} g_0 \ln \frac{m_0}{m_f}</math>
Where ΔV is the change of velocity of the vehicle, m0 is the initial total mass, including propellant, also known as wet mass, mf is the final total mass without propellant, also known as dry mass, ve is the exhaust velocity and is equal to Isp times g0. Here, Isp is the specific impulse in the dimension of time and is a measure of effectively the rocket use the propellant and g0is standard gravity. In other words, this equation relates the total amount of velocity change that a rocket engine can create on a system by means of the initial and final mass (loss of mass of propellant), the efficiency. When multiple stages are present this equation must be considered for each stage.
So, as ΔV is known, then choosing a propulsion system will define the Isp and this will lead to the ratio of the initial and final mass necessary or which is equivalent to the amount of mass for structure tanks and engines, payload and propellant that is needed.
For example, this table shows some figures of merit of different rocket engines.
| OLV | Propellant % of total mass | Payload % of total mass |
|---|---|---|
| Saturn V | 85 | 4 |
| Space Shuttle | 85 | 1 |
| Soyuz | 91 | 2 |
In conclusion, the only FOM that is directly related to a physical principle is the Payload to mass Ratio described above.
Payload to mass Ratio [Kg/Kg]
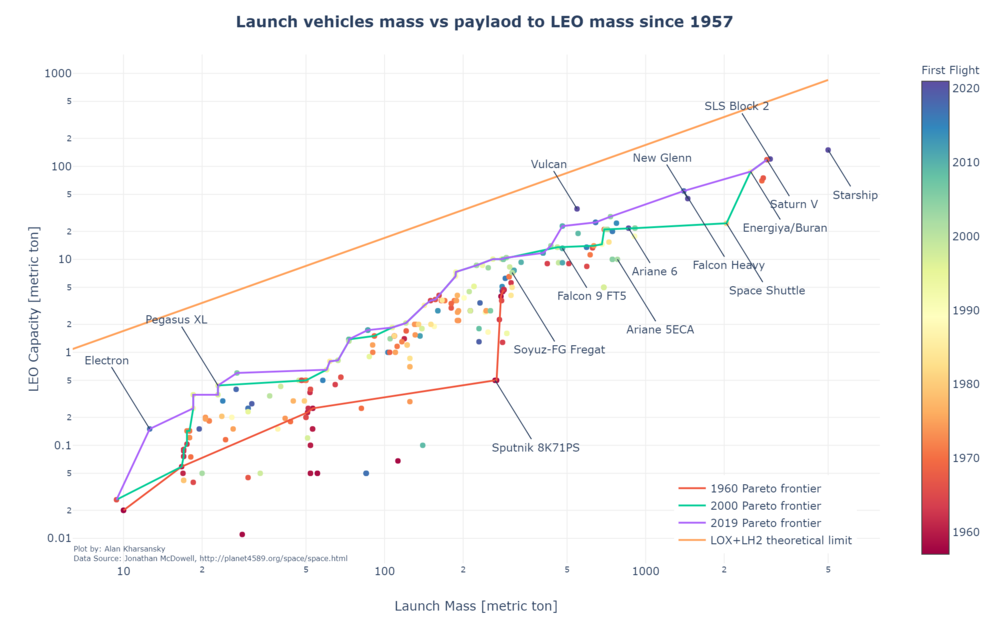
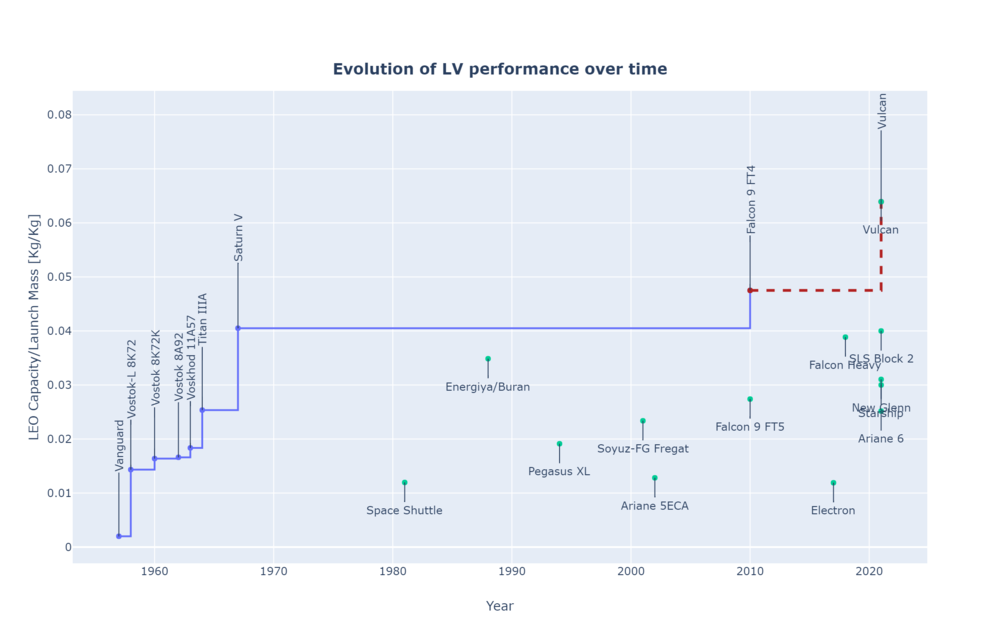
Useful payload to orbit is driven by the Rocket Equation and then affected by the different efficiency factors and non-idealities of the real Launch Vehicles designed and implementation. The trend in the payload to mass ratio is illustrated in the following plot using historical database <ref>McDowell's JSR Database (Links not working)</ref> since 1957. Only those LVs which has successfully achieved orbit at least once and carrying more than 10 Kg of payload were considered. A trend towards bigger LVs and more efficient can be observed.
Caveat: the LEO capacity figure is an approximation and is not normalized to a specific orbit across LVs. A substantial difference might be present if the stated LEO capacity was calculated for a 600 KM SSO orbit instead of a 400 Km equatorial orbit.
The evolution over time of this FOM can be seen in the following plot. In this case, only those LV that are better than the previous ones is plotted.
Payload to LEO [Kg/Year]
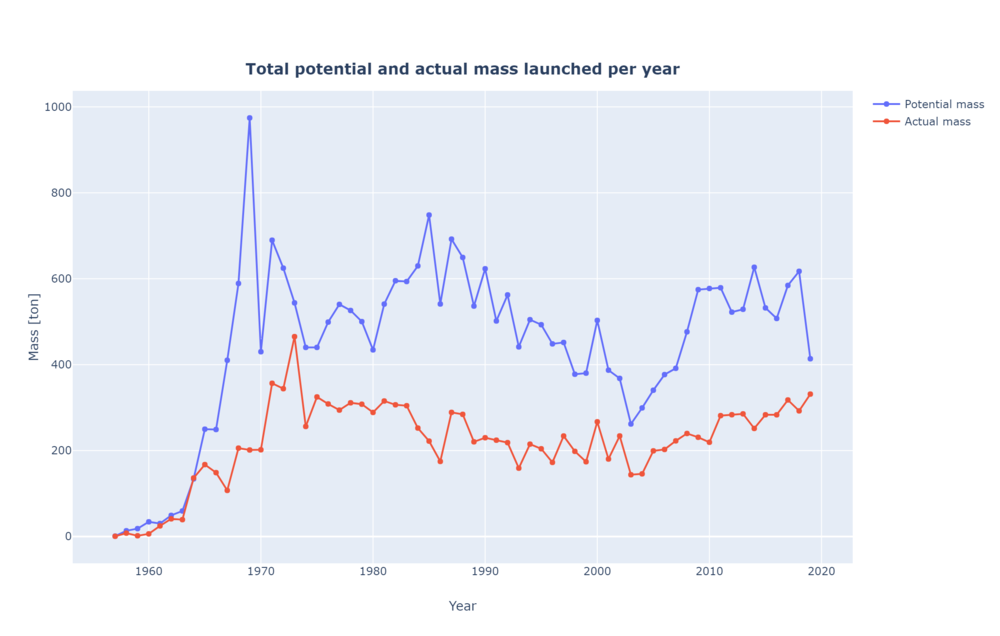
Payload to LEO can be used to estimate the capacity of the total launchers to put payload in orbit. In this case, two different sub-FOMs where calculated. First, the actual mass launched by aggregating all the masses of all the satellites on every launch per year. This doesn't include the payload adapters and dispensers used for the launch. On the other hand, the potential capacity is the sum of the total LEO capacity for each vehicle aggregated every year. As a reference, the ISS is about 419 tons and the James Webb Space Telescope is approximately 6.2 tons.
Reliability
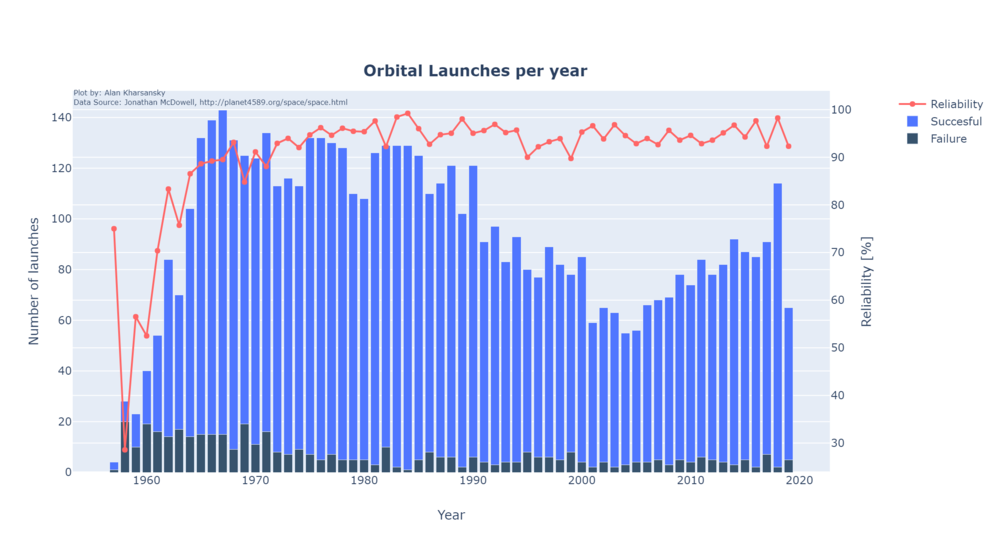
The reliability of LVs has increased significantly during the first 10 years after 1957 reaching levels of above 90% overall. Later years the increment is not that significant and for example, in 2018 the 98.24% of all the launches were successful. This trend and the totals can be seen in the following plot:
2RE FOM
Governing Equations for Rockets
1. Tsiolkovsky Rocket Equation (m/s)
Δv = ve*ln(m0/mf)
- ve = effective exhaust velocity
- m0 = initial total mass including fuel and oxidizer
- mf = final mass without fuel and oxidizer
2. Specific Impulse (s)
Isp = ve/g0
- ve = average exhaust speed along the axis of the engine (either at sea level or vacuum)
- g0 = standard gravity in m/s2
3. Net Thrust (N)
Fn = M*Ve
- M = exhaust gas mass flow
- Ve = effective exhaust velocity
4. Thrust-to-weight ratio (N/kg)
TTW = Net Thrust (N)/m (kg)
- m = dry mass of the engine
Figure of Merit
Combining Eqn's 1 and 3 and dividing by Engine Cost yields the following Rocket Engine FOM:
Rocket Engine Thrust per Dollar (N/$)
Fn/$ = M*Δv / ln(m0/mf)
- M = exhaust gas mass flow
- Δv = velocity required to enter LEO
- m0 = initial total mass including fuel and oxidizer
- mf = final mass without fuel and oxidizer
Comparison of FOMs Across Platforms (see column 11 for Thrust/$)
| Engine Name | Engine Type | Use Case | Year of First Development | Isp vac (s) | Thrust vac (kN) | Dry Mass (kg) | Thrust/Weight Ratio | Cost ($Million) | Isp/Weight (s/kg) | Thrust/Cost (kN/$) | Isp/Cost (kN/$) |
|---|---|---|---|---|---|---|---|---|---|---|---|
| Raptor | Full flow staged combustion closed cycle | Starship | 2019 | 330 | 3,297 | 1,700 | 198 | 1 | 170 | 3,297 | 330 |
| BE-4 | Oxygen rich staged combustion closed cycle | New Glenn | 2020 | 340 | 2,400 | Unknown | Unknown | 8 | Unknown | 300 | 43 |
| Merlin | Gas generator open cycle | Falcon 9 | 2007 | 305 | 981 | 470 | 213 | 0.75 | 146 | 1,308 | 407 |
| Vinci | Gas generator open cycle | Ariane 6 | 2017 | 465 | 180 | 93 | 197 | Unknown | 240 | Unknown | Unknown |
| Vulcain 2 | Gas generator open cycle | Ariane 6 | 1995 | 431 | 1,140 | 1,800 | 65 | Unknown | 682 | Unknown | Unknown |
| P120 | Solid rocket booster | Ariane 6 | 2018 | 279 | 4,500 | 11,000 | 42 | Unknown | 682 | Unknown | Unknown |
| Space Shuttle SRB | Solid rocket booster | Space Shuttle | 1975 | 242 | 12,000 | 91,000 | 13 | 8 | 1,835 | 1,500 | 30 |
| RS-25 | Fuel rich staged combustion closed cycle | Space Shuttle | 1980 | 452 | 2,297 | 3,177 | 73 | 50 | 630 | 46 | 9 |
| RD-180 | Oxygen rich staged combustion closed cycle | Atlas V | 1989 | 338 | 4,150 | 5,480 | 77 | 25 | 446 | 166 | 14 |
| F-1 | Gas expansion open cycle | Saturn V | 1964 | 304 | 7,770 | 8,391 | 94 | 30 | 328 | 259 | 10 |
| NERVA | Nuclear solid core | Test Only | 1964 | 850 | 334 | 18,144 | 2 | Unknown | 46,175 | Unknown | Unknown |
Alignment with “Company” Strategic Drivers: FOM Targets
| ID | Strategic driver | Alignment with targets |
|---|---|---|
| 1 | To develope a rapidly fully reusable launch system capable of landing payload in the surface of Mars | The Starship project currently in the Launch Vehicle roadmap will provide a capacity of 100 tons to LEO in a fully reusable launch vehicle that can be used to land on Mars. |
| 2 | To develop a liquid-fueled and reusable rocket engine that can enable an affordable launch marketplace in which we have a distinct first-mover advantage. | The liquid fuel rocket engine roadmap will target the development of methane fueled rocket engine that will provide at least 3,000 kN of thrust in vacuum. This would represent a disruptive technology in the rocket engine marketplace. |
| 3 | To provide a low-cost solution to satellite launch to LEO with a fast pace (monthly) and an affordable price for small satellites to further fund the other projects of SpaceX | SmallSat Rideshare Program will provide small satellite operators with regularly scheduled, dedicated Falcon 9 rideshare missions to sun-synchronous orbit (SSO) for ESPA class payloads' for as low as $1M per mission, which includes up to 200 kg of payload mass. |
The company’s technology roadmap is aligned with all three of its strategic drivers. There is sufficient organizational capability, funding, and time to meet our ambitious plan. All of the targets are within the parameters set forth by the governing equations, and thus they are technically feasible.
Positioning of Company vs. Competition: FOM charts
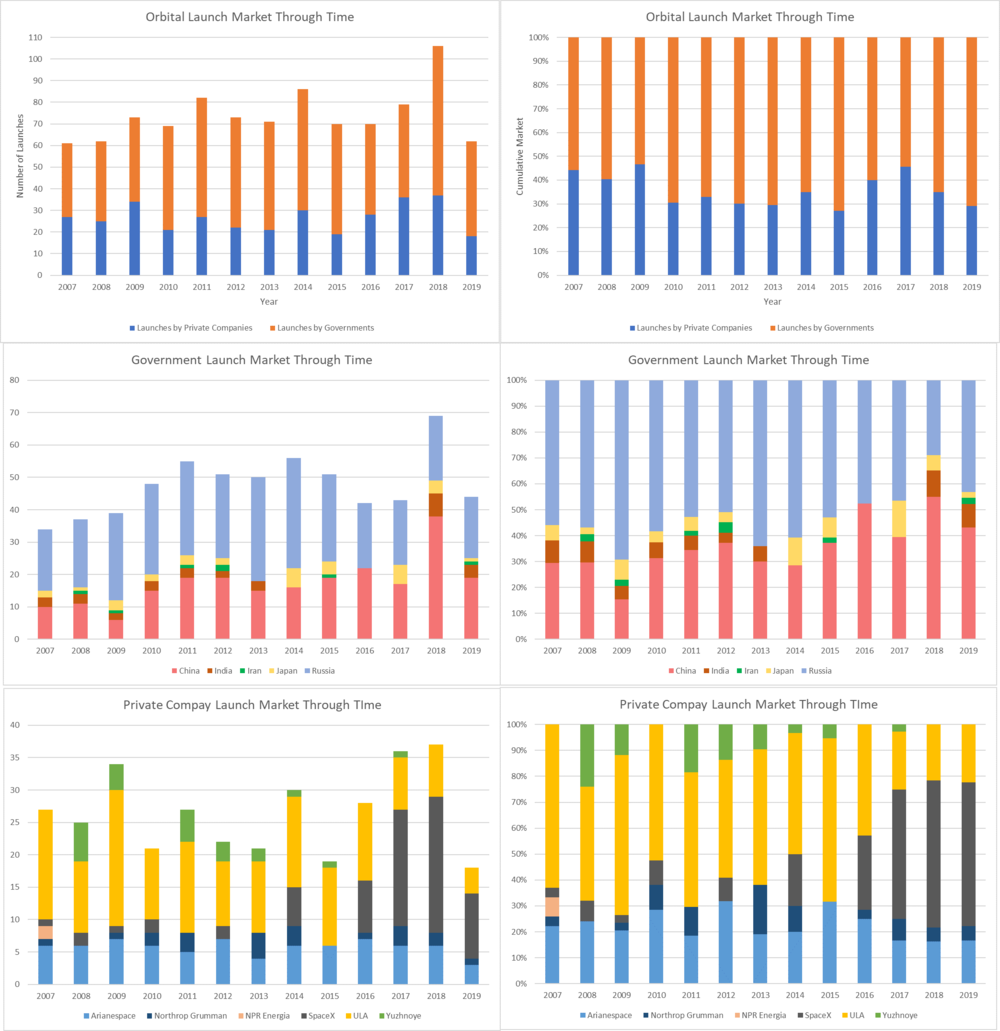
At the highest level, there are two semi-competitive solutions – governmental funded agencies and private companies. Publicly funded agencies are nation specific, and account for between 50% and 75% of all orbital class launches annually. For orbital class launch vehicles, China, India, Iran, and Japan utilize exclusively publicly funded organizations. Russia uses almost exclusively publicly funded organizations with rare exceptions. Chinese and Russian launches together account for ~90% of all publicly orbital class launches in the world on an annual basis. The remaining 50% to 25% of all orbital launches annually are publicly and privately funded but launched by private companies.
Public Competitive Landscape
China and Russia are the primary consumers of state-funded and state-organized (and state-researched, and state-produced) products. For these examples, the pricing scheme is extraordinarily difficult to find detailed reports. However, one can safely assume that massive amounts of funds are dedicated to the research of new technologies. In examining the development of the “Long March” rocket (the current iteration has roots back to 1993) there have been over 100 launches of various incarnations. Most of which have been almost 100% expendable. There are currently three new Long March rockets in development with differing fuselage diameters to fulfill different mission profiles – including a 100m tall, heavy lift behemoth called the Long March 9. This development of this program must have cost a minimum of tens of billions of dollars.
The Russian space program is another important example to examine. Most of the lift vehicles that the KSRPSC operate are old ICBMs that have been decommissioned. Specifically, there is a major use of R-7 rockets that have provided lifting capability for payloads ranging from sputnik to the Soyuz (after modifications). In fact, the Soyuz-U, a member of the R-7 rocket family, is the single most launched carrier rocket in the world with 786 launches and 22 failures (success rate = 97%). A single launch of a Soyuz-U is claimed to cost ~$50 million bringing the total cost of launching Soyuz-U rockets to ~$40 billion. This excludes development costs, doesn’t account for any other Soyuz launches, and excludes monies paid to the Russian government to use their services. Regardless, it is a reasonable claim to estimate the cost of the R-7 space program to be on the same order of magnitude (tens of billions of dollars, possibly hundreds of billions of dollars) as the Chinese program.
From a competition perspective, the Russian government has been much more willing to work with other governments (including the United States government, the Israeli government, the Ukrainian government, and more). In this sense then, the Russian publicly funded space program is in direct competition with the private sector while simultaneously achieving some levels of internal funding guaranteed and specific research requirements dictated by national defense. The Chinese space program, on the other hand, is not in competition with anyone and in fact is likely not going to be a user of any other space program pending political resolutions.
Private Competitive Landscape
Within the private sector there was a duopoly that existed prior to 2016 between Arianespace and ULA. Arianespace is partly owned by 17 separate private entities. Arianespace was initially founded with European governmental agencies but is currently mostly privately held. The largest shareholders of Arianespace are Airbus and Safran SA. Arianespace was founded with the specific intent of enabling commercial launches to space. From 2007 to 2015, Arianespace accounted for between 20% and 30% of the private space market for orbital launch vehicles. ULA is a joint venture that has existed between Boeing and Lockheed Martin since 2006. The venture was chiefly formed to help the US government launch their own military and civilian satellites, but ULA also allows for commercial launches.
Prior to 2016, Northrop Grumman, Arianespace, and ULA all occupied slightly different markets as launch providers. Northrop Grumman was largely a small payload and cheap launch provider. If you needed an orbital class rocket, and a small-lift vehicle didn’t have the diameter to hold your satellite, Northrup dominated because of their cheap launches. If you had a light, but large payload, then Ariane dominated with a massive 5.2m hull and a cost that was comparable to much smaller diameter rockets. If your payload mass exceeded 16,000kg, then ULA was your only option with their Atlas and their massive Delta rocket offerings. Given that each provider was well positioned in this landscape, they were all in the position of defenders with the emergence of SpaceX’s Falcon 9 rocket.
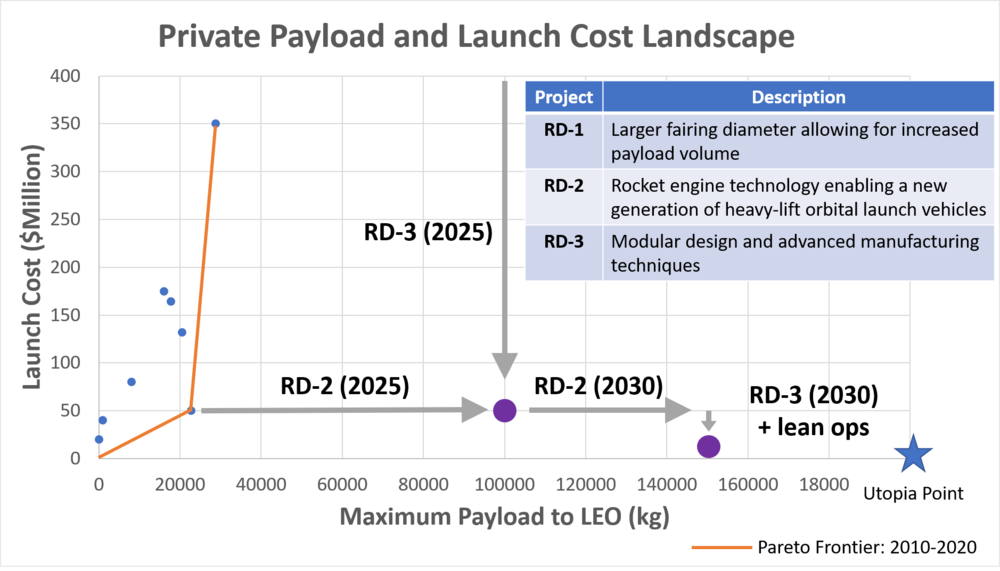
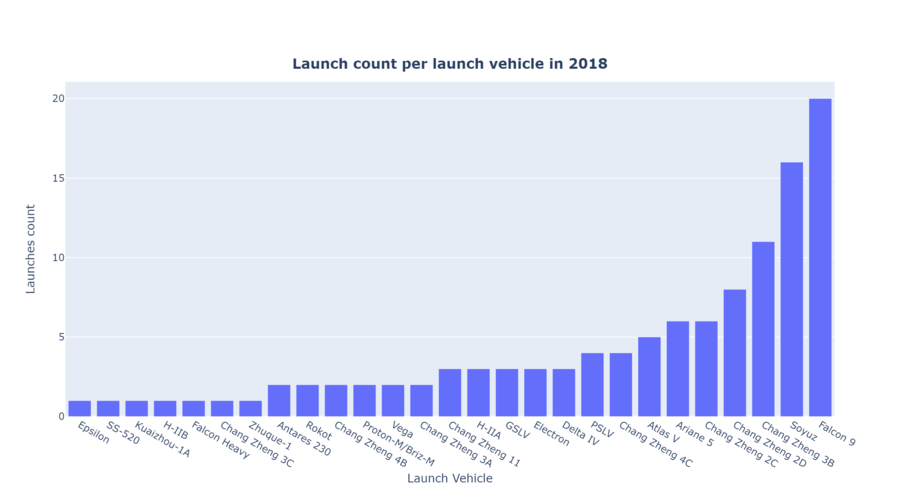
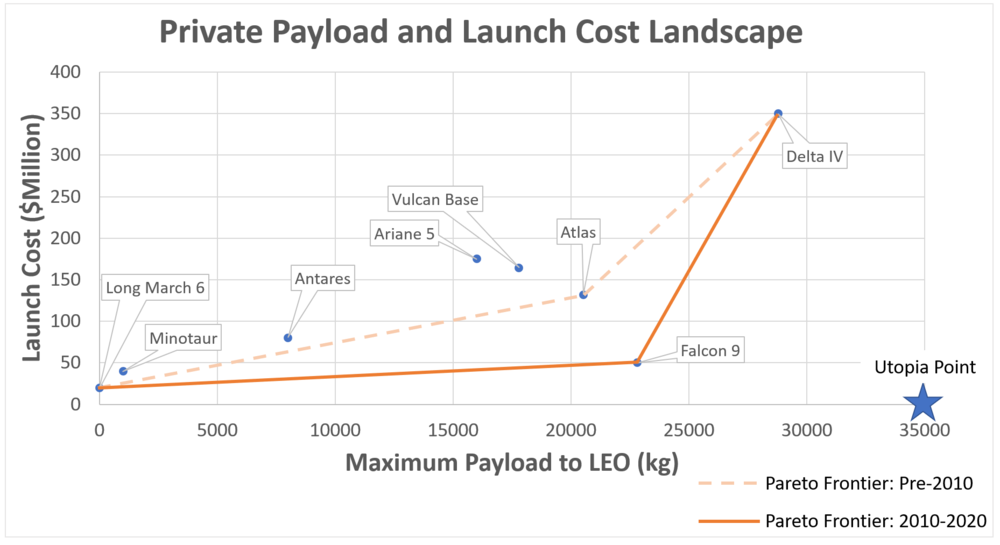
Everything changed in 2016. SpaceX now dominates the private sector launch market – and in fact, in 2018 China launched the most orbital class rockets (38) and the second most rockets were launched by SpaceX (21) with Russia launching 20, and ULA launching 8. In 2018, SpaceX alone accounted for 57% of all the launches in the private sector. In a span of one year, SpaceX upset the duopoly held by Arianespace and ULA and became the largest single force in the private launch provider sector. See the graphs and tables below to summarize the private launch capabilities that currently exist.
By 2016, the Falcon 9 had flows 20 times with one failure. With a cost of $50 million the Falcon 9 and SpaceX were unquestionably in the position of attacker and pioneer. The Falcon 9 could outperform every other vehicle in almost every realistic launch scenario. There were a few circumstances where a payload was too heavy or too wide to work with the Falcon 9, and in those situations either Ariane or Delta was used. It is no surprise however, that clients flocked to the affordable solution provided by SpaceX. In almost every scenario, the Falcon 9 is a dominating strategy.
SpaceX continues this strategy of attack and pioneering by developing the Starship platform. No firm claim for launch costs have been settled on for Starship, but it will have payload capacity of ~100,000 kg and a diameter of 9m dwarfing every other private provider option. Estimates for cost range from gobsmackingly low ($10 million – Elon Musk at the IAC 2017) to shockingly low ($100 million – Business Insider estimate). If the real cost per launch is in that window, then Starship paired with Falcon 9 will become dominant designs.
Technical Model: Morphological Matrix and Tradespace
1LV Technical model
Orbital requirements
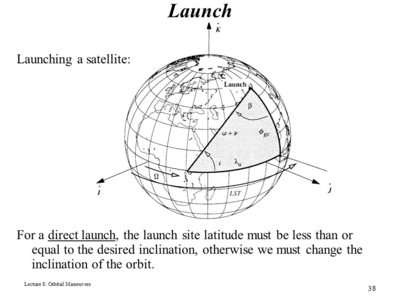
In order to put a payload into a specific orbit, a specific position and velocity vector must be achieved as illustrated in the following diagram:
This analysis will focus on achieving circular orbits in the Earth orbit. This is not the only possible orbit or trajectory (for example in GTO or interplanetary trajectories), but the results can be extrapolated to those cases if necessary. For a circular orbit, the relationship between the orbit radius and the velocity is:
Equation
- <math>v_{orbit} = \sqrt{\frac{\mu}{r_{orbit}}}</math>
Here, μ, is the Earth Gravitational Constant and has a fixed value <math display="inline">3.98574405096E14 \frac{m^3}{s^2} </math> and <math display="inline">r_{orbit}</math> is measured from the center of the Earth. If the altitude of the orbit is needed, the mean radius of the Earth equal to 6371Km must be used. As an example, a typical 500 Km circular orbit around the Earth needs a velocity of 7.61 km/s.
Geometry
Because launch vehicles are (mostly) launched from the surface of the Earth, the geometry of the problem must be considered For a direct launch, this can be seen in the following image:
Using spherical trigonometry (https://www.orbiterwiki.org/wiki/Launch_Azimuth) it can be calculated that:
- <math> cos(i) = cos(\Phi)sin(\beta)</math>
Where i is the desired orbital inclination, β is the launch site latitude, and Φ is the launch azimuth. This restricts the orbital inclination to be always greater or equal than the launch site latitude:
- <math> i >= \Phi </math>
So for example, if the launch site is located at 30deg latitude, then it won’t be possible to direct launch the payload into an equatorial (0deg) orbit.
Another issue, that helps the launch is Earth’s rotation. Because of it, the launch site will have a tangential velocity that is dependent on the latitude as follows:
- <math> v_{earth_{due east}} = \omega_{earth} r_{earth} cos(\Phi) </math>
For example, If launching from the equator where Φ=0 the tangential velocity is maximum (about 463.7 m/s) as opposed to launching from the pole where Φ=90 and there is no tangential velocity at all. All this is only valid if launching due east which is not always the case. If you launch due East from any latitude, then β=90, so the inclination of the resultant orbit ends being the latitude of the launch. To account for this change in final inclination, the previous equation must be modified according to:
- <math> v_{earth_{due east}} = \omega_{earth} r_{earth} cos(\Phi) cos(i) </math>
So this potential gain of velocity must be taken into account when calculating the required launch strategy.
Last, if the desired orbit inclination is not achievable by a direct launch, then the launch must perform an inclination change that will require additional velocity (in a specific direction). This can be represented by:
- <math> \Delta v_{plane-change}=2V_{orbit}sin(\alpha/2) </math>
Where α is the difference in direct insertion angle to the desired angle.
Losses
During the flight and before achieving the orbital condition, there are losses of energy (or speed) that must be compensated. These losses are:
- Atmospheric drag which is the resistance of the air of the traveling vehicle
- Gravity drag which is the cost of having to hold the rocket up in a gravity field.
For a typical launch vehicle, aerodynamic losses are quite small while gravitational losses are bigger. Both depend heavily on the shape of the trajectory used and in the case of the atmospheric drag on the shape of the launch vehicle too. Usually, this will require an additional 15-20% of ΔV to compensate for these losses. 20% will be considered for the analysis.
Rocket equation
In order to achieve a change in velocity, a typical launch vehicle will utilize rocket engines that follow the Tsiolkovsky equation:
- <math>\Delta v = v_\text{e} \ln \frac{m_0}{m_f} = I_\text{sp} g_0 \ln \frac{m_0}{m_f}</math>
Where ΔV is the change of velocity of the vehicle, m0 is the initial total mass, including propellant, also known as wet mass, mf is the final total mass without propellant, also known as dry mass, ve is the exhaust velocity and is equal to Isp times g0. Here, Isp is the specific impulse in the dimension of time and is a measure of effectively the rocket use the propellant and g0 is standard gravity. In practical launch vehicles, multiple stages are stacked to create a launch vehicle that discards the unused mass as soon as possible to maximize efficiency. Also, these stages are usually tuned for each part of the flight, for example by having a high thrust to weight ratio on the first stages and a higher Isp on the last stages. For simplicity, that won’t be considered in this model.
Complete model
Considering all the factors together, to get to the desired orbit from a launch site in the earth using a rocket-propelled launch vehicle the following equation can be used:
<math> v_{orbit} + v_{drag} + v_{plane-change} - V_{earth} = I_\text{sp} g_0 \ln \frac{m_0}{m_f} </math>
Which can be rewritten as:
<math> \sqrt{\frac{\mu}{r_{orbit}}}(1 + 2 sin(\alpha/2) + v_{drag} - \omega_{earth} r_{earth} cos(\Phi)cos(i) = I_\text{sp} g_0 ln (\frac{m_0}{mf})</math>
Where:
- <math> g_0=9.81 \frac{m}{s^2} </math>
- <math> \omega_{earth} = 7.2921159 E-5 \frac{rad}{second}</math>
- <math> r_{earth} = 6371 Km</math>
where launch latitude Φ, desired orbit inclination i, plane change requirement α, target orbit radius rorbit, specific impulse Isp the masses m0 and mf are the design variables. Vdrag is left as a design variable too because it can be slightly modified with trajectory optimization and aerodynamics work.
mf represents the final mass of the system which is equal to the launch vehicle mass plus the payload mass, while m0 is the initial mass of the system which is mf plus the propellant mass mp
Morphological matrix
According to the model described above, the morphological matrix from which different launch vehicles configurations can be made is presented:
| Attribute / Options | 1 | 2 | 3 | 4 | 5 | 6 |
|---|---|---|---|---|---|---|
| Stage 1 Propellant / Engine | None | LOX/LH2 | KEROLOX | Methalox | UDMH/N204 | Solid |
| Stage 2 Propellant / Engine | None | LOX/LH2 | KEROLOX | Methalox | UDMH/N204 | Solid |
| Stage 3 Propellant / Engine | None | LOX/LH2 | KEROLOX | Methalox | UDMH/N204 | Solid |
| Stage 4 Propellant / Engine | None | LOX/LH2 | KEROLOX | Methalox | UDMH/N204 | Solid |
| Launch type | Surface launch | Air launch | ||||
| Launch site | KSC | Korou | Baikonour | Air launch | ||
| Reusable | Yes | No |
As an example, a few popular and currently in operations launch vehicles are compared:
| Attribute / LV | Falcon 9 | Soyuz-FG /Fregat | Ariane 5 | Pegasus XL | LongMarch 3B |
|---|---|---|---|---|---|
| Stage 1 Propellant / Engine | KEROLOX | UDMH/N204 | LOX/LH2 + Solid | Solid | UDMH/N204 |
| Stage 1 Propellant / Engine | KEROLOX | UDMH/N204 | UDMH/N204 | Solid | UDMH/N204 |
| Stage 3 Propellant / Engine | None | UDMH/N204 | None | None | LOX/LH2 |
| Stage 4 Propellant / Engine | None | None | None | None | UDMH/N204 |
| Launch type | Surface launch | Surface launch | Surface launch | Air launch | Surface launch |
| Launch site | KSC | Baikonour | Korou | Air launch | XiChang |
| Reusable | Yes | No | No | No | No |
Sensibility analysis
In this analysis, the sensibility of the design variables for a generic launch vehicle for a particular mission is studied. The mission is the launch of a payload into a Sun-synchronous orbit with the following fixed paramters:
| Parameter | Value | Unit |
|---|---|---|
| Orbit altitude | 500 | Km |
| Inclination | 97 | degree |
| Launch latitude (KSC) | 28.57 | degree |
| Isp (LOX/LH2) | 440 | s |
| Vdrag | 1500 | m/s |
The main figure of merit under analysis will be the mass ratio r according to:
<math> J(x) = r = \frac{m_f}{m_0} = e^{-\frac{\sqrt{\frac{\mu}{r_{orbit}}}(1 + 2 sin(\alpha/2) + v_{drag} - \omega_{earth} r_{earth} cos(\Phi)cos(i)}{I_{sp}g_0}}</math>
Where the design vector is:
<math> x= [v_{drag}, \Phi, I_{sp}] </math>
So J(x0) = 11%. This means that from the total mass of the rocket, 89% must be propellant and 11% must be structure and payload (which is why it’s probably impossible to achieve yet).
Then, the possible improvements are:
- Improving the rocket efficiency (Isp)
- Improving the launch trajectory (Vdrag)
- Reducing the location of the launch site
Note that because the orbit inclination is 97 it’s actually rotating in the opposite direction of the earth so in this case, the contribution of the Earth tangential velocity must be counteracted and the sign was reversed. Also, the number 426.6 is the product of cos(97) times 463.7 m/s the tangential velocity of the Earth at the Equator.
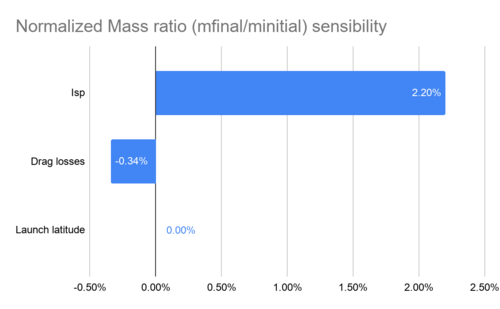
Calculating the normalized partial derivatives and considering the SSO scenario we get:
- <math> \frac{x_{i,0}}{J(X^0)}\frac{\partial r}{\partial I_{sp}}|_{x^0} = 2.20% </math>
- <math> \frac{x_{i,0}}{J(X^0)}\frac{\partial r}{\partial V_{drag}}|_{x^0} = -0.34% </math>
- <math> \frac{x_{i,0}}{J(X^0)}\frac{\partial r}{\partial \Phi}|_{x^0} = 0.003% </math>
This essentially shows that the only effective way of improving the mass ratio is by changing the Isp. If on the other hand, if the payload mass ratio is wanted to be improved, then the structural mass will have a bigger impact in the figure of merit.
2RE Technical model
Morphological matrix
To explore the trade space for a LEO capable rocket design, the team must consider a variety of design parameters. The two most important figures of merit on which to evaluate a rocket’s capability are cost/launch and payload to orbit (a function of thrust and mass). Not surprisingly, the cost/launch is dominated by the re-usability of a design. This is why our company is focusing so heavily on this aspect of the design vector (see tornado diagram below).

Cost Sensitivity analysis
Based on the design decisions shown above one can see the variety of designs for achieving LEO. For example, notice that the Soyuz, RD-180 design employs 20 engines to lift a payload of 7 metric tonnes, while the RS-25 driven Space Shuttle uses just 3 engines to lift a payload of 25 tonnes.
The equation below illustrates how some of these design decisions manifest themselves in the HeilbrunHorton Rocket Cost Equation.
NPV Sensitivity Analysis
In an effort to focus efforts on the most impactful project elements, an in-depth analysis of the main contributing factors to financial success of the project was undertaken. The elements that were analyzed were:
- Revenue per launch ($ million)
- Reuse (number of launches a single rocket could undertake)
- Cadence (months between launches)
- Vehicle construction costs ($ million)
- Fueling costs ($ million per launch)
- Refurbishment costs ($ million per launch)
Individual vehicles are calculated to have an NPV (see section below for detailed discussion). To initiate this exercise, a baseline design was assumed where:
| Assumptions | Base Case Value |
|---|---|
| Revenue per launch | 5 |
| Reuse | 30 |
| Cadence | 3 |
| Vehicle construction costs | 31.2 |
| Fueling | 0.9 |
| Refurbishment | 0.3 |
Delta NPV impact was then calculated on a per vehicle basis using the following architecture high and low cases.
These design options coupled with the financial model detailed below yielded the following tornado diagram showing which variables had the largest impact on the resulting single vehicle NPV model:
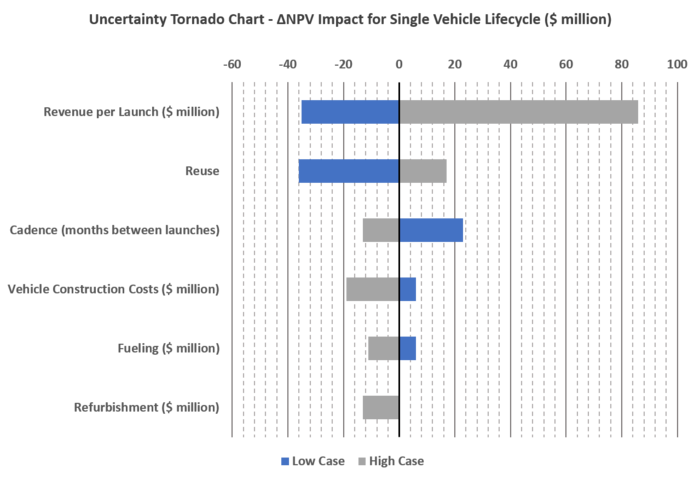
Critically, while the base case vehicle has a positive NPV, the overall project economics don't have a positive NPV because of the $2.5 billion required for R&D. In order to reach NPV neutrality by the end of the project, we used the results from the tornado diagram to calculate the percentage deviation from the base case that would be required in 2025 and 2030 in order to create an economic project. The results are summarized below:
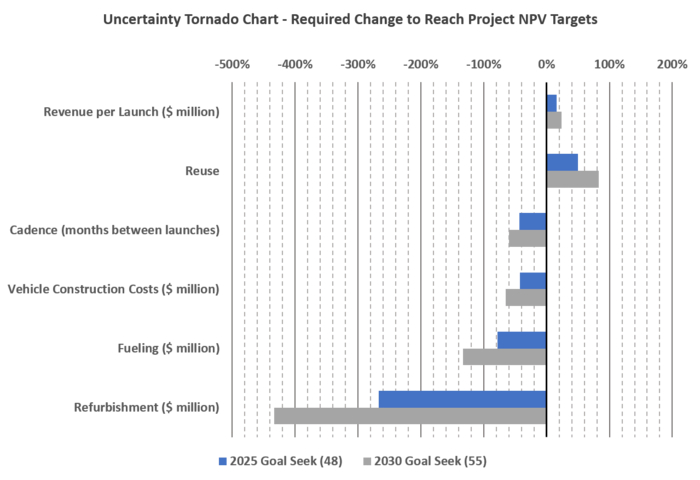
The takeaway from this plot is that some variables drive financial behavior more than others, and that without improvement over the baseline assumptions, the project will not be profitable. The chart shows us that project economics are most sensitive to the variable "revenue per launch" because just a small change to this variable makes the project profitable. Alternatively, the analysis is least sensitive to "refurbishment cost". In fact, a NEGATIVE 400% change is required to achieve break-even economics. This means that the company gets paid four times the amount that used to cost to do the job; which obviously is not feasible. These results were left as is to show the relative sensitivity of each variable. This analysis shows us that focus should be placed on reuse and increasing launch cadence.
Key Publications and Patents
1LV
Patents
The following patents are those I found interesting from a disruptive point of view. Each of them addresses a different technology that can somehow replace the launch vehicles by performing the same final outcome which is putting payload into orbit but using completely different approaches.
Orbital mechanics of impulsive launch
Inventor: Cartland; Harry E,
Assignee: QUICKLAUNCH, INC.
United States patent 10,427,804
Date: October 1 2019
This patent is about methods to launch into orbit a spacecraft using an impulsive launch. In this case, the spacecraft is initially accelerated in a direction due east from the Earth by a high energy launch system then traveling through the atmosphere until an apogee. The patent claims different methods to further accelerate an impulse launched spacecraft in order to achieve an LEO or a trans planetary trajectory or a way to rendezvous with an orbiting spacecraft.
Sea landing of space launch vehicles and associated systems and methods
Inventor: Bezos; Jeffrey P.
Assignee: Blue Origin LLC
United States patent 8,678,321
Date: March 25, 2014
The first claim is a perfect description of what is being patented here: “ A method for operating a space launch vehicle, the method comprising: launching the space launch vehicle from earth in a nose-first orientation, wherein launching the space launch vehicle includes igniting one or more rocket engines on the space launch vehicle; reorienting the space launch vehicle to a tail-first orientation after launch; positioning a landing structure in a body of water; and vertically landing the space launch vehicle on the landing structure in the body of water in the tail-first orientation while providing thrust from at least one of the one or more rocket engines.”
What is very interesting is that this patent was filed by Blue Origin in 2010 and SpaceX sue them. The trial judgment granted spaceX petition and the patent was canceled. This is the resolution of the United States Patent Office. This means that now, anyone is free to attempt to land a rocket on a boat.
Papers and publications
ECONOMIC MODEL OF REUSABLE VS. EXPENDABLE LAUNCH VEHICLES Link
Author: James R. Wertz, Microcosm
Published: IAF Congress, Rio de Janeiro, Brazil Oct. 2–6, 2000
In this paper Wertz analysis the economics of expendable and reusable launch vehicles. He estimates the costs and analysis of what are the volumes at which this technology may create a significant cost reduction in the launch costs. His final conclusion was: “A factor of 5 to 10 near term reduction in launch cost appears feasible. That should increase the size of the market, which can then lead to lower costs in the future.”
Parametric Model of an Aerospike Rocket Engine Link
Author: J. J. Korte NASA Langley Research Center
Published: 38th Aerospace Sciences Meeting & Exhibit 10-13 January 2000 / Reno, NV
In this paper, the author develops a mathematical and executable model of an aerospike engine that can be used in conjunction with other models to simulate launch trajectories utilizing this type of engine. This engine has been under study for decades and the special interests rely on the theoretical high efficiency across different altitudes that can be achieved. No aerospike engine has ever flown to space yet.
2RE
Patents
Patent 1 - Liquid Fuel Rocket Engine
Inventor: Chris Udo Maeding
Assignee: Airbus DS GmbH
United States patent
Date: December 2000
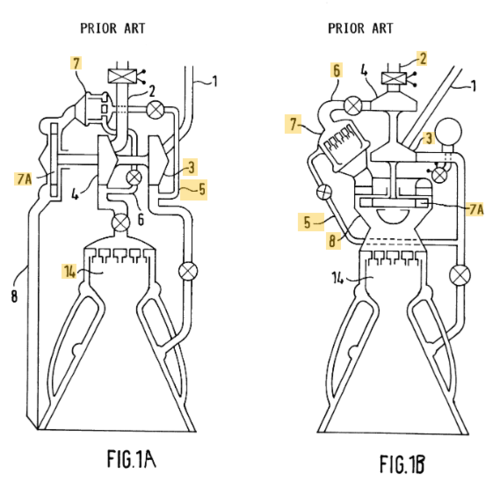
A liquid fuel rocket engine with a closed direct auxiliary flow cycle has a combustion chamber connected to each liquid fuel source through a respective main liquid fuel supply line. A turbo pump is provided in each main fuel supply line. The turbo pump is driven by a gas generator which is connected to a first bypass fuel supply line for supplying fuel to the gas generator. An exhaust gas duct (8, 9, 10) leads from the gas generator into at least one main fuel supply line for feeding gas generator exhaust gas into the main fuel supply line upstream of the turbo pump. (Maeding)
Patent 2 - oxygen propylene engine design
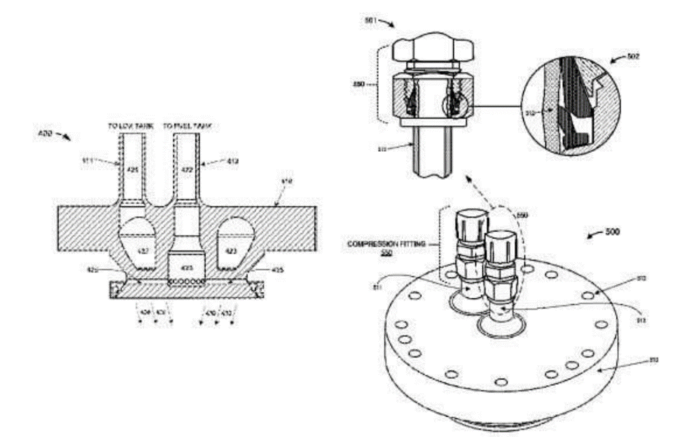
In September 2018, Vector (small-satellite launch start-up) was awarded a patent for their liquid oxygen propylene Engine design. The patent is a breakthrough in liquid fueled rocket technology because the engine design is the first to use propylene and liquid oxygen as a fuel source. This is particularly interesting to the FOM: cost/launch because propylene fuel is much more dense than standard liquid rocket fuel (Rocket Propellant-1, RP-1) making it a more efficient fuel. As such, the fuel can be stored in smaller tanks and used in engines without the need for turbo pumps, thereby also reducing the complexity of the engine design. Furthermore, the new engine design utilizes metallic 3D printing to reduce the number of parts in the engine. Increased fuel efficiency, reduced engine complexity, and utilization of cheaper manufacturing techniques makes this patent the trifecta in the race to reduce launch cost.
Papers
Isp of different fuels tell us the theoretical max mass efficiency of a rocket. Different rocket engine designs burn fuels with different efficiencies, and some designs are limited in the fuel types they can burn. Therefore, the fuel choice dictates the theoretical max efficiency and the engine design dictates how efficiently that fuel is burned. A tradespace emerges in which engine design must be evaluated against fuel choice such that total rocket mass efficiency is achieved.
- The theoretical limits for Isp are examined in the following paper - theoretical limits for Isp
The R&D portfolio described later in this roadmap invests heavily in new rocket technology. More specifically, a full flow staged combustion closed cycle liquid methane rocket engine. Portions of this technology are described in the following papers:
- A detailed look at injection head and combustion chambers in full-flow liquid fueled rockets is presented here.: injection and combustion in full-flow liquid rocket engines
- Advantages of full-flow staged combustion rocket engines: advantages of full-flow staged combustion
- A comprehensive history of Soviet liquid fueled rocket engine technology is presented here: history of liquid rocket engines
Financial Analysis
The corporate objective is to revolutionize space technology with the ultimate goal of enabling people to live on other planets. However, in order to fund the technological revolutions that are required, fundamental fiscal goals must be met. In evaluating the financial viability of the starship there are multiple attributes that must be considered to anchor on a viable price to charge a customer for a single launch. This heavy lifting technology was modelled assuming the enabling technology of functioning raptor engines was in place and functioning to required specs.
Model Assumptions
There are several variables that are pertinent to consider for financial evaluation of this technology program. Each of these variables will impact our main financial drivers. In this evaluation we treat all of these as independent, but it is likely that they will be related to each other. A high-level list of all required includes:
1) The discount rate
2) Vehicle assembly costs (includes engine costs, steel costs, labor, and other parts)
3) Recurring launch costs (includes fuel and refurbishment)
4) Time between launches of a unique starship
5) Number of re-uses that a single unique starship will encounter
6) Financial drivers: NPV and DPI
7) Ramp-up time is goal-seeking to produce 10 vehicles per year starting in 2020, with first 10 produced in 2025. Funding is delivered in equal batches to support early to mid-phace PA, PE, and PM efforts.
Please reference the following table for all assumptions that were used for the model:
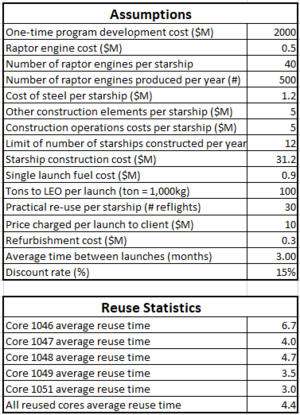
Discussion
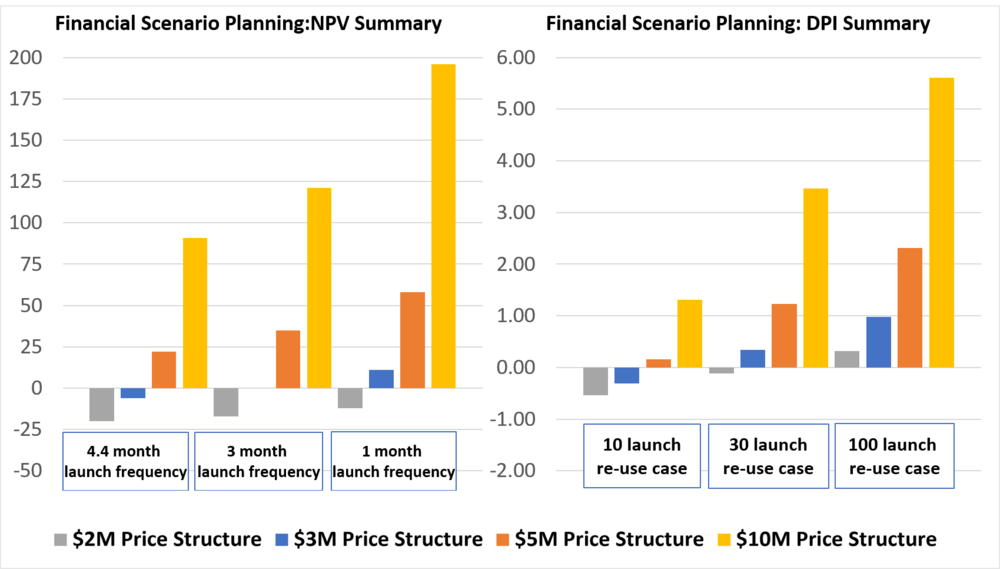
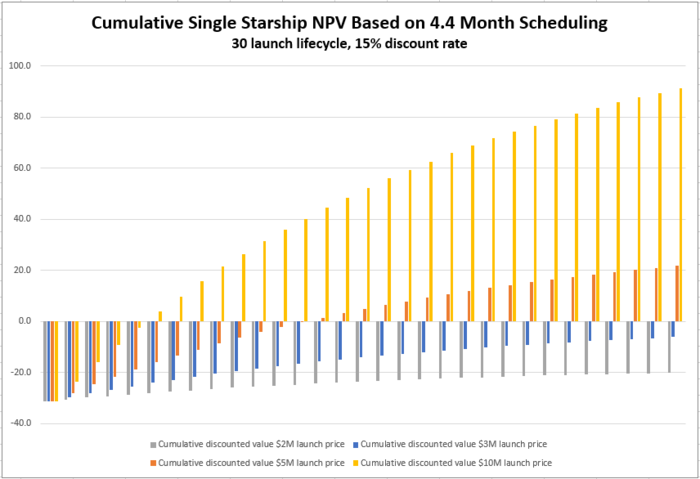
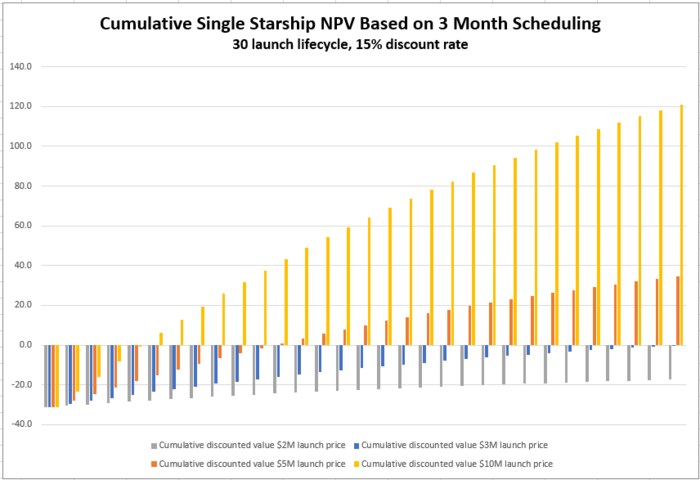
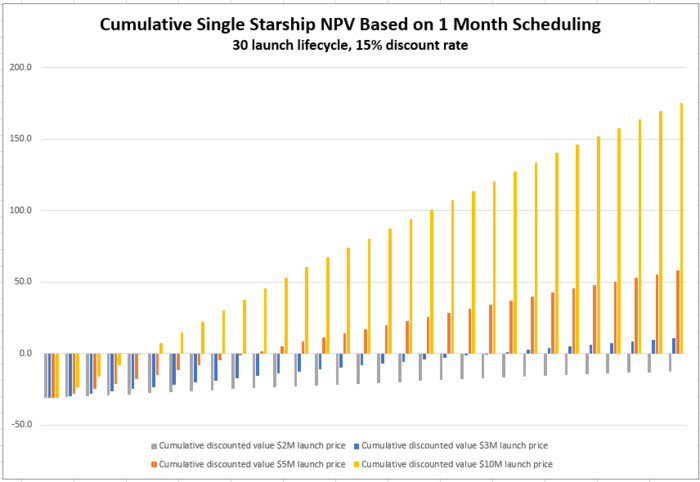
Four different pricing schemes were considered for evaluation. There are public statements from the company CEO that launches will start charging ~$10M per launch on starship, and then decrease over time to possibly as low as ~$2M per launch for the customer. It is worth noting, that currently the cheapest orbital class rocket to launch is a re-used falcon-9 charging ~$40M per launch to a customer. If these figures are even remotely correct, then cost reductions are on the order of a factor of 4 – 20 over the course of starship operation. Payload to LEO capacity will be increased from ~22 tons to ~100 tons, or a similar increase of a factor of 4 or more. Cost reductions of this magnitude paired with capability increases are heretofore never seen in the private launch sector industry.
The first pricing scheme that was considered is $10M per launch – the high-end public estimate by the company. $5M and $3M provide interesting intermediate points, and $2M represents a low-end estimate of what would be charged to the customer. There is a complex relationship that relates launch cadence and viable re-usability amounts (10, 30, and 100 re-flights were modeled) but the results are unsurprising nonetheless. With increased launch cadence and higher reusability all pricing schemes improve in both NPV and DPI.
The $2M price point has a negative NPV for all examined permutations and even cases with incredibly optimistic cost estimates exceeding our normal assumption envelope. Additionally, in our main modeling cases, the $2M price point never exceeds a DPI of 1.0.
Recommendation
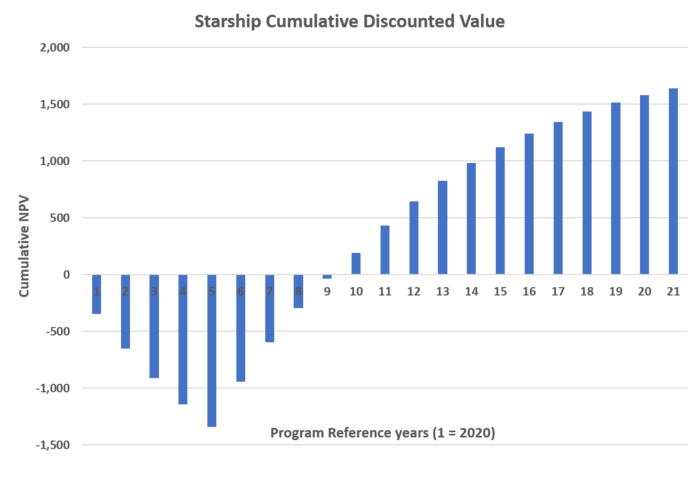
Using our best estimates for pricing and cost scenarios, this project has an NPV of $1.6 billion, and a DPI of 2.09. The cumulative NPV profile is displayed below, highlighting a breakeven point in year 10. The negative portion of the visualization summarizes the R&D expenditure required for the Starship 2030 project. Total R&D for the 3 projects (described in subsequent sections) equals $2.5 billion.
The $10M price point is the best for all financial measures across all scenarios. However, our recommended course would be to take a baseline pricing approach of ~$5M per launch to remain consistent with the stated corporate goal to enable humans becoming an interplanetary species. Afterall, the lower we can drive prices, the more people will be able to use our services. The $5M price point achieves a DPI of 1.21 in the 30-launch re-use case, and an NPV of $35M.
See supporting materials to see the effects of depreciation over time for the different multi-attribute analyses.
List of R&T Projects and Prototypes
Summary
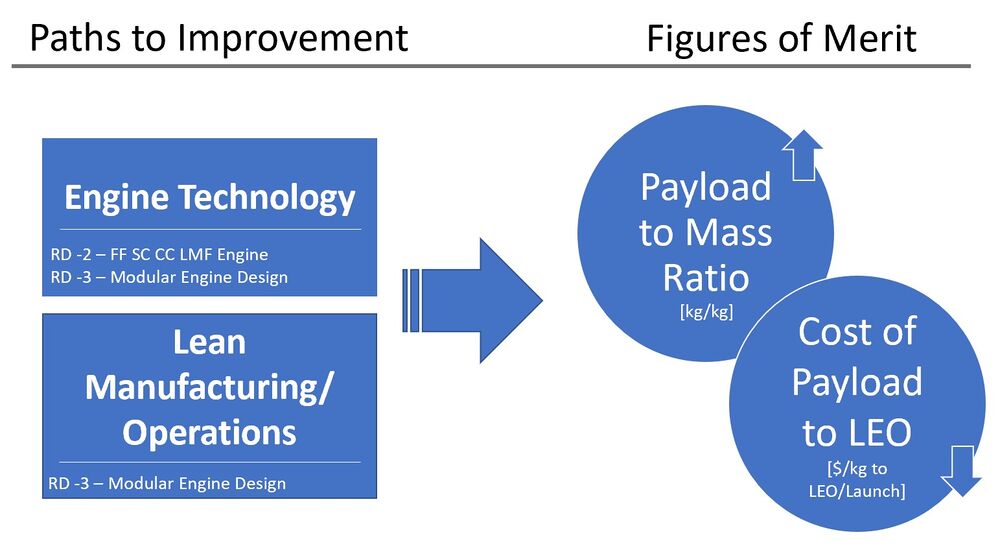
Our technology strategy is to develop an orbital launch vehicle capable of delivering payloads to space at minimal cost. Historically, this has been accomplished by focusing on the payload to LEO and payload to mass ratio figures of merit (how much mass a vehicle can carry and what percentage of the total rocket weight it constitutes). The R&D portfolio presented here aims to further improve these figures of merit, as well as address emerging figures of merit like payload volume to LEO and launch vehicle reusability with the development of the Raptor powered Starship rocket launch vehicle.
Figures of Merit and R&D Objectives
Payload volume to LEO is a figure of merit that measures the payload volume that can be carried to LEO. The Falcon Heavy demonstrated major advancements in the amount of mass a launch vehicle can carry to orbit; however, it does little to address the fact that some payloads are bigger than they are heavy (large optics, habitational modules, space stations, and interplanetary spacecrafts cores).
R&D-1 Starship Fairing Size addresses this by incorporating a larger fairing design in the next generation launch vehicle.
R&D-2– Raptor Engine Design/Configuration aims to increase the payload mass a launch vehicle can carry to LEO by a factor of 6 through more efficient design and higher total engine count.
R&D-3 Modular Raptor Engine will reduce the net cost per launch by reducing refurbishment costs of the Raptor Engine. This will be achieved through a more modular design that is able to take advantage of new facilities that employ assembly line manufacturing techniques.
A summary of the R&D Portfolio is provided below:
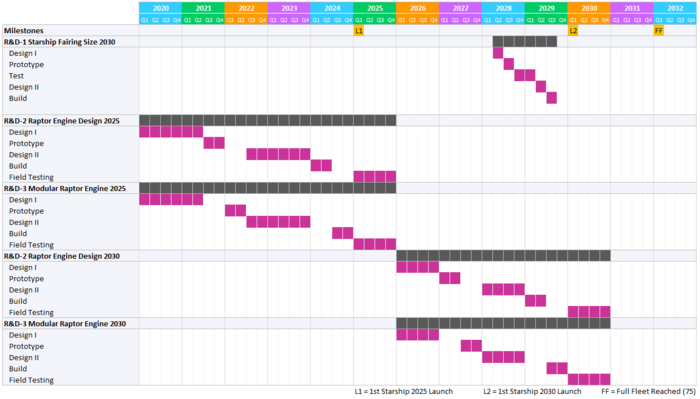
A Gantt chart showing the proposed schedule for the R&D portfolio is presented below:
Technology Statement
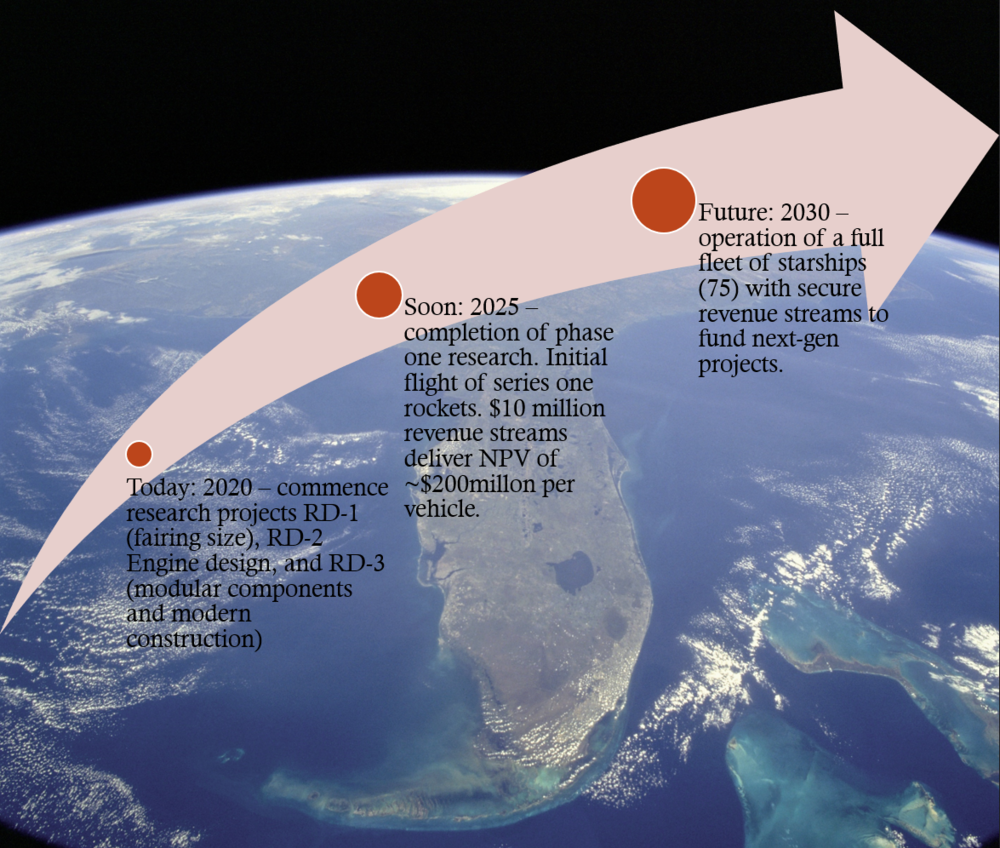
Our target is to develop a new rocket powered launch vehicle capable of delivering 150,000 kg by the year 2030 at a $/kg cost to LEO of under $300. This will be achieved through two R&D projects. The first project (R&D-2– Raptor Engine Design/Configuration) will increase rocket engine efficiency and employ a larger engine configuration on the launch vehicle. The second project, R&D-3 Modular Raptor Engine, will reduce refurbishment cost of the engines by employing a more modular design. Both of these R&D projects will be delivered in phases achieving half of the full-project benefit by 2025 (launch tested), and delivering the remaining value by 2030. Additionally, the company will be funding (R&D-1 Starship Fairing Size) which looks to increase the cargo bay volume on the new launch vehicle by 20% (diameter) by year 2030.
