Recommendation Systems
Roadmap Overview
The exponential growth of computing power has led to an explosion of machine learning and data analytic capability, in turn this lead to a previously unimaginable amount of user data being collected. Because of the market's continuous pressure to deliver what people want recommendation systems have become a critical engine of the modern digital economy, allowing businesses to exploit user behaviors and similarities to develop specific notions of preference and relevance for their customers. Today, recommendation systems can be found “in the wild” in many different services ubiquitous to daily digital life, filtering the content we see (eg Spotify, Tik Tok, Netflix), products we are advertised (eg Instagram, Amazon), and humans we connect to (eg Tinder, LinkedIn). Against the backdrop of Level-1 commercial user understanding or personalization, we develop a Level-2 roadmap for Recommendation Systems (2RS) below.
DSM Allocation
OPM Model
Figures of Merit
Evaluation metrics for recommender systems be sub-divided into metrics that provide a measure of pure accuracy (RMSE, MAE), metrics which measure accuracy related to user preferences (Precision, HR), and metrics which measure accuracy in the context of a ranked list showed to users.| FOM | FOM Sub-Category | Definition | Units | Trends (dFOM/dt) |
|---|---|---|---|---|
| RMSE | Prediction Accuracy | Root Mean Squared Error. Accuracy of predicted ratings used in academic assessments of recommender models | [%] | In the literature, proposed recommender systems have driven towards increases in RMSE over time |
| MAE | Prediction Accuracy | Mean Absolute Error. Accuracy of predicted ratings used in academic assessments of recommender models | [%] | In the literature, proposed recommender systems have driven towards increases in MAE over time |
| Precision | Accuracy - Usage Prediction | Defined as TP / (TP+FP), where TP is the number of True Positives and FP is the number of False Positives | [%] | |
| Hit Ratio (HR) | Accuracy - Usage Prediction | Also referred to as Recall. Defined as TP / (TP+FN). Intuitively, this measure assesses the quality of the predicted ranked list with the ground-truth item set. As this metric varies with the number of recommendations provides, it is often defined as @K, where K is the number of Top recommendations provided by the system, e.g., HR@10 | [%] | In the literature, proposed recommender systems have driven towards increases in HR over time |
| NDCG | Accuracy - Utility-based Ranking | Normalized Discounted Cumulative Gain is a measure from information retrieval, where positions are discounted logarithmically. Unlike HR, which is solely recall-based, NDCG reflects the accuracy of getting the top ranks correct, which is important for many real-world applications. As this metric varies with the number of recommendations provides, it is often defined as @K, where K is the number of Top recommendations provided by the system, e.g., NDCG@10 | [%] | In the literature, proposed recommender systems have driven towards increases in NDCG over time |
| Quantity | -- | Number of recommendations generated by the system for each user | [recommendations] | The number of recommendations systems can generate has increased as the amount of content in the system has increased |
| Inference Time | Scalability | Average time to provide recommendations to one user | [ms] | As models grow increasingly complex in pursuit of greater accuracy and robustness, the runtime of these algorithms naturally has increased. However, the availability of performant chips specially optimized for machine learning tasks has mitigated this to some extent. |
Alignment with Company Strategic Drivers
In this section and the following section, we have focused on the movie recommendation industry.
Several canonical datasets are publicly available to test, evaluate, and compare recommender systems, including MovieLens and Amazon Movies. MovieLens contains several rating datasets collected over various periods of time, depending on the size of the set. Literature in this area widely use MovieLens 100K (ML100K) containing 100,000 ratings from 943 users on 1,682 movies, and MovieLens 1M (ML1M) containing more than 1M ratings from 6,040 users on 3,706 movies. Amazon Movies contains 4,607,047 ratings for movies from Amazon, which is bigger and sparser than the MovieLens datasets and is also used widely in the recommender systems literature. For our assessment of the competitive set of recommender models, we have focused on the MovieLens 1M dataset.
The table below shows the aligned strategic drivers of our hypothetical company and recommender system:
| Number | Strategic Driver |
|---|---|
| 1 | To develop a recommender system that can provide accurate predictions of user preference as measured by HR@10 > 0.75 |
| 2 | To develop a recommender system that can provide an accurate ranking of recommendations to optimize for users who may see a subset of recommendations at a time, as measured by NDCG@10 > 0.5 |
| 3 | To develop a recommender system that can provide recommendations in less than 0.002s per user |
The first and second strategic drivers indicates the company aims to improve the accuracy, specifically user utility prediction accuracy - HR@10 (Hit Ratio of Top-10 Recommendations) of the model and ranking accuracy - NDCG@10 (NDCG of Top-10 Recommendations). The third driver indicates the company also aims to improve the speed of recommendation generation, specifically reducing the amount of time (s) to provide a single user with recommendations.
Positioning of Company vs. Competition
The figures below shows a comparative summary of recommender systems across HR@10 and NDCG@10 FOMs.
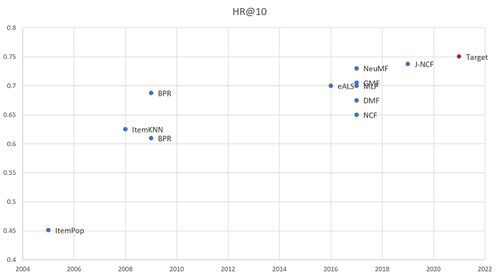
Comparison of Recommender System Models across HR@10 metric over time
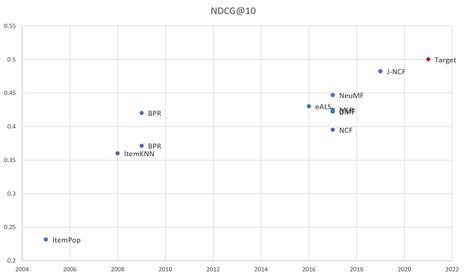
Comparison of Recommender System Models across NDCG@10 metric over time


Our strategic drivers aspire to outperform competing recommender systems across both HR@10 and NDCG@10 metrics.
Additionally, we considered the tradeoffs associated with increased accuracy performance against the system's performance speed. In the figures below, we have summarized the relationship between accuracy FOMs vs. performance speed. Our recommendation system seeks to advance towards to utopia point, decreasing performance time and increasing accuracy.
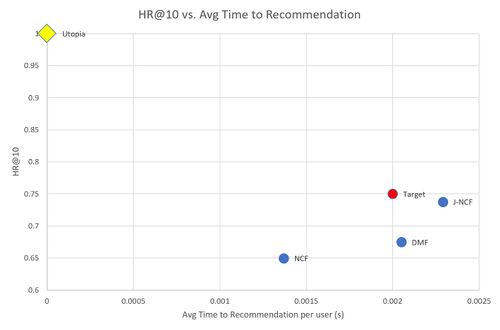
Pareto Front of HR@10 vs Time to Recommendation
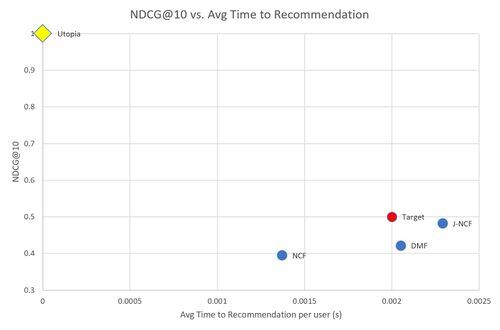
Pareto Front of NDCG@10 vs Time to Recommendation


Technical Model

We had difficulty finding the mathematical basis for a technical model so we decided to determine HR (Hit Rate) sensitivity experimentally. We built a neural network and used it to examine a space of 50 or so user submitted surveys ranking their favorite blockbusters over the past 5 years. We had an average HR of 66% and could improve or worsen the hit rate by fiddling with various parameters as follows:
- Activation Threshold: changing the numerical threshold required for ``recommend vs ``don't recommend
- Learning Rate: changing how quickly the neural net adjusted weights based on incorrect predictions
- Training Iterations: changing how many times training data was repeated. This parameter has an interesting inverse relationship, less reuse resulted in greater accuracy of predictions
- Initial Weightings: By changing the initial weightings the model used we could affect the accuracy as well. The significant impact of this parameter is likely indicative of limited training data and/or an overly simplistic model
- Training Percent: By altering what percentage of response were used for training data and what percent for evaluating the model we could significantly impact the hit rate, interestingly moving the ratio away from 80% in both directions resulted in a higher hit rate, implying we had found a particularly bad split for our baseline.
The model itself can be found at https://github.mit.edu/ebatman/Recommender-System
We can also model sensitivity using empirical results found in academic literature. Here we perform a sensitivity analysis on hit ratio (HR) and normalized distributive cumulative gain (NDCG) by varying two parameters that influence how expressive the model is: the number of latent factors for the user and item vectors, and the number of layers in the multi-layer perceptron.
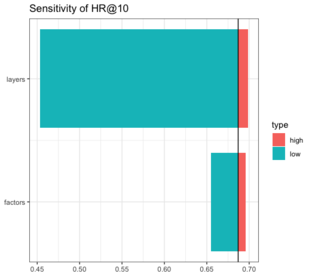
Hit Rate@10 Tornado Chart for Neural Collaborative Filtering
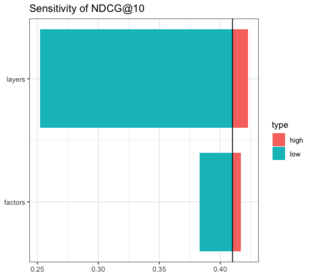
NDCG@10 Tornado Chart for Neural Collaborative Filtering


R&D Projects
To accomplish our targeted FOMs we need to rapidly improve our recommendation architectures along all 3 axes of HR (hit rate), TT (training time) and Inference Serve Time (IST). Several key R&D projects can help facilitate these goals:
| Project | Goal | Description | Pro | Cons |
|---|---|---|---|---|
| Data Preprocessing | Improved Training Time | This project aims to preprocess the training data to extract all/only relevant features for faster analysis |
|
|
| Data Postprocessing | Improved Hit Rate | This project aims to take generated recommendations and prune those that are less promising |
|
|
| Ensemble Recommendations | Improved Hit Rate | Use multiple concurrent recommender systems then synthesize the results |
|
|
| Natural Language Processing | Improved Hit Rate | Utilize NLP to collect more feature data for recommendations |
|
|
| Human In-loop auditing | Client Verificiation | Insert clients earlier into the recommendation system build process in order to get faster feedback and pivot to meet changing needs |
|
|
| Serialized Content | Novel Content Architectures | Modify the existing recommender system or develop a parallel one to handle serialized content like TV shows instead of just movie content |
|
|
The infusion costs of the projects are summarized below using the Serialized content project as a baseline, this project MUST be completed for the business to stay competitive and expand. From here we can clearly see the low risks associated witht eh pre and post processing of data, as well as the higher risk (and also implied value) of the remaining techs.
Based on the infusion costs we would recommend targeting the Serialized Content as well as the data pre/post processing projects as low risk projects. Of the 3 remaining, Ensemble Recommendations are the most impactful and so should be the "radical sustaining innovation" long term project.
Financial Model
Recommender System Company (RSC Inc.) would operate as a service for clients seeking to derive actionable insights for their video-based assets. Clients would commission one-time or ongoing projects with RSC Inc. to design and deploy a customized recommender system based on their needs. RSC Inc. would leverage its state-of-the-art recommender system as the backbone for customization to client requests and data sets. Client projects would be custom priced, however, we envision three major tiers, roughly priced at around $100K, $500K, and $1M+ based on the complexity of the project, size of the dataset, and duration of support. We anticipate an initial upfront R&D spend to develop and refine a robust system of ~$2 M over 2 years to support the launch of an initial service focused on feature-length movies. We anticipate market expansion into develop additional types of video content including serialized video content (e.g., tv shows), independent video content (e.g., Youtube), and short video content (e.g., TikTok). Below we have included more detailed numbers for the estimated costs and revenues for the assessment period of Year 1 through Year 16 (each period is 1 year).
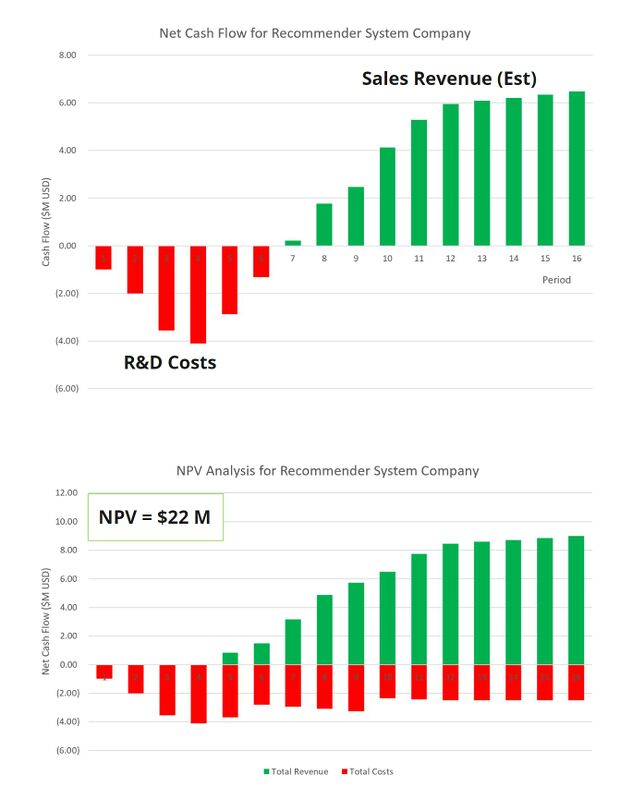
Financial Projections for RCS Inc. (Period of Assessment: Year 1 - Year 16)

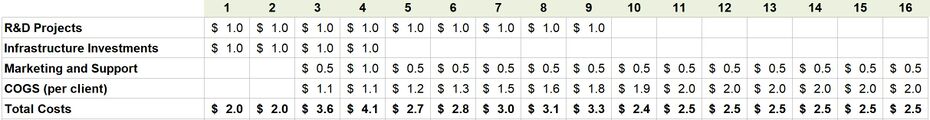
Estimate of Costs for RSC Inc. (Period of Assessment: Year 1 - Year 16)

Technology Strategy Statement
Our target is to develop recommender-as-a-service with an entry into the consumer market of 2022 with a target training time of 36 hours, hit rate (HR@10) of 0.75, and inference serve-time of 0.002 s. To achieve the targets we will invest in R&D projects that build out our offline batch computing and online serving capabilities. Because video analysis is computationally expensive and we expect to be able to leverage rich metadata (likely including natural language input) to learn more expressive representations, we must build out capabilities early on to batch-process input data and host complex models online. We will also build out the infrastructure for multi-phase modeling and active learning pipelines, and build interpretability tools to allow for human-in-the-loop audits of recommendations. With these targets in mind, we aim to offer recommender-as-a-service for feature-length film content by 2022, serial shorter-length video content by 2024, independent short-form video content by 2025, and short unstructured video content by 2027.
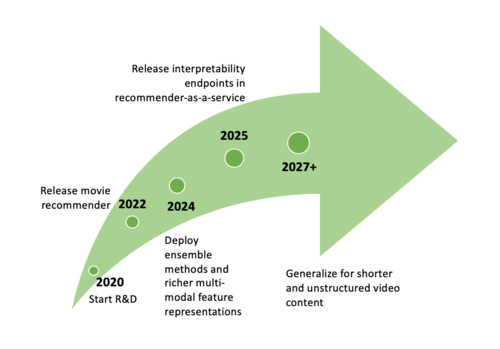
Arrow Chart for Model Development

Key Patents and Publications
Publications
Using Collaborative Filtering to Weave an Information Tapestry (Goldberg 1992) - One of the first publications describing a method of collaborative filtering in an application designed to manage huge volumes of electronic mail using human annotations of electronic documents.
Netflix Update: Try This at Home (Funk 2006) - Influential blog post proposing a matrix factorization algorithm to represent users and items in a lower dimensional space for the Netflix Prize challenge. By learning latent vectors for users <math>p_u</math> and items <math>q_i</math>, matrix factorization estimates user-interaction as the inner product of <math>p_u^T q_i</math>.
A Survey of Accuracy Evaluation Metrics of Recommendation Tasks (Gunawardana and Shani, 2009) - Identifies 3 main tasks in the field of recommendation, Recommending Good Items, Optimizing Utility, and Predicting Ratings, and discusses different evaluation metrics suitable for each task. For recommending good items, metrics like precision, recall, and false positive are suitable. Interestingly, the authors note that summary metrics of the precision-recall curve such as F-measure or AUC are “useful for comparing algorithms independently of application, but when selecting an algorithm for use in a particular task, it is preferable to make the choice based on a measure that reflects the specific needs at hand.” For utility optimization, the authors suggest the half-life utility score of Breese et al, and for the prediction task, RMSE (and others in this family of metrics) are used.
The Netflix Recommender System: Algorithms, Business Value, and Innovation (Gomez-Uribe and Hunt, 2015) - A rare peek into the inner workings of an industry-grade recommender system. Describes the nuances of formulating the recommendation problem correctly for each user-facing feature. For example, the formulation for the Personalized Video Ranker must rank the entire catalog of videos for each genre or subcategory (eg Suspenseful Movies) for each user based on preference. Meanwhile, the Top-N Video Ranker is optimized only for the head of the catalog ranking (rather than the ranking for the entire catalog). Furthermore, recommendation formulations like video-video similarity to support the Because You Watched feature must optimize for content similarity.
SAR: Semantic Analysis for Recommendation (Xiao and Meng, 2017) - Presents an algorithm for personalized recommendations based on user transaction history. SAR is a generative model; it creates an item similarity matrix $S$ to estimate item-item relationships, an affinity matrix $A$ to estimate user-item relationships, and then computes recommendation scores by conducting matrix multiplication.
Neural Collaborative Filtering (He et al 2017) - NCF is a deep neural matrix factorization model, which ensembles Generalized Matrix Factorization (GMF) and Multi-Layer Perceptron (MLP) to unify the strengths of linearity of MF and non-linearity of MLP for modelling the user–item latent structures.
Patents
Our first patent is US20170061310A1, featuring a “Method .. and/or system ... that may be utilized to recommend online content to users”. This patent utilizes diffusion based content modeling as the basis for their recommendation service - the idea being that if a user is going to see content through natural content diffusion (ex they are watching a youtube video from the same uploader), it is unnecessary to present that content via a recommendation algorithm. This patent works to measure the distance between two users on a network graph, calculate the time it would take for content to diffuse from node A to node B and then, if the time is below some threshold value it strikes that potential recommendation, allowing the user to discover it naturally.
The second patent is US20060195362A1, and is the oldest patent on recommendation systems that we could find (priority to 1998). The general idea of the patent is to provide a mapping between two sets of data, then recommend items from the second data set based on user choices within the first set. This patent is the foundation for all current recommender systems. First published by amazon in 2006 it tracks users purchasing habits and correlates them with each other. Then it extends that correlation over the full population data set and finally extrapolates the extended correlation to provide novel recommendations.
The third and final patent we investigated was US20020161664A1 which “generat[es] a set of individualized product recommendations for the consumer”. This patent is unique in that it works to individualize recommendations. Where the other two patents generally look at correlation and try to extrapolate those correlations to new users, this patent describes a mechanism to take said correlations and mould them to the individual receiving said recommendations. The idea behind it being that in addition to the standard mapping that is fed to the neural net; you also make linkages between people who had multiple similar inputs as the targeted individual, and then weight the outputs that those input groups produced more highly.