SCM Inventory
Technology Roadmap
Roadmap Overview
A supply chain management (SCM) - inventory system is a critical component of business operations that ensures efficient flows of materials and products from vendors to customers.
Key Goals of the SCM – inventory management system are:
• Providing timely, complete, and accurate inventory levels to managements • Minimizing carrying costs while ensuring product availability. • Reducing stockouts and overstock situations. • Enhancing supply chain visibility and responsiveness. • Streamlining operations and reducing inefficiencies. • Lowering costs while maintaining service levels. • Meeting customer demand accurately and on time. • Adapting to changes in demand, supply, and market conditions.
Effective management systems provide the right products at the right time and place to meet growing customer demand. It is a critical aspect of modern business operations and plays a crucial role in achieving profitability and customer satisfaction.
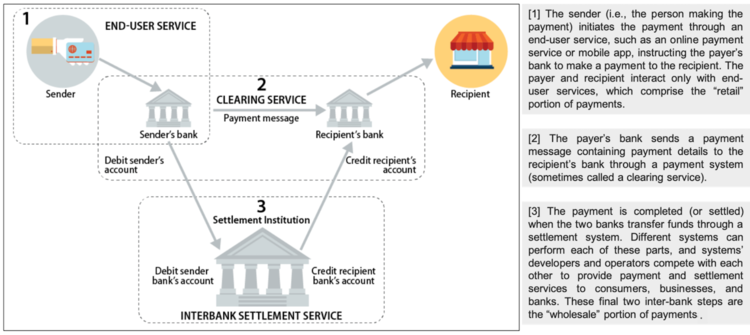
*image-source - U.S. Payment System Policy Issues: Faster Payments and Innovation, Congressional Research Service (2019)
Design Structure Matrix (DSM) Allocation
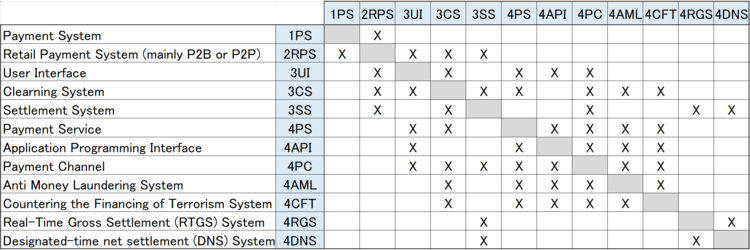
The design structure matrix for the Retail Payment System is depicted in the image below.
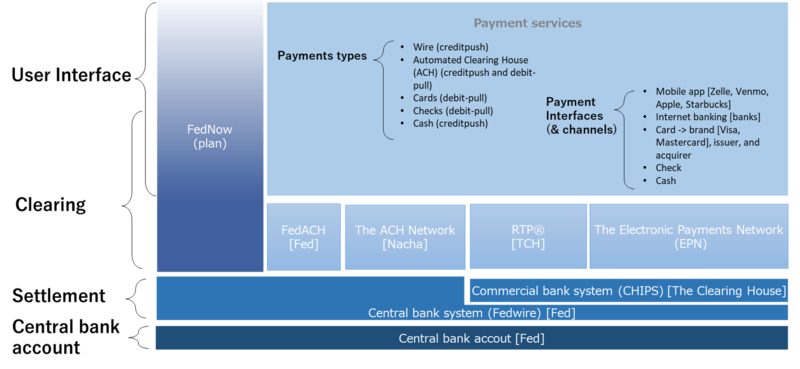
The following figure shows the tree structure of the Retail Payment System. Our roadmap focuses not on the wholesale payment system, but on the retail payment system. The API is optional and it is not included in all payment systems.
Object Process Model (OPM)
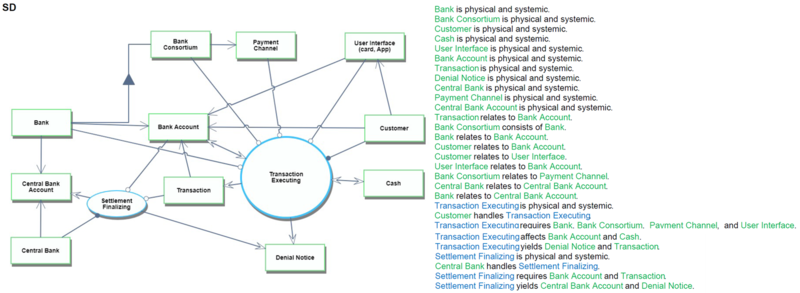
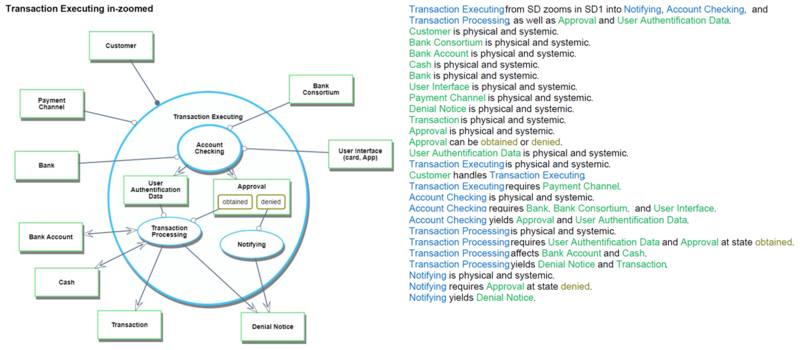
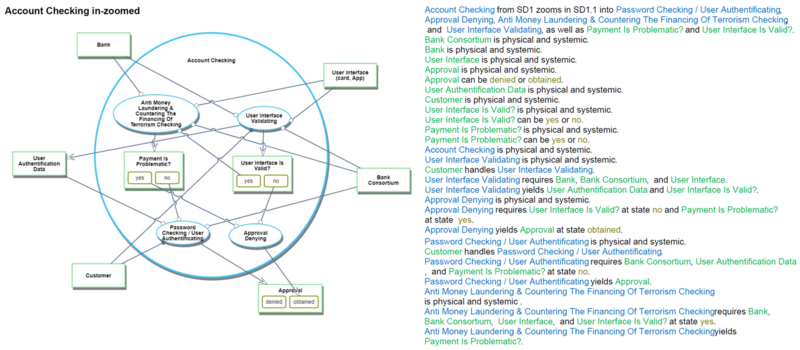
The following picture shows the whole OPM for the retail payment system. These OPM diagrams in the picture are designed referring to the example of Appendix A in the book "Object-Process Methodology A Holistic Systems Paradigm" written by Dov Dori.
The following diagrams show each OPM for the retail payment system.
Figures of Merit (FOM)
The table below show a list of FOMs by which can assess a Payment System:
| Class | Figure of Merit | Units | Metric |
|---|---|---|---|
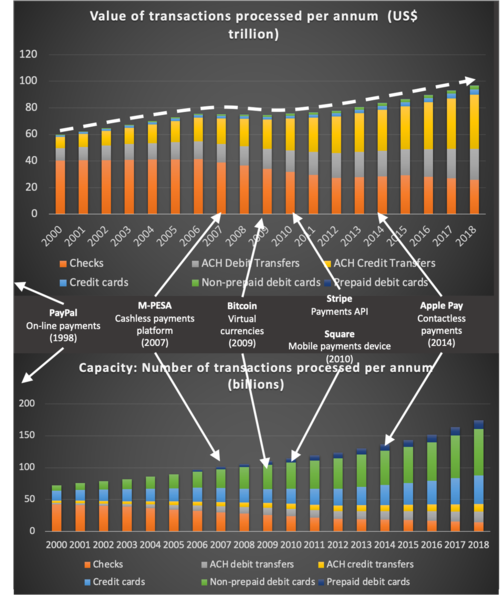
| Performance | Value of transactions processed per annum | [US$] | Monetary value of all transactions processed per annum. |
| Productivity | Number of transactions processed per annum | # of transactions processed per country, per individual or business client type | Count of the number of transactions processed per annum. |
| Machine learning accuracy | Weighted False Positive ratio | <math>\sum_{i=1}^{Systems} Weight_i \frac{FalsePositives_i}{(FalsePositives_i + TrueNegatives_i)} </math> | |
| Efficiency | Average cost per transaction | [US cents] | The total Earnings Before Interest and Tax (Tax) divided by the Number of transactions processed per annum |
| Transaction settlement period | [Seconds] | The time lag between the payment initiation of the payment order and its final settlement. | |
| Sustainability | System downtime per year | [Seconds] | The seconds in a year is that the system is not online and processing successfully, i.e., not “up and running”. |
| Payment conversion rate | [%] | # of settled transactions per annum / # of attempted transactions per annum | |
| Fraud prevention | [%] | # of fraudulent transactions / # approved transactions |
