Wearable Health Fitness Watches
Roadmap Overview
Wearable health/fitness technology has been around since 1268, when the first documented use of eyeglasses was recorded. While wearable health/fitness technology has come a long way since 1268, it was only in the last two decades that wearable health/fitness technology has become mainstream and widely used. The initial and generally adopted wearable health/fitness technology that hit the market in 2003 came in the form of watches, particularly the Garmin Forerunner 101, which was equipped with technology that measured speed, distance, pace, and calories burned. It would be almost another decade before smartwatches with health/fitness sensors integrated into them would be available. When smartwatches with health/fitness technology appeared in the early 2010s, they became almost an overnight sensation. Smartwatches with health/fitness technology have become wildly popular because they allow the wearer to track their health/fitness levels with a single device around their wrist. In addition, smartwatches are multi-purpose with other functionalities the wearer may use, and they serve as both a fashion and status statement.
Today wearable health/fitness technology has morphed to include smart jewelry such as rings and bracelets; for this technology roadmap, the focus will specifically be on health/fitness technology in the form of smartwatches.
The unique identifier for this technology road map is: 2WHFWT - Wearable Health/Fitness Smartwatch Technology.
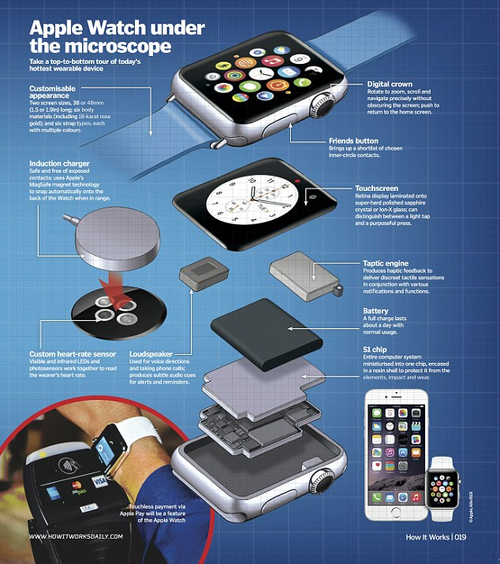
This indicates that we are dealing with a “level 2” roadmap at the product level where “level 1” would indicate a market-level roadmap, “level 3” would represent the subcomponent roadmap, and “level 4” would indicate an individual component roadmap. At the product level, wearable health/fitness smartwatches typically comprise a watch band and a watch device. The watch device includes a housing unit, screen, battery, heart rate sensor, temperature sensor, accelerometer, and computer processing unit.
Note, the graphic above is specific to the Apple Watch product and is meant to serve as an example of all the components involved in a Health/Fitness smartwatch.
Design Structure Matrix (DSM) Allocation
The roadmap hierarchy to the left on the figure below shows the location of the wearable health/fitness monitoring device (2WHFWT). The DSM shows the 2WHFWT and its relationship to the level 1 item above and respective level 3 components. The level 2 health/fitness devices are separated as being wired components and wearable (non-wired) components (watches).
Roadmap Model using OPM
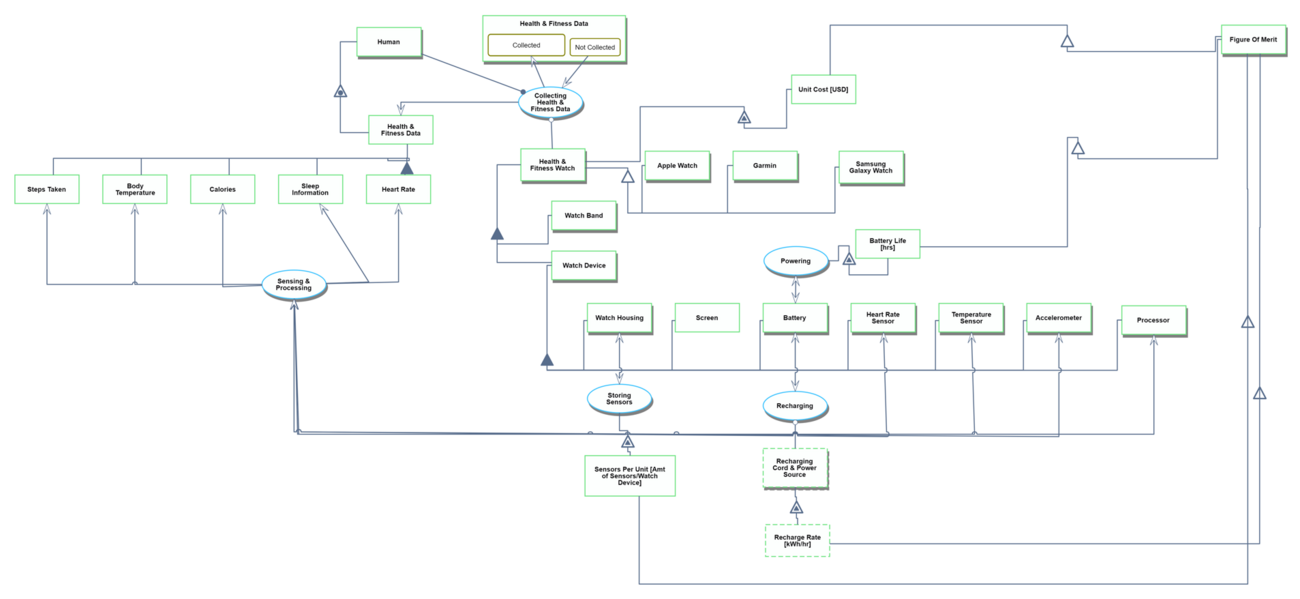
Below is an Object-Process-Diagram (OPD) of the health/fitness smartwatch technology (2WHFWT) roadmap. This diagram captures the main object of the roadmap (Health/fitness Smartwatch), its various instances, including the main competitors, its decomposition into components and subsystems (sensors, processor), its characterization by Figures of Merit (FOMs) as well as the main processes (collecting health/fitness data, sensing/processing, powering, etc).
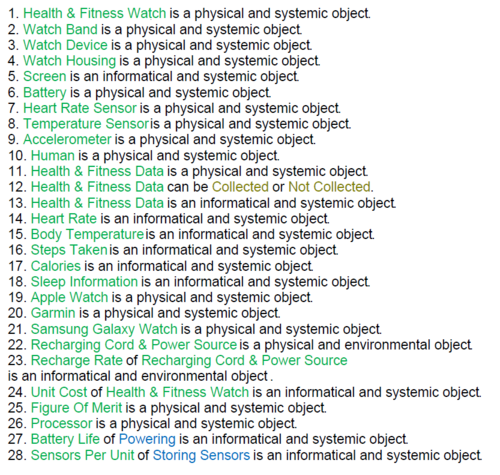
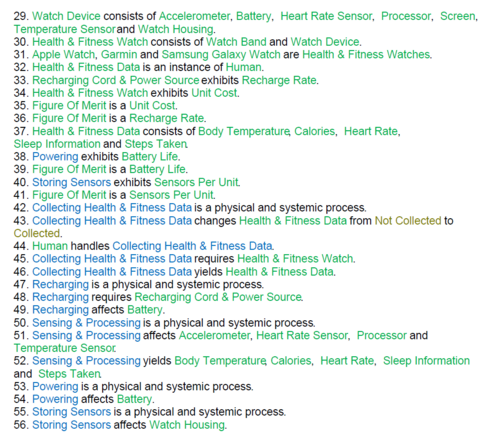
An Object-Process-Language (OPL) description of the roadmap scope is auto-generated and provided below. It reflects the same content as the previous figure but in a formal natural language.
Figures of Merit (FOM)
The table below shows a list of FOMs by which health/fitness smartwatches can be assessed. The first four (shown in bold) are mapped in the Object-Process-Model above.
The Figure of Merit selected for this analysis is sensor density: the number of discrete sensors carried by one product, in units of “sensors per unit”. Figure 1 below presents this FOM for leading market technologies over the past 10 years.
Fitbit sensor densities were discarded from further analysis for modeling and projection purposes, as they were assessed to be within a separate (and less technologically complex) subset of wearable health/fitness devices: fitness trackers.
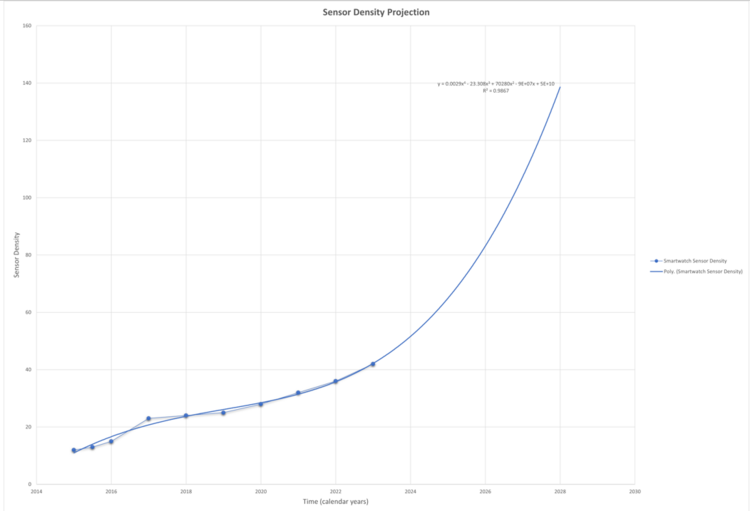
Despite a relatively short time horizon and limited data, projections for continued sensor density growth were modeled using multiple quantitative methods, including linear, exponential, polynomial, and least squares regression analysis.
Figure 2 below adds a best-fit trendline for health/fitness smartwatch sensor density and projects continued exponential growth over the next 5 years.
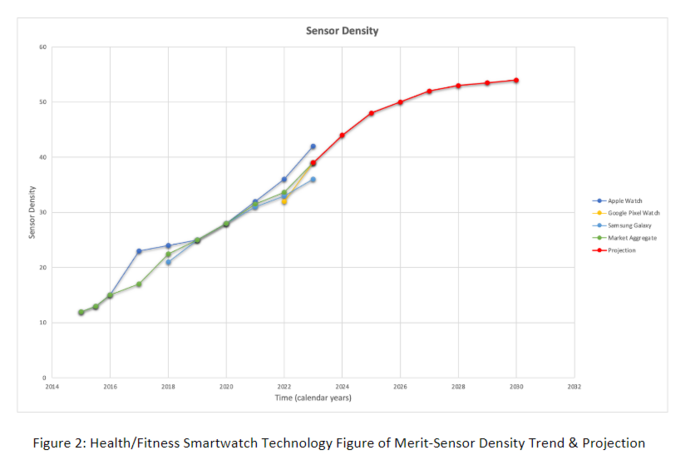
Technological constraints and market analysis were also considered for a quantitative analysis. While quantitative projections showed continued exponential increases in the sensor density FOM fitting the “rapid progress” portion of the classic S-curve, several theoretical constraints have been applied in this model, significantly reducing growth as a theoretical limit in the range of 58 is approached. This would represent approximately 40% growth in sensor density relative to the 2023 market aggregate of 39. There are two primary constraints on continued improvement driving this theoretical limit:
- Battery Life: The use case for this technology is a portable wearable device. This places significant size and weight restrictions on design. Battery life has long been a leading constraint for health/fitness smartwatch design and market appeal. The rapid addition of new sensors, functions, and processing requirements comes with increased power consumption rates placing additional strain on battery life. Extensive market research indicates customers won’t tolerate a battery life below a ~1-day functional cycle, and we are approaching that limit where this becomes a constraint. Data on battery performance is highly variable, and performance varies greatly with use; however, the leading models currently on the market advertise a battery life of 18 hours. Advances in processing technology and efficiency may extend the continued growth of this FOM, until breakthroughs improving upon lithium polymer or lithium-ion batteries, or mobile and faster recharging options, are achieved.
- Sensor & Function Saturation: There is a theoretical limit to the amount of data that can be applied in a meaningful way that translates to value customers are willing to pay for. Most recent functional additions have been centered on the medical and fitness fields (heart rate, body mass index, blood oxygen); using standard medical visits and assessments as a benchmark, we are fast approaching sensor and function saturation for the general population.
Figure 3 below presents our qualitative projection with a market aggregate line in green, and our projection in red.
This is a very interesting time for wearable health/fitness device technology and smartwatches in particular. Figure 4 below presents our placement of the health/fitness smartwatch on the technology lifecycle (de Weck, 2022), currently in “Rapid Progress” but projecting the slowing phase may arrive within the next 5 to 10 years.
While known constraints have led us to place a theoretical limit on the continued growth of sensor density, several potential growth factors have the potential to extend both the duration of rapid growth and the theoretical limit of sensor density. Health/fitness smartwatches carry significant instrumentation and capabilities; however, they also serve as a powerful integrator of other technologies into a single wearable device. This allows external advancements in connectivity, machine learning and artificial intelligence, and processing to drive new functions into the relatively compact smartwatch device.
Alignment with Company Strategic Drivers
Market Summary. The current global smartwatch market size is $29.31 billion. Analysts project continued aggressive growth, forecasting a Combined Annual Growth Rate of 14.84%, resulting in a $77 billion global smartwatch market in billion in 2030 (Ref 1). In alignment with Figure 3’s placement of the smartwatch in the exponential growth segment of the technological life cycle S-curve, Figure 4 lends important context to our company’s strategic drivers by presenting recent market size trends and projections (North America).
2WHFWT Company Strategy. Smartwatch technology is experiencing exponential growth in multiple dimensions: market share, product capability, and technological complexity. Our forward-looking vision maximizes market share through aggressive, sustained investment in innovation and user experience at competitive prices. 2WHFWT’s mission
Enhance lives through innovative and stylish smartwatches, promoting health, efficiency, and connectivity. Drive innovation within health, wellness, and medical communities
Strategic Goals to achieve this mission are presented in the table below. Each goal is evaluated against this technology roadmap, Figures of Merit are listed in bold.
Position of Company vs Competition
The smartwatch market is highly competitive, and leading companies include Apple, Samsung, Google (Fitbit), and Xiaomi. The table below presents the market share of wearables, measured by shipments, over the past 9 years.
Competitive analysis of this technology centers on two key Figures of Merit: Sensor Density and Battery Life. Battery life is a critical but highly variable factor, heavily influenced by the particular use case of the smartwatch. Most companies limit the published information regarding battery life, and the information they do publish is heavily qualified. Given the size and weight constraints associated with the User Experience strategic goal, the Battery Life FoM has seen very limited growth. However, it is notable that after 10 consecutive years of advertising the same approximate battery life since inception (10 consecutive years at 18 hours), Apple’s most recent Apple Watch in 2023 advertised a 200% increase in battery life: 36 hours.
Sensor Density provides highly relevant insights into the progress of the overall technology itself, as well as relative progress amongst the primary competitors. The table below presents the evolution of Sensor Density since market inception, broken out by lead products of the primary competitors: Apple Watch, Samsung Galaxy Watch, Google Pixel Watch, and Fitbit Charge. Data from Xiaomi’s line of products could not be located.
Technical Model
The list of FOMs that we’ve developed for smart watches is given in the table below and taken from a previous PSet. Sensor accuracy and how they play into calculating health data for the user were difficult to find since the majority of this information is proprietary for each of the vendors.
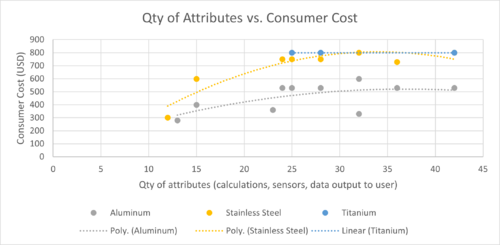
Cost FOM: Qty of Attributes vs. Consumer Cost: Since the majority of data is proprietary, we plotted data to determine the existence of any trends. Looking at volume of attributes vs. cost in the plot below, it looks like early in the development in the stages of moving from 15 attributes to 25 attributes, there was an increase in consumer cost. Following that large increase, increased cost to the consumer has not occurred at the same rate.
Cost FOM: Display Size vs. Cost: The cost of the display leads to an increase in the overall consumer cost, however, since the cost increase per material is not the same, it looks like there may be other factors to consider, such as changes in housing material needs, such as thicker or thinner housing material. Display type stays consistent with OLED Retina as the option, so it’s interesting to see these trends.
Comfort FOM: Display Size vs. Weight: Display size does affect the overall weight of watch, and is shown below. The difference is more evident for heavier or more valuable materials like stainless steel and titanium. It’s likely that as the screen size gets larger (even though it’s minimal) it could be enough to effect the structure of the watch and require a slightly different internal design, or a change to the thickness of material used (even though to a user, the size on their wrist for an 1000mm2 screen looks and feels the same from a size perspective, the weight could feel much different, especially as the screen gets larger, the difference appears to be more pronounced.
Comfort FOM: Generation vs. Weight: Looking at the smart watch generation vs weight component also shows some interesting data. The first generation of the smart watch was made of stainless steel, and it appears that this material has the most fluctuation of weight over the other two materials. After doing some research on the weight of a typical wrist watch, those tend to weigh between 56-85grams, this makes sense that the manufacturer would like to keep the watch at or below these weights to make it more enticing to the consumer.
Tornado Chart & Sensitivity Analysis:
Key Publications and Patents
Key Publications Three key publications that have been written about wearable devices are summarized below.
Shaping The Future of Cardiovascular Medicine in the New Era of Wearable Devices This paper presents an argument for positioning wearable devices, particularly smart watches, as medical devices instead of lifestyle gadgets. A clinical outlook highlights existing and potential applications, including prevention, diagnosis, and management of a broad range of cardiovascular diseases. The disruptive potential of smartwatches within MedTech is fundamentally tethered to the shift from discrete and labor-intensive diagnostics to continuous monitoring integrated within users' everyday lives. Finally, the large volume of data generated by smartwatches introduces fundamentally new possibilities: machine learning and big data approaches to analyses may drive the discovery of new biomarkers for early medical diagnosis and prediction of disease progression.
Citation: Gehr, S., Russmann, C. Shaping the future of cardiovascular medicine in the new era of wearable devices. Nat Rev Cardiol 19, 501–502 (2022). https://doi.org/10.1038/s41569-022-00729-2
The 2023 Wearable Photoplethysmography Roadmap Photoplethysmography is a sensing technology that has become ubiquitous in smartwatches, capable of monitoring physiological parameters such as heart rhythm and rate, and also tracking and analyzing user activities such as exercise and sleep. This paper explores the technical capabilities and medical applications of photoplethysmography technologies. Concluding there is significant as of yet untapped potential to generate clinically significant medical information, the roadmap organizes forward looking directions for research and development to focus in order to develop and apply wearable photoplethysmography to it’s full theoretical potential.
Citation: Charlton, P. et al. The 2023 wearable photoplethysmography roadmap. Institute of Physics and Engineering in Medicine. Accepted Manuscript 2023 Physiol. Meas. In press https://doi.org/10.1088/1361-6579/acead2
Detecting Parkinson’s Disease from Wrist-Worn Accelerometry in the U.K. Biobank This paper explores one of many actively developing novel medical applications of smartwatch data: early detection and diagnosis of Parkinson’s Disease. This paper was selected to compliment the final note offered by Gehr et al (2022), predicting that big data and machine learning may introduce fundamentally new possibilities in disease detection and diagnosis. This study utilized readily available accelerometry data and machine learning classifiers to analyze 1 week of smartwatch-generated data from sample populations with and without Parkinson’s Disease diagnosis. A net classification accuracy rate of 85% was achieved, with classification accuracy steadily improving across the period of data collection suggesting that higher accuracy could easily be achieved over longer data collection periods. This study serves as a proof of concept to motivate further research. Citation: Williamson JR, Telfer B, Mullany R, Friedl KE. Detecting Parkinson’s Disease from Wrist-Worn Accelerometry in the U.K. Biobank. Sensors. 2021; 21(6):2047. https://doi.org/10.3390/s21062047
Patent Information
The United States Patent and Trademark Office (USPTO) database contains extensive patents relating to smartwatch technology components. Figure 1 lends context to the overall patent landscape related to smartwatch technology, illustrating both the volume and the growth of patents in the wearable technology sector. As of December 2021., the 10 companies listed below collectively held a total of 16,902 patent families related to wearable technologies (a patent family is a grouping of documents that share the same set of priorities and protect the same invention across multiple authorities).
Amidst this highly dynamic and competitive patenting environment, four specific patents were selected to represent different frontiers of interest:
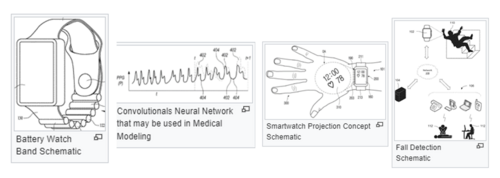
- The battery patent speaks to the primary technological constraint for state of market devices
- The projection patent speaks to the potential for modularized functionality stacking driving rapid evolution and adoption of this technology
- The health monitoring patent speaks to broad potential application as a MedTech device
- The fall detection patent speaks to the use case of active interventions.
Table 1 provides summary information of the selected patents. USPTO Cooperative Patent Classifications (CPC) are included, noting some patents carry multiple CPCs, primary classifications are presented. A brief summary and discussion of each follows.
Battery Watch Band
A smartwatch band that is capable of housing batteries and transferring power from the batteries to the watch body to power the watch. This has not been implemented on the market yet, however as the technical capabilities of smartwatches continue to exhibit exponential growth, battery life and capacity is a critical limiting factor on further development.
Wearable Electronic Device Including Projection Display A compact projector integrated into a smartwatch device. Projector is capable of projecting information, including video, onto a nearby surface. Information projected may mirror device screen, or complement it. Potential use-cases included the wearer’s hand as pictured, or larger surfaces for shared viewing.
Continuous Monitoring of a User's Health with a Mobile Device Traditional medical approaches are oriented around discrete health indicators: a health figure of merit (i.e. heart rate, or blood pressure) at a given point in time. The evolution and popularity of smartwatches introduces continuous monitoring of health indicators, however the volume of data collected often exceeds the processing capabilities of conventional medical science. Certain medical conditions may occur intermittently, like arrhythmias for example, meaning traditional discrete methods may fail to detect them. However, these intermittent conditions may be easily detected via continuous monitoring.
Continuous Monitoring of a User's Health with a Mobile Device A combination of sensors, processing, and signals to achieve passive identification of falls and/or vehicle crashes. This patent also covers the capability to automatically notify emergency services, proving location as well as contextual information such as behavior preceding falls, relevant vital signs and health data.
Financial Model
The figure below shows the NPV analysis for only one of the brands of smartwatches, the Apple Smartwatch. The cost includes the cost of materials/fabrication, as well as R&D cost. R&D cost is assumed to be proportional to the percentage of sales revenue, i.e.: 3% of Apple Revenue comes from Apple smartwatches, therefore, 3% of R&D funds are allocated to the Apple Smartwatches. The investigation is ongoing to determine the availability of pre-launch R&D funds for the Apple Smartwatch; if not found by the final presentation date, an amount of approximately 3% of revenue will be used for 2-4 years prior to the launch of the first Apple smartwatch.
R&D Projects
The smartwatch market is extremely competitive and projected to remain so for the next 10 years. In a market largely defined by rapid technological development and innovation, research and development is a key competitive differentiator. Apple, the maker of the Apple Watch (market leader in gross revenue and Sensor Density), invested an unprecedented $29.9B in Research and Development in 2023 alone; this represents just under 8% of gross revenue (1). The closest smartwatch competitor is Samsung, and while 2023 filings are not available at the time of this posting, Samsung invested $18.2 billion in Research and Development in 2022 (relative to Apple’s $26.2 billion) (2). The figure below highlights Apple’s Research and Development investments relative to growth revenue over the past 18 years.
While top-line R&D investments for public companies are published annually, detailed breakdowns, including smartwatch-related allocations, are not. The development of this technology is unfolding in real-time in a highly competitive environment, so details are limited. We can observe sustained innovation in the marketplace by the exponential rate of increase in Sensor Density, which is complemented by the patent research presented in Section ## to illustrate that significant R&D project investments have and will continue to fuel the development of Smartwatch technology. Absent additional details from the marketplace, we present a synthetic R&D strategy and portfolio based on this technology roadmap.
Table one summarizes the resultant 2WHFWT Research and Development portfolio:
Technology Strategy Statement
A technology should conclude and be summarized by both a written statement that summarizes the technology strategy coming out of the roadmap as well as a graphic that shows the key R&D investments, targets and a vision for this technology (and associated product or service) over time. For the 2WHFWT roadmap, the statement could read as follows and is displayed in an Arrow Chart.
Our target is to continue the development of smartwatch technology and integrate more capable features. By 2040, we want to provide a smartwatch that has up to 120 hours of battery life, for health/fitness monitoring, without adjusting power modes, a new innovative way to recharge the battery, and a brain-machine interface that enables smartwatch control through thoughts and could monitor brain activity in order to alert the wearer to adverse health event. These developments will enable us to reach our 2040 technical and business targets. Reference the arrow graphic below for target dates.
