Wind Turbine - Energy Harvesting
Technology Roadmap Sections and Deliverables
Team 3 is to present a "level 2” roadmap of Wind Turbine Generators. The following code is the identifier.
- 2WTG - Wind Turbine Generator
Roadmap Overview
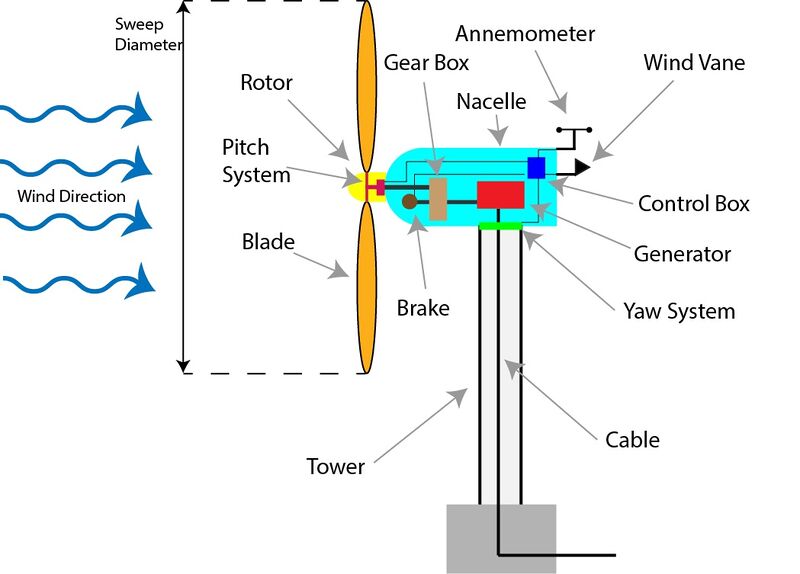
Wind turbines are used to harvest kinetic energy from the wind and transform that energy into electricity. A rotor, typically with three airfoil blades, rotates using the force of lift. A system of gears is used to transfer the rotational energy of the hub to a high-speed shaft which feeds into a generator. The generator then utilizes the rotational energy to generate electricity and deliver it down the tower through a cable. An anemometer and weather vane are used to determine the wind speed and direction. The data that is collected is processed in the control box, which then adjusts the pitch of the blades and yaw of the nacelle for optimal operating conditions. Wind turbines can be assembled on land or water and usually generate energy proportional to their sweep area.
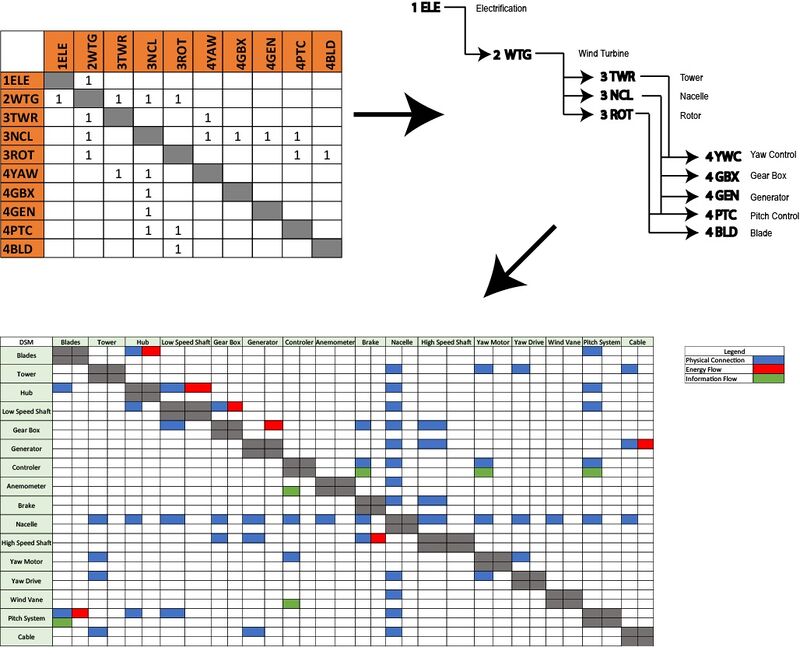
Design Structure Matrix (DSM) Allocation
The 2-WTB tree in the upper right corner displays some of the key components of a wind turbine (2WTB), that when individually improved, enhance the overall performance and figures of merit of the wind turbine. The wind turbine can be broken down into its three main portions: a tower (3TWR), a nacelle (3NCL) and a rotor (3ROT). The three main wind turbine parts stand on the shoulders of other technologies, which if removed or damaged, can significantly affect the wind turbine. The tree can then be expanded into a more complex matrix that shows how most of its components are interconnected. Many of the parts are connected physically, some transfer energy, and others share information. The tree also exposes the purpose of the wind turbine itself, which is to aid in overall electricity generation or electrification (1ELE). Wind turbines can be combined into wind farms which together can replace a carbon releasing power plant.
Roadmap Model using OPM
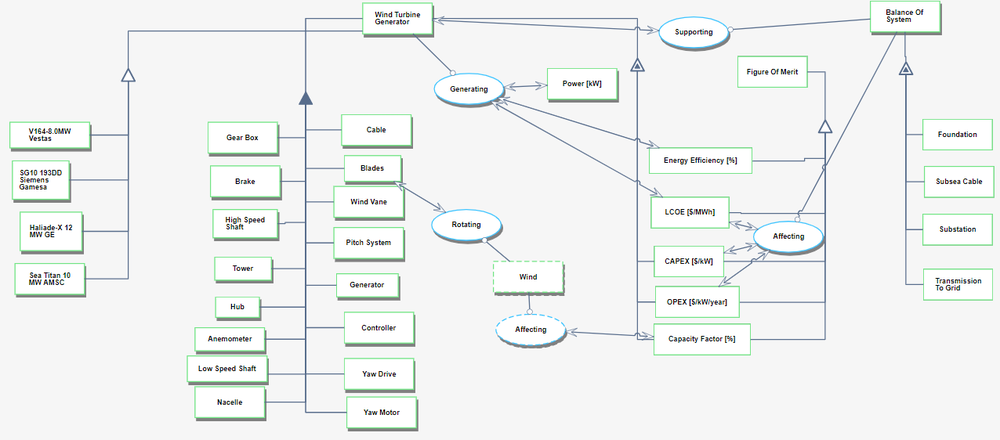
Team 3 hereby displays OPD of 2WTG - Wind Turbine Generator (WPG) This consists of level 2 decomposed WTG, associated products and figure of merit (FOM).
Associated OPL is displayed below. This represents the relationships among each object shown in the OPM above.
Figures of Merit
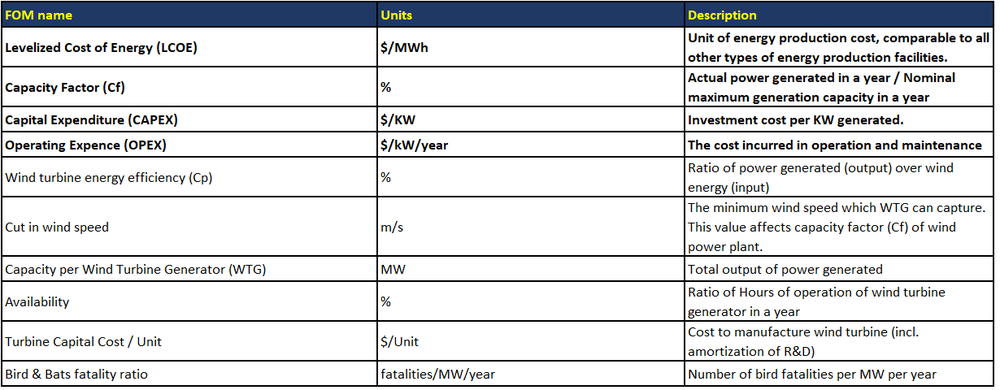
The table below is to show a list of FOMs of 2WTG.
The unit cost, and capacity per wind turbine are both extremely important figures of merit. When looking into what wind turbine to buy, these would influence which brand and model should be purchased. While one wind turbine may be significantly cheaper than another, the capacity of a more expensive turbine might be much greater. It is also important to consider the availability of the turbine. This is essentially average hours of operation due to unfavorable wind conditions. There is a range of wind speeds any turbine can operate at, from the cut in wind speed at the lower end of the range, to the maximum safe operating speed at the high end. The region in which a wind turbine is assembled affects the availability of the turbine, but by expanding the operational wind speeds, the availability can be increased.
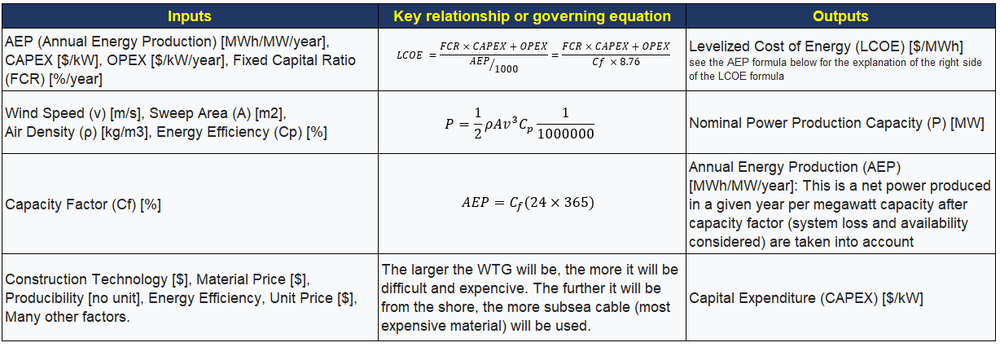
Furthermore, a couple of detail FOM with related formula and relationship is shown in the table below.
Alignment with Company Strategic Drivers
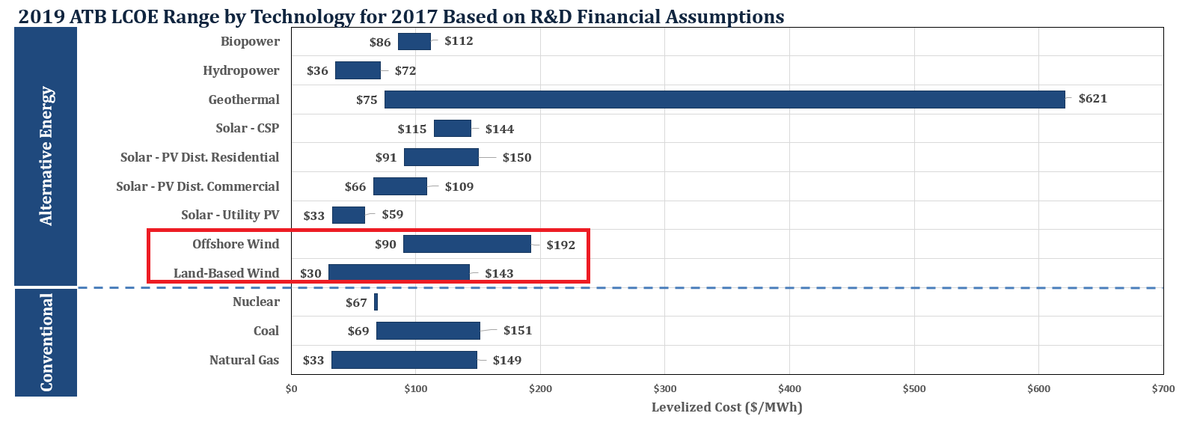
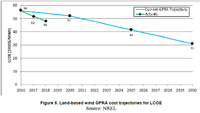
Our company acts as a wind farm developing contractor who seeks to propose to the government or power distributors exploring cost-efficient wind farm developments. The Figure of Merit (FOM) that directly represents the price of unit energy production - and, thus, represents the highest return on investment - is Levelized Cost of Energy (LCOE). The reduction of this figure means that the product can produce energy at a cheaper overall price.
https://data.nrel.gov/submissions/115
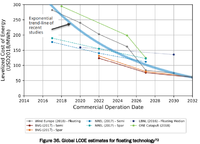
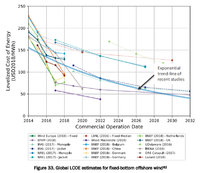
The reduction of LCOE is the everlasting goal for all power generation technologies. Today, wind power generation technology is in a relatively competitive position among other types of power generation. However, wind energy still does not explicitly represent an economic advantage over others/ Offshore wind power technology needs drastic improvement to thrive in the market. To make wind power a more beneficial source of energy, all stakeholders including turbine makers, main contractors, and wind farm owners must corporate and scrum together to develop the overall better technologies to achieve lower LCOE. To achieve lower LCOE, what most effective route is to reduce CAPEX and OPEX as well as increase Capacity Factor. Each of the factors listed above is impacted by multiple elements that compose wind farms.
| Strategic Driver | Alignment and Target |
|---|---|
| To keep competitive position in all other power generation stakeholders, off-shore wind sector needs to reduce its LCOE to be 50 [$/MWh] for offshore fixed plant and 80 [$/MWh] for offshore floating plant by year 2030. | To achieve the designated LCOE targets on the left, following targets in each respective factors are required to be achieved by year 2030.
For off-shore (fixed) wind plants, CAPEX to be 2000 [$/kW], OPEX to be 60 [$/kW/year], Cf to be 50%. For off-shore (floating) wind plants. CAPEX to be 3000 [$/kW], OPEX to be 50 [$/kW/year], Cf to be 50%. |
Positioning of Company vs. Competition
The Horns Rev 3 farm currently has the best CAPEX where as the Wikinger has the highest CAPEX. Race Bank has a high capacity factor with 60% and closely followed by Arkona and Wikinger . The Pareto Front (See next section under technical model)shows the best tradeoff between CAPEX ($/KW) and Capacity Factor (CF) for actual wind farm companies. In new projects in 2018 and 2019, Norther Offshore Wind and Rentel wind farms are on the pareto front with Norther Offshore Wind competing strongly for a lower CAPEX and Rental doing better in the Capacity Factor.
Technical Model
To make the most cost-effective wind farm with the highest return on investment (ROI), LCOE is the key value to be pursued.
It is important to note that CAPEX and Capacity Factor are the 2 major factors in which LCOE is sensitive.
The sensitivity study by the usage of the partial derivative method resulted in a tornado chart shown below.
This shows that the LCOE sensitivity against CF = 1.0, LCOE sensitivity against CAPEX = 0.7 to 0.84.
The Tradespace study for Off-shore (Fixed) Wind Farms is commenced as follows.
It is interesting to see that CAPEX and CF have not been drastically improved from 2005 to 2017.
Technical reasons are referred to in "NREL (2015): 2014-2015 Offshore Wind Technologies Market Report" as follows.
Quote ----
- Increasing technical difficulties of installing turbines in deeper water, farther from shore, and in more demanding met-ocean conditions (e.g., wind speeds, wave heights, and currents), which pose challenges for both technical design and construction
- Shortages in the supply chain (e.g., components, vessels, and skilled labor)
Unquote ----
To optimize LCOE, there are many options to choose in designing wind-farms. The following table shows the options that we are going to focus on for design optimization.
After a certain level of research we made, we came to understand the potential impact that CAPEX and OPEX have for reduction of LCOE exceed that Capacity Factor due to following reason.
The sensitivity of the Capacity Factor (CF) is certainly higher than that of CAPEX, however, the potential of improvement value is higher in CAPEX and OPEX, thus, the overall potential to provide a larger positive impact on LCOE could be said as CAPEX and OPEX rather than CF.
<Caluculation basis of the Reason>
The technology to improve Capacity Factor (CF) has been brushed up over time by many wind turbine makers all over the world until Today, spending millions of money. However, as is shown in the current R&D list shown in clause "1.9 List of R&T Projects and Prototypes" below, the range that CF could possibly be improved is very limited- such as 2.5 to 5.5 [%]. Whereas the range of potential reduction of CAPEX and OPEX is as high as CAPEX -> 63 to 80 [%], OPEX -> 58 [%].
The result of the sensitivity study which we have made in this clause tells us that, the sensitivity of CF -> 1.0, the sensitivity of CAPEX -> 0.7 to 0.84, OPEX -> 0.16 to 0.32.
The combination of the potentials to reduce CAPEX and OPEX and the sensitivity of each category tells us the potential impact that each parameter could make to LCOE are as follows.
The potential impact of CF to LCOE = 2.5 to 5.5 %
The potential impact of CAPEX to LCOE = 44.1 to 67.2 %
The potential impact of OPEX to LCOE = 9.3 to 18.6 %
Considering the limited R&D resources, among the listed R&D projects in "1.9 List of R&T Projects and Prototypes" below, we are only able to focus on several top impactful items.
Improvement of CF is already at close to the moot point and the space for improvement is limited.
Since CAPEX and OPEX improvement are the fields havened been top focused, and we see larger potential space to be improved in there.
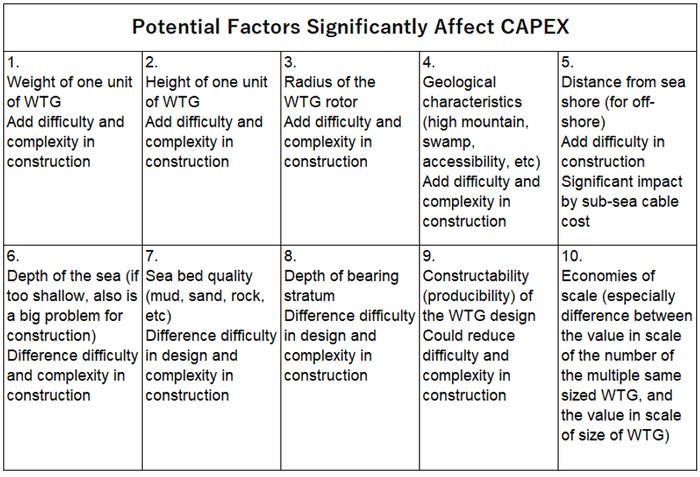
There are various considerations we can make to reduce CAPEX as in the table below.
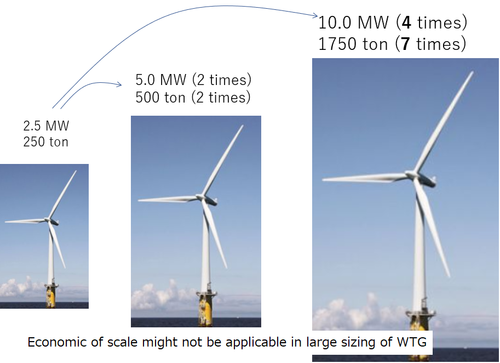
As you can see from this picture, the 10MW wind turbine is 7 times heavier while the capacity is only 4 times of that of 2.5MW wind turbine.
This simply means the construction of 10MW will likely cost 7 times that of 2.5MW's.
If the difficulty caused by its vertical height be considered, the price becomes even higher.
This means the levelized CAPEX of 10MW turbine is likely more than that of 2.5MW. So the theory of "larger the cheaper" would not likely be true in this case.
Financial Model
Considering currently reported worldwide investment plan for the wind turbines, ROI study based on NPV assuming discount rate as 12% per year has been made as follows.
The total worldwide investment plan for R&D in the wind power sector is $36.9 billion until 2028. <ref>https://www.windpowerengineering.com/wind-rd-spending-to-top-36-9-billion-by-2028/</ref>
By that, the targeted reduction on LCOE by 2030 is 20 [$/MWh] for onshore (land-based) wind power and 70 [$/MWh] for offshore wind power.
At 2017, the worldwide offshore wind farm capacity is 18.8 GW <ref>https://www.energy.gov/eere/wind/downloads/2017-offshore-wind-technologies-market-update</ref>
while the onshore (land-based) wind farm capacity is 495.7 GW. <ref>https://www.statista.com/statistics/476306/global-capacity-of-onshore-wind-energy/</ref>
This means the offshore ratio is only 3.6% of the total wind capacity.
On the other hand, the ratio of the offshore wind turbine is expected to be increased to 31% of the total wind power generation by 2030. <ref>https://www.ewea.org/fileadmin/files/library/publications/reports/EWEA-Wind-energy-scenarios-2030.pdf</ref>
This makes the targeted average LCOE reduction on both onshore and offshore wind farm as calculated to be 35.7 [$/MWh] by 2030.
At the same time, the total wind farm capacity in 2030 is expected to reach 2.1 [TW] (produces 5546 [TWh/year]) in the most aggressive scenario, and 1.26 [TW] (produces 3311 [TWh/year]) in the most pessimistic scenario. <ref>https://newenergyupdate.com/wind-energy-update/global-wind-could-hit-21-tw-2030-germany-pilots-wind-plus-pumped-hydro</ref>
The following ROI calculation has been commenced based on the most pessimistic scenario above (the orange graph), however, the benefit highly exceeds the investment cost.
Setting:
Year: 2030
Global Wind Power Production: 3300 [TWh/year] (Pessimistic Plan), 5546 [TWh/year] (Aggressive Plan)
Assumed reduction of LCOE in average of Off-shore and On-shore: 30 [$/MWh]
As for the work split among consisting stakeholders are as shown in the following table.
Survey link here: http://bit.ly/2P9Qg5I
List of R&T Projects and Prototypes
There are several studies analyzed effective targets to improve FOMs. However many of these studies are not effectively well funded and focused. Several reports in academic journals focus on the improvement of Capacity Factor which is expected to have only less than 10% impact on the FOM. <ref>https://www.wind-energ-sci.net/3/489/2018/</ref> <ref>https://www.researchgate.net/publication/330415378_A_Study_of_the_Impact_of_Pitch_Misalignment_on_Wind_Turbine_Performance</ref>
Whereas, there is no specific R&D report which contributes to explore the way to reduce CAPEX and OPEX that potentially provide up to 80% impact on FOM.
The following list is the R&D topic in which the wind power sector shall pay attention.
| No | Item | Improved FOM | Expected Improvement Ratio [%] |
|---|---|---|---|
| 1 | YAW system | CF | 2.5 |
| 2 | Pitch system | CF | 5.5 |
| 3 | Extension of design life by increased components durability | FCR | 36 |
| 4 | Improved component durability and reliability | OPEX | 58 |
| 5 | WTG, foundation and support structure design advancement, optimization | CAPEX | 80 |
| 6 | WTG parts, foundation/support structure manufacturing standardization, increase constructability, producibility | CAPEX | 68 |
| 7 | Installation and transportation equipment advancements | CAPEX | 63 |
| 8 | Technology improvement and const reduction of subsea cable manufacturing and installation | CAPEX | 20 |
Figures of impact are based on (Wiser (2017): FORECASTING WIND ENERGY COSTS & COST DRIVERS). <ref>https://emp.lbl.gov/sites/all/files/lbnl-1005717.pdf</ref>
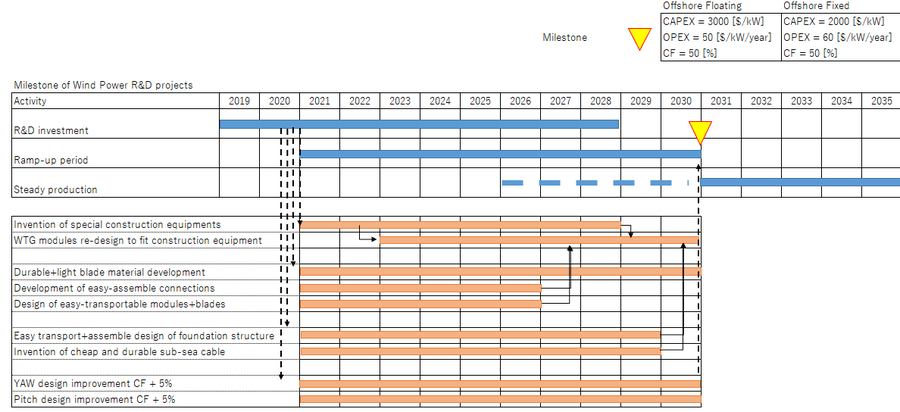
Following the currently projected improvement of CAPEX, OPEX, and CF, our corporate target for floating wind farms, set to be achieved by 2030, is to be set as follows:
For Off-shore (Fixed) Wind Farm
CAPEX = 2000 [$/kW]
OPEX = 60 [$/kW/year]
CF = 50 [%]
For Off-shore (Floating) Wind Farm
CAPEX = 3000 [$/kW]
OPEX = 50 [$/kW/year]
CF = 50 [%]
Key Publications, Presentations and Patents
Publications:
P. Veerset al.,Science10.1126/science.aau2027 (2019).:
This publication in Science addresses the need for continued improvement of wind technology to compete for a larger market share in industrial electricity production. They call out three areas of improvement that would have a major impact. The first major area of focus is a deeper understanding of atmospheric flow regimes where plants operate. The second being engineering improvement of the world’s largest rotating dynamic structures (wind turbines), and the last being optimization of fleets of wind turbines that make up wind harvesting plants. Better understanding of these three fields are explained to have the most drastic effect on the industrial wind power industry.
Stanley APJ, Ning A, Dykes K. Optimization of turbine design in wind farms with multiple hub heights, usingexact analytic gradients and structural constraints. Wind Energy. 2019;22:605–619. doi.org/10.1002/we.2310:
The publication above pertains to improving wind farm efficiency by introducing multiple turbine hub heights. By spacing the turbines vertically in the z-plane as well as the x/y-plane, wake interference caused by an upstream turbine can be reduced for downstream turbines. The paper specifies that the data is representative of on-shore turbines but this data can most likely be translated to offshore wind farms as well.
Patents:
The figure above shows the rise in wind turbine related patent applications from 1994 through 2015. Around 2007 there is a dramatic rise in applications across many major enabling technologies related to wind technology. After the peak in 2011, there is a steady decline in applications. This may be evidence that wind technology is approaching the tail end of its S-Curve.
Power Management for an Airborne Wind turbine:
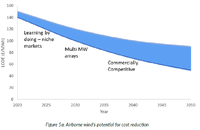
The patent listed above deals with power management of an airborne wind turbine. Power management of the turbine is not as interesting as the airborne wind turbine itself. Based on a figure provided in the patent, the turbine looks more like a tethered airplane than a turbine. The patent has mention of the tether being the transmitting line between the airborne machine and a battery on the ground. It could also be used to power the machine for takeoff and landing. Airborne wind turbines are an interesting subject because they would be able to reach heights with more stable wind regimes. Having steady wind is a reason for offshore wind turbines, but looking to the sky may be a solution as well.
Cable Routing for Wind Turbine System having Multiple Rotors:
This patent pertains to cable management of multi-rotor wind turbines. Again, while the topic of cable management does not spark too much interest, the idea of having an array of multiple rotors on one tower is interesting. The rotors are a relatively inexpensive part of the overall machine, and by having multiple rotors on one tower, CAPEX could potentially be reduced. Having multiple rotors could also increase the effective harvesting area per tower which may impact other figures of merit.
Floating Offshore Structures:
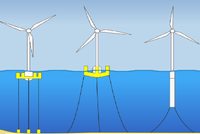
GE submitted this patent pertaining to offshore floating structures. There are a few different established methods of erecting larger, more powerful wind turbines. One method is floating the wind turbine. Companies are always looking to reduce CAPEX along with manufacturing/assembly costs and floating wind turbines are one method of reducing those costs. This specific patent is a method of securing the buoyant portion of the tower with an array of cables under tension. The system needs to adjust for different wind and wave conditions so the claims of this patent include an active adjustment system to account for these ever-changing forces. With patents like this one, subsystems can emerge to improve upon offshore technology.
Technology Strategy Statement
As a result of above research, we conclude that the highest expected return on investment can be achieved by focusing on CAPEX and OPEX. And thus, all the R&D investment among this engineering sector ($36.8 billion) shall be spent on the red highlighted items in the following list - hereby call them as strategic drivers of our company. Other items listed in blackletters are out of our aligned strategic drivers.
| No | Item | Improved FOM | Expected Improvement Ratio [%] |
|---|---|---|---|
| 1 | YAW system | CF | 2.5 |
| 2 | Pitch system | CF | 5.5 |
| 3 | Extension of design life by increased components durability | FCR | 36 |
| 4 | Improved component durability and reliability | OPEX | 58 |
| 5 | WTG, foundation and support structure design advancement, optimization | CAPEX | 80 |
| 6 | WTG parts, foundation/support structure manufacturing standardization, increase constructability, producibility | CAPEX | 68 |
| 7 | Installation and transportation equipment advancements | CAPEX | 63 |
| 8 | Technology improvement and const reduction of subsea cable manufacturing and installation | CAPEX | 20 |
Today, since most engineers are not invested in the reduction of CAPEX/OPEX, our company shall take this opportunity in stride and dominate that sector.
The goal of this company is to develop a low cost, efficient wind turbine for wind farms that will compete with rival energy producers in the energy sector by 2030. This will be achieved with R&D investments in new materials, transportation, assembly and construction methods for offshore turbines to achieve a CAPEX and OPEX value of 2000 [$/kw] and 60 [$/kw/year] respectively for Off-shore (Fixed) wind farm, and 3000 [$/kw] and 50 [$/kw/year] respectively for Off-shore (Floating) wind farm. After better materials and construction methods are developed, they will be implemented in tandem with larger turbines which will increase CF by 50 [%] by the year 2030.
To realize this strategy, team collaboration among wind turbine makers, structure steel makers, transportation and marine contractors, and power distributors is inevitable.
<ref>https://www.technologyreview.com/s/600881/wind-powers-next-hope-blades-as-long-as-two-football-fields/</ref><ref>https://www.lowtechmagazine.com/2019/06/wooden-wind-turbines.html</ref><ref>https://www.vox.com/energy-and-environment/2018/3/8/17084158/wind-turbine-power-energy-blades</ref>
