WorldWide eVTOL
Technology Roadmap Sections and Deliverables
- 2EVL Electric Vertical take off and Landing
We are dealing with a “level 2” roadmap at the product level, where “level 1” is a market level roadmap 1LUM (Low emissions Urban air Mobility)and “level 3” or “level 4” would indicate the specific technologies like vectored thrust, autonomous flight, electric propulsion etc. For the purpose of the roadmap we consider the roadmap for the company over 20 years from 2020-2040.

Roadmap Overview
eVTOLS (electric Vertical Take-Off and Landing) are airborne vehicles that use electric vectored thrust to take off vertically and transition from vertical thrust to horizontal thrust, thus making it flexible and efficient for urban air commute. <ref>https://en.wikipedia.org/wiki/EVTOL</ref>
Helicopters are the world’s current solution to aerial mobility: a time-proven system that effectively transports people and goods short to medium distances, with vertical takeoff and landing capabilities to boot. Air taxi services utilizing helicopters have operated since the 1950s, New York Airways being one of the famed initial operators that were profitable until a crash in 1977 resulted in the company going defunct. eVTOLS provide a solution to 5 main problems faced by the traditional helicopter based urban commute: noise pollution, safety, manufacturing costs, operational expenses, and emissions, and autonomous operational system architecture. The most direct benefit of eVTOLs over helicopters is electrification with predicted electricity costs of approximately 8.2 cents per mile or $4/hour as compared to $200/hour for helicopters.
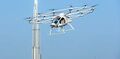
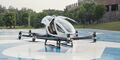
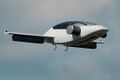
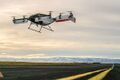
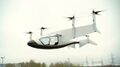
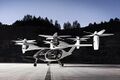
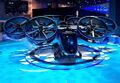
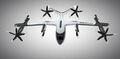
The basic elements of an eVTOL are a battery, electric motors, onboard electronic controllers, and a cruise lift wing. with a seating target of around 6 passengers. There are mainly 4 main configurations of eVTOLs as in the figure below. Vectored thrust eVTOLs have a wing for an efficient cruise and use the same electric propulsion system for both hover and cruise. They are conceptually simple but difficult and risky to control. An autonomous architecture is what is generally targeted by the existing players in the industry. The tail-sitters rotate the entire aircraft. The harrier configuration is called vectored thrust because it can orientate mechanically the direction of the thrust. The tilt-wings rotate the entire wing, the engines and the propellers as a single piece. Rotating the wing in hover avoids the impinging of the propeller slipstream on it, a problem that reduces the thrust in the hover of tiltrotors. The lift produced by the wing is augmented, at high angles of attack, by the blowing effect of the propellers.
Autonomous eVTOLs are more versatile and can be efficiently used to transport passengers and cargo without any human intervention yet are often available as optionally pilotable. <ref>Electric VTOL Configurations Comparison by Alessandro Bacchini</ref>
<ref>Lilliumjet, architecture design principles</ref>

Design Structure Matrix (DSM) Allocation
The maxtrix shown below represents the various interdependencies of major and minor subsystems of our eVTOL technology. The matrix shows which connections are physical, informatical, or whether they transmit energy or mass. Each connection in the matrix may have more than one form of interdependency.

The 2-EVL tree that we can extract from the DSM above shows us that the eVTOL (2EVL) is a solution to larger more fuel efficient methods of urban mobility (1LUM), and requires the following major subsystems: 3INT Interior, 3LHI Landing and Handling Infrastructure, 3EGM Energy Management, 3POP Propulsion, and 3NAV Navigation. These require the following level four component technologies: 4BAT Battery, 4CHG Charging Station, 4ELM Electric Motor, 4FAN Fan or Propeller, 4SEN Sensors, 4APT Auto-pilot and 4FCP Flight Computer.

Roadmap Model using OPM
We provide an Object-Process-Diagram (OPD) of the 2EVL roadmap in the figure below. This diagram captures the main object of the roadmap (eVTOL), its various instances including main competitors, its decomposition into subsystems (wing, flight-control, autonomous control, electric propulsion), its characterization by Figures of Merit (FOMs) as well as the main processes (hovering, wing tilt).
.jpg)
An Object-Process-Language (OPL) description of the roadmap scope is auto-generated and given below. It reflects the same content as the previous figure, but in a formal natural language.
Figures of Merit
The table below shows a list of FOMs by which electric VTOL can be assessed. The first two and the last two are used to assess the aircraft itself. They are very similar to the FOMs that are used to compare traditional aircraft which are propelled by fossil fuels, the big difference being that 2EVL is essentially emissions-free during flight operations. The other rows represent subordinated FOMs that impact the performance and cost of eVTOL but are provided as outputs (primary FOMs) from lower-level roadmaps at level 3 or level 4, see the DSM above.


Alignment with Company Strategic Drivers

The Urban Air Mobility industry driven by eVTOLs have 5 focus areas that are important to enable their mass deployment and adoption. These areas are Regulations, Technology Maturity, Infrastrusture, Air Traffic Management, Operational Safety and Psychological barriers.
Our mission statement is plans the strategic drivers along these focus areas to ensure success. The Technology Maturity, ATC management, and Infrastructure are some of the key strategic drivers adopted here.
One of the main benefits of eVTOLs is the integration of the heliports in the urban environment that reduces the CAPEX cost. As mentioned in the overview, eVTOLs can have various configurations for various advantages and this directly impacts the infrastructure around UAM. The improvements in the propulsion systems and the battery technology are the most important for the technology Maturity ensuring that our technology is as close to the Pareto Front as possible thus providing an edge over various the competitors in this domain. The tight integration of UAM in the urban context also calls for improvements in ATC in order to enable safe operations of 100s eVTOLs operating over cities, this would more or less determine whether the UAM service can be permitted to operate. Added to this, noise reduction is another important aspect to improve the psychological barrier.
Listed below are the strategic drivers for the company, and the alignment targets of our roadmap with these drivers:
| Number | Strategic Drivers | Alignment targets |
|---|---|---|
| 1 | To develop hover and cruise configurations to lower the net cost to the passenger for intercity flights in a limited service radius. The design of the eVTOL itself should enable reduced CAPEX costs and OPEX costs for a flight over a limited radius. The current air transportation modes either result in high CAPEX (Airports) or high OPEX (Helicopters, multirotors) that drive the cost up. | This roadmap will target the technology selection that would address the need for high hover efficiency for take-off and landing and high cruise efficiency for covering higher distances. The state of the art technology of tilt rotors and tilt wing aircrafts seem to enable the use of a common propulsion system for hover and cruise, leveraging the best of both aircrafts and rotorcraft(conventional). This roadmap evaluates various configurations of eVTOLs and this driver is aligned with this roadmap. |
| 2 | To target higher PAX capacities while keeping a balance with a decent range to enable cost effective transportation to surrounding cities, making the hub & spoke transportation model a reality. Efficient propulsion systems would increase the efficiency of the eVTOL creating room for more passengers or higher ranges. | The development of the Li-ion batteries with higher energy density is crucial to increased payload capacity of eVTOLs. THe Li-ion energy density has tripled since 2010 to 300Wh/Kg. To achieve a long range flight, a target of 500Wh/Kg is expected by 2025. The weight of the eVTOL itself plays a major role in this. Use of lighter materials like aluminum and carbon fiber are expected for the construction of the eVTOL. This driver is in alignment of the 2EVL roadmap |
| 3 | To develop low noise hover systems with lower disc loading in order to allow for the eVTOL to take off from various landing ports in urban areas. The reduced noise and disc loading will enable the construction of compact landing pads in buildings or courtyard without disrupting normal urban life. | The discloading of the aircraft severely impacts the noise level generated by the hover. The harrier jet generates 125 dB of noise when hovering at 100ft, whereas helicopters generate 108 dB at ground level. Reduction of these to 78 dB is required in order to achieve the desired noise level. Improved research in this area with different designs of the propulsion systems and noise dissipation can significantly reduce noise levels. This driver is currently aligned with the roadmap. |
| 4 | To enable safe, efficient, and regulated Air Traffic Management systems to help eVTOLs navigate seamlessly in an urban environment. With 100s of eVTOLs buzzing above populated cities, the risk of potential crashes increases significantly. Unlike airports and helicopters, eVTOLs would be deployed in large quantities and the heliports would space out in the most populated areas. An advanced ATC system can increase operational efficiency safely | The current state of the art relies heavily on human intervention to manage Air Traffic. Switching to Level 5 Autonomous Navigation would improve the predictability of flight patterns of eVTOLs making it easier to automate the Air Traffic management with minimal human supervision This driver is currently aligned with the eVTOLs. |
| 5 | To remove the psychological barrier surrounding Urban Air Mobility and autonomous flying. To enable mass adoption of autonomous eVTOLs, the passengers need to be comfortable with giving up control to a machine. The decision making or the "moral machine" of the systems need to be state of the art to resolve conflicts in the case of unexpected malfunctions. Moreover, this decision might also involve the consideration of potential crashes in the urban environment making it harder for the residents to accept autonomous flying machines over their houses. | Numerous studies for the moral machine of self-driving cars with level 5 autonomy conducted apply to UAM as well. These decision-making principles govern the onboard AI to resolve conflicts in the decision making in an unexpected scenario like a bird strike, equipment malfunction. Numerous social experiments are required to perfect this moral machine to remove the psychological barrier in the potential passengers. This driver is currently NOT aligned with the eVTOLs. |
Positioning of Company vs. Competition
The table below contains publicly available high level specification data for the key e-VTOL aircraft designs currently in the R&D, prototyping or production technology developmental phases.
Volocopter 2x
E-Hang
Lilium Jet
Vahana
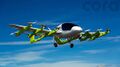
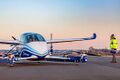
Cora
Aurora eVTOL


Rolls Royce eVTOL

NeoXcraft
Joby Generation 1
Nexus

Alakai Skai
Hyundai eVTOL


It is worth noting here that this table contains data for a variety of e-VTOL flight configurations. Each configuration has its pros and cons and the industry has not yet converged to an optimal configuration yet. Multicopter aircraft are typically designed to serve short-haul intra-city demand whilst tilt-wing, tilt-rotor and lift+push configurations achieve efficiency in cruise flight and therefore typically serve inter-city demand. Not all of these aircraft are in at the prototyping or production stages; some still remain conceptual. Performance specifications from such designs are subject to change in the future.

This figure highlights the trade-off that exists between flight range [km] and max payload capacity [kg] and presence of a pareto front that pushes to the top right of the chart. With e-VTOLs first making headlines in 2010 with the e-Hang announcement, players have adopted different methods to move closer to the utopia point. Both Volocopter and e-Hang are focused on the intra-city short-haul transportation market whilst players such as Lilium and Joby are more focused on inter-city operations. In the early 2010's, we see a focus on range over PAX capacity in an effort to dissolve doubts around operational feasibility. With that said, more recent e-VTOL designs sport large PAX capacities for similar or more range, signaling a shift from technological development and R&D focused on core performance parameters such as range to more operational considerations such as PAX capacity. We have included our eVTOL product, Worldwide eVTOL, in this chart sporting similar range to the Lilium Jet in 2020 since we plan to adopt a similar tilt-wing design. Moreover, we have included our predictions of technological progression for 2030 post-R&D improvements based on the technical model sensitivity and R&D project analyses below. The R&D projects that will have a direct impact on these specific FOMs would be the battery technology improvement and power train efficiency R&D project and the autonomous flight R&D project. These together are likely to drive the max PAX load and range of our eVTOL aircraft. The assumptions implicit in these analyses will be discussed in their respective sections.
This industry has not yet seen any notable consolidation efforts in part because it remains a nascent industry without any realized demand. With that said, as certification processes begin to hinder to-market strategies, consolidation may occur between players with compatible technology or operational synergies. Furthermore, whilst the market is crowded with feasible e-VTOL designs, competition is not necessarily fully realized in as the industry grows as players will likely benefit from co-existence. We can expect to see synergies between direct competitors with regards to certification processes, driving customer and public acceptance and any infrastructure-related investment that is required at the industry level.
Technical Model
Morphological Matrix
An eVTOL system is complex, with many subsystems that all must be designed and optimized to achieve desired overall performance. The following morphological matrix contains some of the governing physical parameters that impact the aerodynamic performance of the aircraft.
| Decision Variable | E-Hang | Cora | Lilium |
|---|---|---|---|
| Wing Area [m^2] | N/A | 10 | 3.6 |
| Wingspan [m] | N/A | 11 | 6 |
| Disk Actuator Area [m^2] | 8.04 | 13.6 | 0.64 |
| Number of Lift Devices | 4 | 12 | 36 |
| Total Mass (kg) | 220 | 1224 | 490 |
FOM Sensitivity Analysis
Fundamental equations for eVTOL range and cost per trip were generated which include some of the parameters in the morphological matrix shown above.
The model for range is based on the Breguet Range Equation. This equation is adopted for electric aircraft to include the energy density of the battery-electric system over fuel properties as in the traditional Breguet Range Equation to take the form
<math> R = E^{*}\cdot\eta_{total}\cdot\frac{1}{g}\cdot\frac{L}{D}\cdot\frac{m_{battery}}{m_{total}} </math>

where <math>E^*</math> is the specific energy of the battery system, <math>\eta_{total}</math> is the overall efficiency, L is lift, D is Drag and m is mass. This simple equation contains a lot of information about the impacts of the vehicle and propulsive system parameters on the system. A sensitivity analysis was performed on the L/D, total mass, energy density, and total efficiency, producing the tornado chart shown.
The plot shows that there is a positive 1:1 relationship between increases in overall system efficiency, L/D, and battery energy density to aircraft range. Conversely, there is an inverse relationship between the overall mass of the system and the range.
The other technical model created is for cost per flight of the eVTOL aircraft. The high level governing equation includes a cost per hour of crew wages, an amortized unit cost, and the energy cost of the flight as shown below.
<math> Cost_{flight} = \frac{Cost_{vehicle}}{n_{lifetime flights}} + Cost_{crew/hr}\cdot\left(t_{takeoff}+t_{landing}+\frac{V_{cruise}}{R_{trip}}\right)+Cost_{energy}\cdot E_{flight} </math>
To develop a cost model that can be compared across multiple platforms, a baseline mission of fixed-time takeoff and landing periods, and a set-distance cruise was considered. These times, <math> t_{takeoff} </math> and <math> t_{landing} </math> are seen in the equation above. To determine the amount of energy needed for the flight, the mission segments must be broken down into their components. First, the power required to hover,
<math> P_{hover} = \sqrt{\frac{\frac{T}{T_{i}}^{3}}{2\rho A}} </math>
is considered where T is thrust, <math> T_i </math> is a scaling factor depending on propulsor type, <math> \rho </math> is air density, and A is the disk actuator area. This power quantity can be combined with the energy needed for a fixed range by rearranging the Breguet Range Equation shown above, which gives
<math> E_{flight} = P_{hover}\cdot t_{takeoff}+P_{hover}*t_{landing}+E_{cruise} </math>
as the overall equation for energy consumed on a flight. Substituting back into the original cost model, yields
<math> Cost_{flight} = \frac{Cost_{vehicle}}{n_{lifetime flights}} + Cost_{crew/hr}\cdot\left(t_{takeoff}+t_{landing}+\frac{V_{cruise}}{R_{trip}}\right)+Cost_{energy}\cdot\sqrt{\frac{\frac{T}{T_{i}}^{3}}{2\rho A}}\cdot\left[t_{takeoff}+t_{landing}+\frac{R}{\eta_{total}\cdot\frac{1}{g}\cdot\frac{L}{D}\cdot\frac{m_{battery}}{m_{total}}}\right] </math>
as the final equation for cost per flight, including all pertinent vehicle parameters. This final equation, with the underlying parameters embedded in these values, was analyzed for normalized sensitivity to changes in the total propulsive efficiency, Lift-to-drag ratio of the aircraft, total aircraft mass, cruise velocity and the number of flights per day. These sensitivities are plotted and shown in the corresponding tornado chart.

For this assessment, the up-front investment of the product was assumed to be $1,200,000, hourly wages for the eVTOL operator are $52, the baseline flights/day is 8, and the expected service life is 15 years. Due to the relatively low cost of electricity compared to amortized capital expenses and crew wages, for this mission set, the impacts of the parameters that feed into <math>E_{flight}</math> are less significant. This figure shows the positive relationship between up-front capital costs of the aircraft and the cost per trip, along with the aircraft mass. Conversely, the eVTOL's cruise velocity and L/D are inversely proportional to the cost per trip. Thus, according to the chart above, the most impactful way to lower trip cost for the analyzed mission is to increase the cruise velocity.
Key Patents and Publications
Patents
Karem Aircraft: EVTOL Aircraft Using Large, Variable Speed Tilt Rotors

This patent, US 10,351,235, covers a specific eVTOL architecture consisting of four electrically driven rotors, and a horizontal wing-tail configuration. The aircraft is described to have a payload of 500-1300 lbs, and the range is not specified. This aircraft concept achieves vertical flight through articulating “tilt-rotors” on each of the four rotors in the concept. During vertical flight, they are all operating in the horizontal plane, providing vertical thrust for vertical take-off and landing. The aircraft has a long major wing, and a smaller tailplane behind it, each with two of the motor-propeller assemblies. In translational flight, the aircraft relies on the wing for lift, and the motors are responsible only for producing thrust. The rear rotors are on the ends of the horizontal tailplane, while the main rotors are near the end, with a wing extension protruding beyond.
Joby Aviation: Aerodynamically Efficient Lightweight Vertical Takeoff and Landing Aircraft with Pivoting Rotors and Stowing Rotor Blades

US patent 20160031555A1 by Joby Aviation covers three different concepts of tiltrotor aircraft, each of which rely on pivoted electric rotor assemblies for vertical thrust, and on wings for lift in horizontal flight. One of the key features of this aircraft concept is the forward-swept wing with either three or four electric rotors on each side. This is due to mass balancing, and wing spar placement considerations. Additionally, the patent covers Joby’s plan to have rotors that can articulate and nest within the nacelle during forward flight. Because the rotors have to provide all of the lift in vertical flight, the rotor system is sized for this condition, not for the thrust needed in horizontal flight. By stowing the motors when they aren't needed, significant aerodynamic gains can be achieved. Lastly the rotor assemblies are able to pivot with respect to the engine nacelles due to a design shown in detail in the patent. The actuator-driven pivoting of the motor/propeller assembly can potentially simplify the architecture, as the surrounding wing structure does not have to accommodate a pivoting nacelle.
Opener: Electrically Powered Aerial Vehicles and Flight Control Methods
US Patent 9,346,542 by Opener describes the core technology and configuration for their Blackfly eVTOL aircraft technology. The overall layout of this aircraft is two straight wings that are located in the front and back of the aircraft and are vertically staggered from each other. Each wing has four motor-propeller rotor assemblies which are powered from a central battery. Currently, the Blackfly technology is only a single-seat aircraft and the patent describes it as such. Each wing assembly with embedded rotors rotates about its own axis to provide thrust for both vertical and horizontal flight. Additionally, this design has no control surfaces. The control and navigation of this concept is controlled by modulating the thrust provided to each independent rotor assembly. Through this differential thrust, the aircraft is able to pitch, roll and yaw, along with possessing control capabilities while hovering. The patent also covers a detailed energy and information flow diagram that shows how both power and control information are provided to each motor assembly. This patent does not cover the mechanics of the wing assemblies, their rotation, or any mention of the intended uses of the aircraft. Overall this patent concisely describes the single-person aircraft from a high level, but does not mention any specifics about some of the mechanical challenges that this design possesses.
Publications
Electric VTOL Configurations Comparison
Alessandro Bacchini and Enrico Cestino, 2019
This paper by Alessandro Bacchini and Enrico Cestino consists of a thorough comparison of three major types of eVTOL aircraft system architectures and evaluates their performance in three unique sample missions. The three types of aircraft are demonstrated and compared by investigating the performance of three commercial offerings, the E-Hang, Kitty Hawk Cora, and Lilium Jet. The E-Hang represents a wingless configuration where vertical and horizontal thrust, and lift in horizontal flight are all provided by rotor assemblies. The Cora is a lift-cruise aircraft where lift and cruise propulsion are provided by unique motor assemblies. This aircraft has wings to provide lift in horizontal flight, twelve horizontal rotors which provide vertical thrust, and a single motor which powers a pusher propeller for horizontal thrust. The Lilium Jet represents the last architecture, which has fixed horizontal wings and a propulsion system that pivots between a horizontal and vertical orientation to provide vertical and horizontal thrust.
This paper provides a review of each aircrafts performance by drawing on aerodynamic first principles. The sample mission sets have a hover, acceleration, cruise, deceleration, and landing hover portion, which vary in length between the three. Each aircraft configuration is analyzed for cruise and hover performance, and the overall power and energy required for each leg of the mission is compared. For hover, the E-Hang outperforms the other two configurations, while the Lilium Jet is the best during cruise. The Cora represents a compromise between the two systems. Overall this paper represents a thorough approach to compare various eVTOL concepts against one another. One criticism is that it is missing the tilt-rotor propeller architecture, which constitutes a large segment of the industry.
A Review of Configuration Design for Distributed Propulsion Transitioning VTOL Aircraft
D. Felix Finger, Carsten Braun, and Cees Bil, 2016
This paper, by D. Felix Finger, Carsten Braun, and Cees Bil, provides an overview of the tradeoffs between many different solutions to the eVTOL aircraft system. In total, fifteen unique configurations of transitioning flight aircraft are considered. These systems are those where wings are relied on as a primary means of producing lift during horizontal flight. Concepts discussed ranged from jet-lift fan configurations like the F-35B, to tilt-duct arrangements as seen on the Bell 65. Additionally, there is a discussion of rotorcraft technologies including the helicopter and various multicopter configurations.
List of R&D Projects
A list of R&D projects was compiled which covers a range of potential developments for our eVTOL product impacting many of the key FOMs for this product. Each project was compared qualitatively based on the potential to improve each FOM, the relative cost, and the risk of failure.

Once each project was scored in these key metrics, they were combined where the highest impact, lowest cost and lowest risk projects were prioritized. This resulted in working with Air Traffic Control research and improvements as the top project. The projects discussed in further detail are those most likely to be selected, or those ranked with higher priority.
The following two projects involve external stakeholders to achieve the FOM improvement target. Each project relates to a core improvement that needs to be achieved to reach operational eVTOLs. Despite these projects, however, there are significant regulatory hurdles that must be overcome to reach certification.
- ATC Advancements - This project involves working with regulatory or research partners to explore necessary improvements to ATC operations to accommodate eVTOLs operating in commercial airspace. This project does not directly impact a single FOM, but is necessary to have a plan for implementation and roll-out of the vehicles once the technology begins its roll-out. Though not directly impacted, ATC advancements can improve the routing and frequency of flights, ultimately improving the FOM of vehicle utilization.
- Battery Tech Improvement - An allied partnership with either a battery manufacturer or an academic institution focusing on the development of new chemistry to improve battery efficiency and energy storage density. This project would likely involve a partnership where Worldwide eVTOL would provide funding and a customer guarantee while the institution or battery company would receive R&D funding. This project would improve range by allowing for more energy stored in a same-size battery, or more payload by holding range constant and shrinking the size of the battery. Improving the battery technology will result in both higher energy density, and lower cost batteries for use on the eVTOL. This reduction in battery cost was captured in the financial model, while the additional benefit of lighter batteries due to higher density resulting in more passengers is a benefit above what is captured in our model.
The projects below represent technical development internal to Worldwide eVTOL. These projects are within the technical sphere of this company and will directly involve our engineers and technologists. Though the improvements are less critical to success of the eVTOL than those described above, they have a higher likelihood of success.
- Improved Electric Motors - This project involves dedicating R&D funding to the development and improvement of the electric motors used on our eVTOL offering. The overall propulsive efficiency is a first-order driver of flight performance of the aircraft and improving the power delivery system will enable meaningful improvements to all FOMs. This improvement in electric motors results in an overall benefit to the propulsive efficiency of the aircraft, ultimately reducing the cost per trip of the eVTOL.
- Battery Swapping - This technology would significantly improve the turn-time of the eVTOL. By swapping batteries, the charge time between trips is eliminated, and instead replaced by a much shorter time to swap already charged batteries into the aircraft. This technology is also considered a platform project as swappable batteries in an electric transportation platform could be leveraged to other industries or competitor's offerings. Battery swapping would enable much shorter vehicle turn times resulting in increased flight frequency, ultimately improving vehicle utilization FOM.
- Autonomous Flight - This project is to develop and deploy an autonomous flight system. This is considered a breakthrough development as it creates a step-change in performance of the product by eliminating the cost of a pilot on each flight. This project would face significant regulatory hurdles potentially threatening implementation, however, the technical development and maturation of the self-piloting technology can be developed by Worldwide eVTOL. Having autonomous flight technology onboard would eliminate the need for on-board pilot and, therefore, their associated wage costs, directly reducing the cost per PAX km FOM.
The plot shown below is an example of an FOM improvement that could be expected from the projects of improved battery technology and propulsive efficiency.
The range improves with each of these projects because improved batteries, or higher energy density, allows the eVTOL to have a higher energy storage capacity while holding the weight and physical size of the battery constant. One potential benefit of this advancement could be increasing the range of the aircraft. The baseline battery technology rate of improvement is currently estimated as 2%/year, and the project will help enable a firm to achieve 4% improvement year/year. The R&D project to improve the electric motors would serve to increase the overall propulsive efficiency, a change that is shown to have a 1:1 relationship with range in the technical model shown above.
Financial Model
This financial model is performed from the perspective of a dual manufacturer and operator of an inter-city e-VTOL passenger transport service. The breakdown of the profit and loss statement is as follows:
- Annual profits are derived from revenues and costs:
- Revenues
- Revenues are in turn solely derived by ticket sales for the passenger transport service, and notably not from any auxiliary sales of the e-VTOL aircraft to other operators or in alternative industries or use cases.
- Revenue is driven solely by the number of flights flown in a year, the average PAX load per flight and the average ticket price per PAX per flight.
- Flights flown per year is estimated via a bottom-up approach based off the number of vehicles in the operating fleet each year and their daily utilization rates.
- An average PAX load of 4 is assumed throughout. This is to reflect long-term strategic goals of our technology.
- The average ticket price is benchmarked off of competing alternative transport modes with convenience of e-VTOL transport included as a price multiple.<ref>https://ntrs.nasa.gov/search.jsp?R=20190001472</ref>
- Costs
- Variable costs: sub-divided into electricity for e-VTOL charging, labor, maintenance and landing fees
- Electricity price assumed to be the average U.S. electricity price adjusted for inflation over the timeframe.
- Labor assumed in line with commercial airline wages adjusted for inflation over the timeframe.
- Maintenance and landing fees benchmarked from Uber Elevate report (2016) adjusted for inflation over the timeframe. <ref name="uber">https://www.uber.com/elevate.pdf</ref>
- Fixed costs: sub-divided into overhead (in turn divided into rent and administrative) and insurance
- All costs adjusted for inflation over the timeframe.
- Capital costs: sub-divided into vehicle manufacturing, depreciation, battery acquisition, charging infrastructure and spares.
- Vehicle manufacturing costs benchmarked to sizing in Uber Elevate report (2016) with a year-on-year 5% cost reduction in manufacturing costs over timeframe. <ref name="uber"/>
- Depreciation assumed constant as 10% of total vehicle fleet asset value. No other deprecation costs were modeled.
- Battery acquisition cost based off of 140 kWh rating for typical e-VTOL in Uber Elevate Report (2016) at 400 $/kWh price for batteries with a year-on-year 4% cost reduction over the timeframe.
- Charging infrastructure and spares assumed proportional to number of legs offered, adjusted for inflation over the timeframe.
- Variable costs: sub-divided into electricity for e-VTOL charging, labor, maintenance and landing fees
- Revenues
We decided to utilize this financial model to perform sensitivity analysis on the various potential R&D projects within the purview of an e-VTOL manufacturer and operator. The R&D projects we modeled were: 1) the baseline R&T product development; 2) battery swapping technology integration; 3) autonomous flight systems integration; 4) general battery technology improvement and power train efficiency investment. Now discussing the financial implications of each in turn:
- Baseline:
- Incur a 20 million R&T cost evenly distributed over the first 5 years of timeframe.
- No additional R&D costs.

- Battery swapping:
- Revenue driver:
- Reduces dead turn-around and charging time from baseline value of 3 hrs/flight to 1 hrs/flight. This in turn drives up daily vehicle utilization, annual number of flights flown and, therefore, revenue.
- Cost driver:
- Incur a 20 million R&T cost evenly distributed over the first 5 years of timeframe.
- Incur an 8 million developmental and integration cost of battery swapping technology evenly distributed over the first 5 years of timeframe. This R&D research was assumed to be done at the beginning of the venture since produce design would be designed around battery swapping operations.
- Revenue driver:

- Autonomous flight:
- Revenue driver:
- Price per ticket per PAX reduces by 5% to reflect the fact that consumers would expect lower prices with autonomous flight technology.
- Cost driver:
- Incur a 20 million R&T cost evenly distributed over the first 5 years of timeframe.
- Incur a 10 million R&D cost evenly distributed over the first 10 years of timeframe. A 10 year to-deployment timeframe was assumed to reflect the potential technological, regulatory and certification hurdles associated with autonomous flight.
- Reduces variable labour costs, specifically number of pilots required and, therefore, pilot costs, beginning from final year of autonomous flight R&D integration to end of timeframe.
- Revenue driver:

- Battery technology improvement and power train efficiency:
- Revenue driver:
- Price per ticket per PAX increases by 5% to reflect the fact that consumers would be willing to pay more for longer range flights or more spacious cabins.
- Cost driver:
- Incur a 20 million R&T cost evenly distributed over the first 5 years of timeframe.
- Incur a 8 million R&D cost associated with external battery technology improvement investment evenly distributed over the first 5 years of timeframe
- Incur a 6 million R&D cost associated with internal power train efficiency investment evenly distributed over the first 5 years of timeframe
- Battery acquisition price reduces by 5% to reflect access to cheaper battery supply as a result of R&D investment.
- Revenue driver:

- Combined R&D:
- Combination of the Battery swapping, Autonomous flight and Battery technology improvement and power train efficiency R&D projects.
- Battery swapping R&D costs incurred in years 0-5 to reflect design of operations and charging stations around battery swapping logic from early stages of venture.
- Autonomous flight R&D costs incurred in years 10-15 to reflect complex technological, regulatory and customer acceptance landscape around autonomous flight.
- Battery swapping R&D costs incurred in years 5-10 to fit between R&D projects above, abiding my capital constraints and internal R&D bandwidth.


Comparative R&D scenario total annual discounted cash flow data.
Comparative R&D scenario breakeven analysis data.
Elaborating on how the figures above should be read, the first few years in each are typically R&D-dominant periods followed by a sustained revenue generation until 2040. Data below the x-axis represent stacked totals of the annual variable, fixed and capital costs whilst data above the x-axis represent revenues generated via passenger transport operations. Any diagonally patterned bars highlight the specific additional R&D cost associated with this R&D scenario. And bars highlighted in a green border indicate that these data series are directly impacted by the R&D investment associated with this scenario.
A number of insights can be extracted from the analysis above:
- Although dependent on the assumptions made around R&D project timing and costs, we see the total capital costs required in each R&D scenario do not differ drastically at any point in the 20 year venture. The combined R&D scenario would require more a sustained funding and/or reinvestment strategy but at no point do the capital requirements spike. This is likely due to the staggered R&D investment strategy we adopted to minimize the risk of an R&D induced capital crunch.
- All scenarios are profitable in the long term with NPVs of a) baseline: $15 million b) battery swapping: $58 million c) autonomous flight: $43 million d) battery technology improvement and power efficiency analysis: $38 million and e) combined R&D scenario: $89 million. If constrained to a single R&D project, the most lucrative R&D approach would be to invest in battery swapping technology from the early stages of the venture. This seems to enable passenger transport operations to most efficiently utilize the e-VTOL fleet and, therefore, offset the vehicle acquisition, battery acquisition, charging infrastructure and overhead costs associated with the operation. But in the context of our company's strategic objectives (to achieve long-term profitability and capture high PAX load inter-city aerial transport), the combined R&D scenario is, indeed, the most attractive in the long term achieving an NPV (2020) of $89 million over 20 years of operation.
- All scenarios breakeven after 14-18 years of operation with the combined R&D scenario being the most attractive. And even with the increased number of R&D projects, because they are staggered and each contributes to the bottom line directly after completion, the breakeven timeframe is on-par with the baseline and single R&D project scenarios whilst the long-term profitability is much more attractive. Regardless, a 17-year payback period is typically longer than the payback timeframes expected by most venture capital investors and others that would be associated with funding such a venture. This suggests that larger incumbent firms with longer to-market timeframes, fewer investor constraints and more sustained capital supply are more likely to succeed in reaching this breakeven point and capturing market share in the long term.
Technology Strategy Statement
Our company aims to launch the UAM operations with the first iteration of a 5 seater aircraft by the year 2027, and thus focuses on the R&D projects in the fields of ATC control and improving the propulsion system of the eVTOL. With the pilot and testing going through 2027-2028, the focus would shift towards improving the battery tech in order to improve the range and no. of flights per day of the aircraft while focussing on improving the battery tech and the battery swapping mechanisms at the heliports. By the year 2035,we aim to achieve fully autonomous flight operations enabling regular intercity flights with a ride hailing service infrastructure in place. After the key R&D projects ave completed their initial deliverables and the improvements have been incorporated the results have been deployed, the company is projected to generate annual revenue of $35,000,000 in the year 2040.