Difference between revisions of "VREducation"
| Line 163: | Line 163: | ||
The R&D projects that are based on Educational output through VR Based education and VR Headset quality are listed below. | The R&D projects that are based on Educational output through VR Based education and VR Headset quality are listed below. | ||
Currently VR Headset based education is being prototyped though we do not have exact results on how the quality of VR Headset and the quality of the content impact the learning experience. | Currently VR Headset based education is being prototyped though we do not have exact results on how the quality of VR Headset and the quality of the content impact the learning experience. | ||
[[File : Tablelist.png]] | |||
==Demonstrator project== | |||
'''Virtual Reality for Training in Volvo Trucks''' | |||
Volvo Trucks has embarked on a pioneering venture into the realm of Virtual Reality (VR) for training, placing a distinct emphasis on the intricacies of electromobility and Liquified Natural Gas (LNG). This strategic move enables training sessions without the need for the physical presence of products, leading to significant cost savings, particularly in industries dealing with substantial and costly equipment like trucks. The adoption of Oculus 2 headsets facilitates seamless remote participation in trainer-led sessions, enhancing flexibility and inclusivity in the learning process. Moreover, the safety considerations intrinsic to VR training provide employees with a secure environment for mastering skills, especially in contexts where real-world training might pose potential risks. | |||
Currently, a pilot program is underway within Volvo Trucks in the UK, reflecting a commitment to active testing and refinement of VR training initiatives. The in-house production of VR environments by Volvo Group Digital & IT, in collaboration with preferred suppliers, ensures a bespoke approach, allowing for greater control over content creation. The focus extends beyond content, encompassing the secure management of VR devices and support for end-users utilizing Oculus Headsets. As interest in VR training techniques grows, Volvo is strategically planning an expanded implementation across various brands and employee categories, signaling a transformative shift in training methodologies. The positive outcomes observed in cost savings, accessibility, and safety considerations position VR as a cornerstone in Volvo Trucks' evolving training landscape. | |||
=Technology Strategy Statement= | |||
[[File : Tablelist.png]] | [[File : Tablelist.png]] | ||
Revision as of 18:44, 16 November 2023
Project Overview
Virtual Reality (VR) in education offers an immersive, interactive, and engaging environment, revolutionizing traditional education and teaching methods. By simulating real-world experiences, VR promotes experiential learning, allowing students to visualize complex concepts, explore inaccessible locales, and engage in realistic scenarios. VR technology fosters better comprehension, retention, and enthusiasm for subjects ranging from history to science to training in skilled labour industries and beyond. In classrooms, VR can transport students to ancient civilizations, distant planets, or even inside human cells. For skills training, such as medical or technical fields, VR provides safe, repeatable environments for practice, reducing risks and resource costs. Moreover, VR caters to diverse learning styles, accommodating visual, auditory, and kinesthetic learners. With the potential for global virtual classrooms, students from varied geographies and backgrounds can interact, democratizing education access. While challenges remain, including technological equity and motion sickness, the transformative potential of VR in education is undeniable.
Our technology roadmap identifies the importance of the integration between hardware technical capabilities – including the VR headset and hand-held devices – along with the educational content and curriculum. Getting both “right” is integral to the future utilization and success of using VR as an immersive learning tool. Our roadmap demonstrates that VR for education is still in the “Rapid Progress” phase of the traditional “S Curve” and countless additional / supplementary innovations are still forthcoming such as utilizing AI for bespoke / custom learning opportunities for students / trainees around the world. Our technology roadmap lives at the epicenter of three key aspects as outlined in Figure I below. This graphical representation integrates well with the Mixed Reality technology roadmap outlined in (https://roadmaps.mit.edu/index.php/Mixed_Reality_(Augmented_%26_Virtual)#Roadmap_Overview). The key difference is the extended and deliberate engagement of educational content and curriculum into our roadmap.
- Human Operator. This includes both the trainee and the instructor that may (or may not) be involved in the training and educational experience. Some of the hands-on technical training using VR may still leverage the opportunity for an in-person instructor such as training in hazardous situations or medical environments.
- Content / Curriculum and Learning Environment. Student / trainee educational outcomes are rooted in the development and deployment of the “right” educational content and curriculum in the VR immersive experience.
- VR Hardware / Computer Systems. The quality, cost, and user experience with the VR hardware and supporting computer systems will be integral to the success of our VR for Education technology development and deployment. Significant investments and progress has been made and continue to position VR to transform the global education market.
Position in Technology Matrix
Our technology of choice is VR for Education. Per below, VR for Education is indicated in the “Exchanging Information” category because it involves exchanging educational content in the form of information with students. The VR hardware (headset and hand controllers) combined with educational content is a mechanism to exchange information between a student/trainee and the content delivered/exchanged via the VR technology.
DSM Allocation
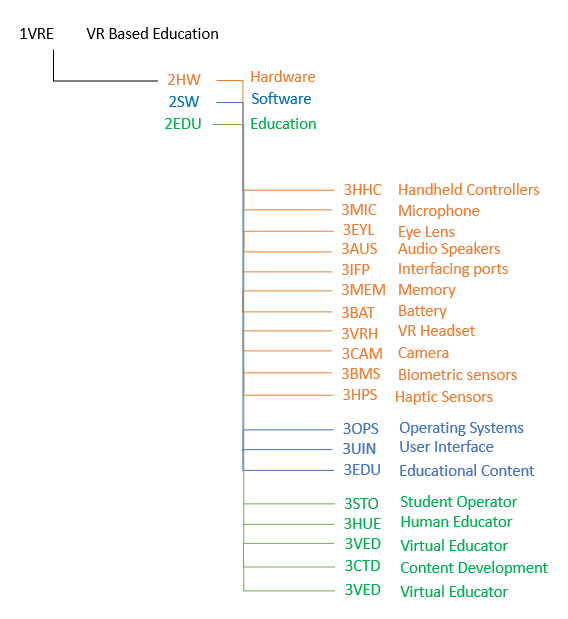
For the DSM, the entire education concept is considered in the first level and then it is broken into the educational content and the enablers involved.
The DSM tree indicated how the levels are decomposed.
Figure : DSM Tree of VR Education
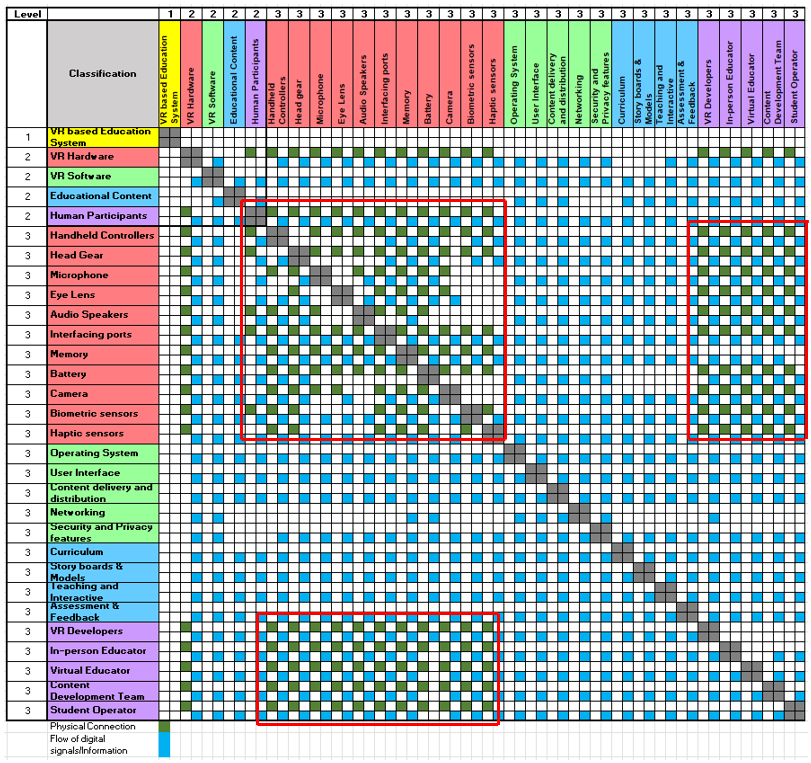
The level 3 components have been considered to create the DSM matrix. The physical and informational exchanges have been indicated.
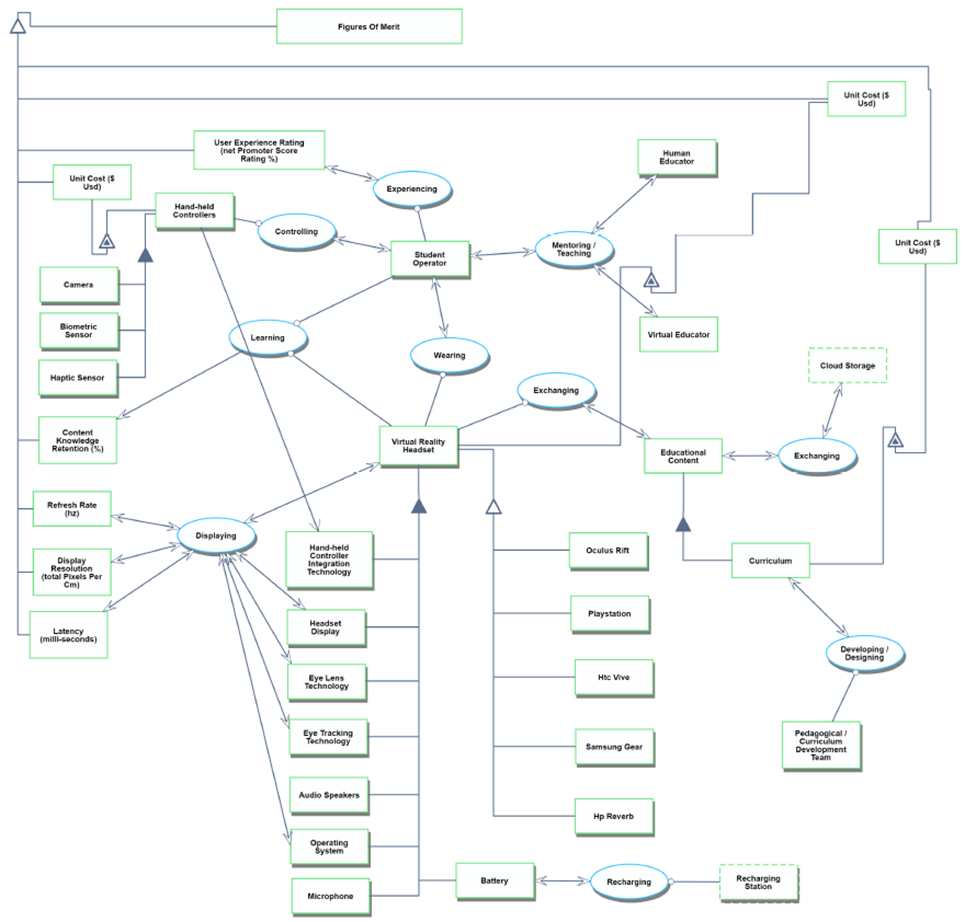
Roadmap Model using Object Process Methodology(OPM)
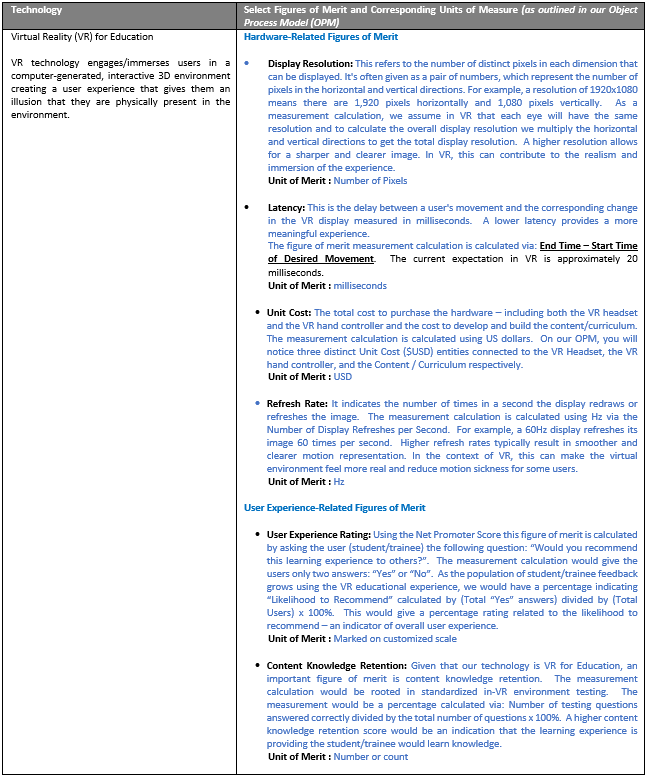
Figures of Merit
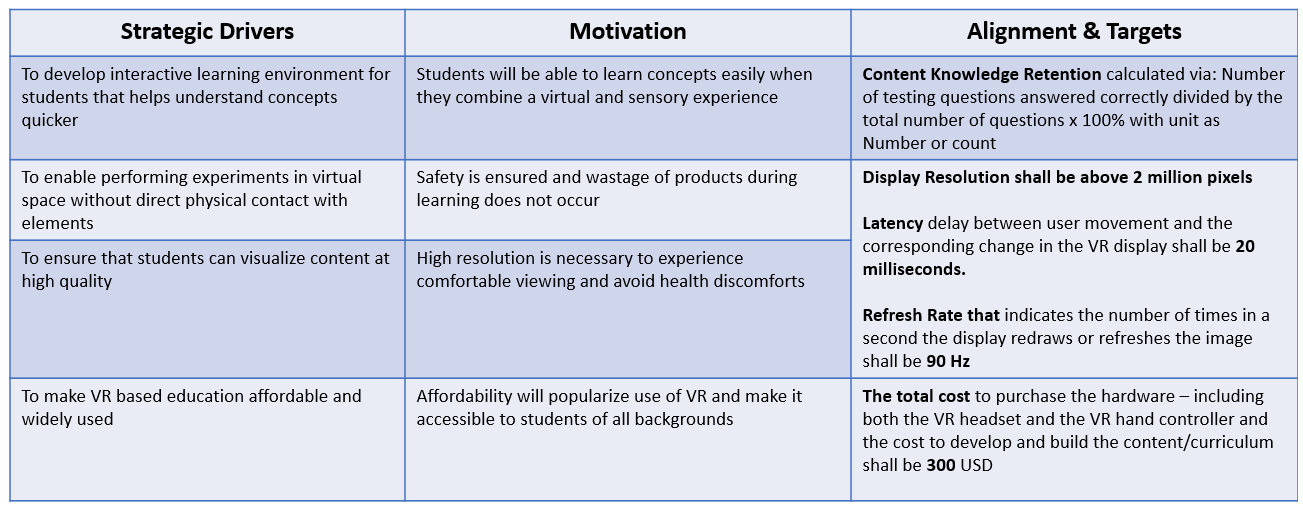
Alignment with Company Strategic Drivers : FOM Targets
For VR-based education, the strategic drivers that the industry demands are listed here. The Strategic Drivers, motivation behind these drivers and the FOM targets are mentioned below. The goal here is not to pick the highest display quality, but to find a balance between the display, cost and the educational impact.
Positioning of Company Vs. Competition : FOM charts
To understand the working of the technology, various parameters and FOMs impacting the performance of the VR based education are considered. Initial focus was to understand the Market share of products and their latency and display resolution. We analyzed both display resolution and latency to understand where they fit within the specifications of the VR headsets for the market leaders – Meta and Sony – for their current in-market product at their current price.
Figure: Latency and Display Resolution Specs aligned to current Market Share Leader Products
Technical Modeling - Latency
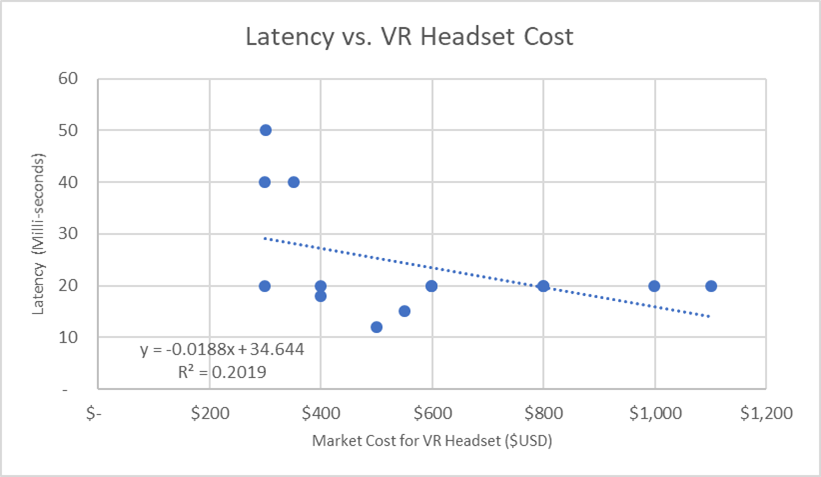
Starting with latency, research insights have indicated VR headset manufacturers are seeking to reduce latency to below 5 milli-seconds, but the question becomes two-fold: First, can a human being identify a latency difference between 2 milli-seconds vs. 5 milli-seconds vs. 10 milli-seconds and second, are they willing to pay for the incremental improvement? Research we conducted indicated that “while humans can detect very small relative delays in parts of the visual field, when absolute delays are below approximately 20 milliseconds, they are generally imperceptible.” (14) When we conduct a regression analysis assessing to assess the sensitivity of incremental unit cost of a VR headset relative to latency improvements – over the past ten years based on our research / source information – we derive a linear equation as labeled on the charts below.
Figure: Sensitivity Analysis Comparing Latency and Market Cost of VR Headset
This model illustrates an interesting analysis in that, if we assume the current best-in-market latency for VR headsets is 20 milli-seconds and this corresponds to current products of the duopoly market share leaders Meta and Sony, the question becomes what would be the incremental market price impact, if we improve latency by 10 milli-seconds (50% improvement) – essentially getting latency to 10 milli-seconds. Using our regression equation model, we demonstrate the impact on total cost of the VR headset could be ~$1,311 USD – an increase of over 150% in consumer cost. Given our understanding of the incumbent VR headset price that dominates over 80% of the market ($500 to $550 USD per VR headset), we believe that consumers would not be willing to pay for this.
Technical Modeling – Display Resolution
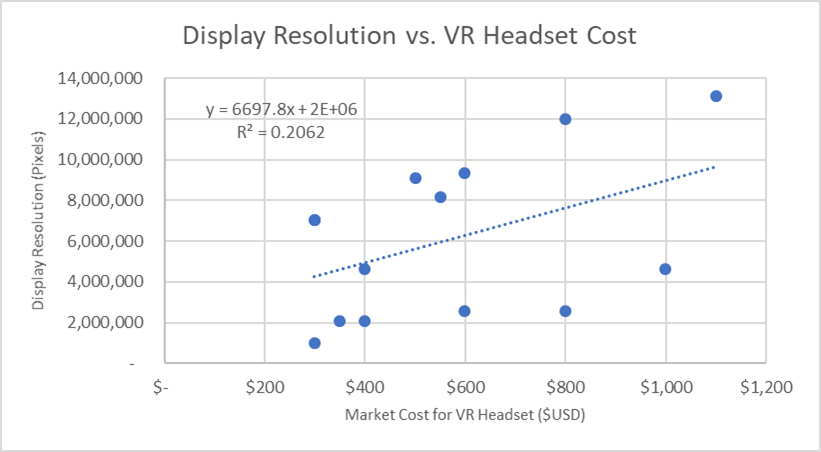
Similar to the model we developed for latency, our model for Display Resolution derived an equation for the sensitivity on consumer price of a VR headset on display resolution improvement using the past ten years of display resolution/cost data. In this example, a 50% improvement in display resolution (measure in total pixels) over the incumbent market share leaders’ suggests a market cost of $1,171USD for the VR headset – an increase of >200% over the incumbent products of the current market leaders.
Figure: Sensitivity Analysis Comparing Display Resolution and Market Cost
Hence it can be seen that the market leading VR headsets have a minimum latency of ~15 milliseconds and a total pixel count of ~22,000,000 pixels.
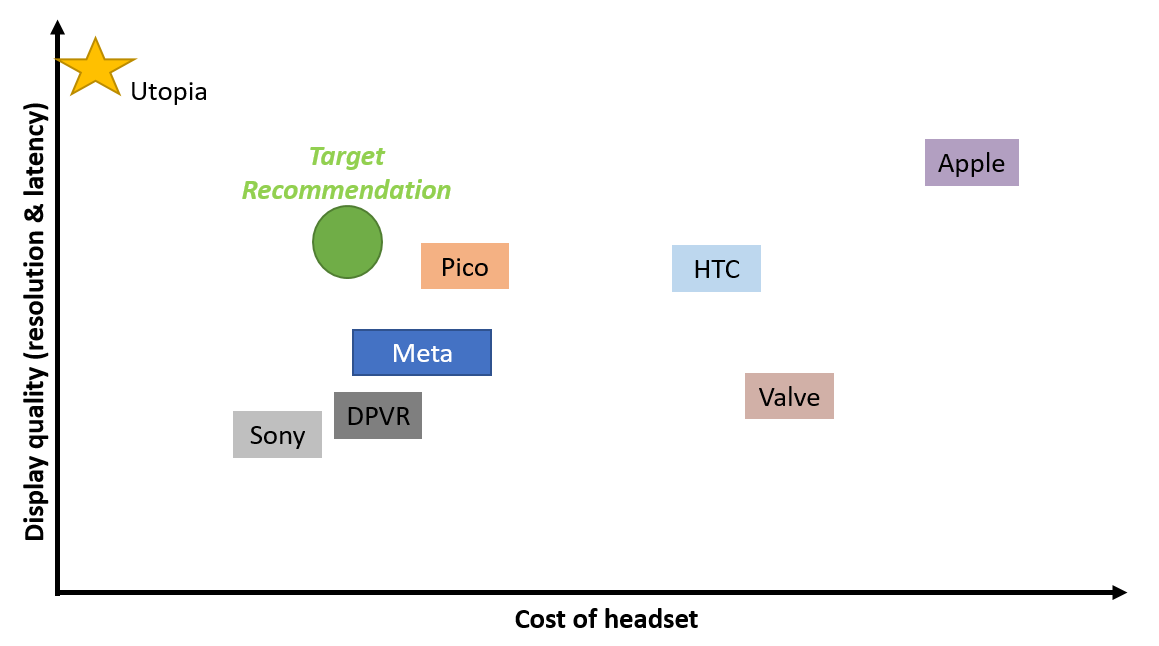
The overall comparison of the Display Quality Vs. Cost of the various competitors is indicated below. The target recommendation is a balance between the display quality and the cost because the educational output depends on the display quality too but not to a great extent. Improving the display quality is definitely beneficial but not at the compromise of increasing the cost exorbitantly. The goal is to make the VR headsets accessible to students and this means that the cost cannot be increased a lot.
Figure: Performance comparison between competitors based on FOMs
Technical Model : Morphological Matrix and Tradespace
Morphological Matrix The morphological matrix was created by comparing the key differentiating variables between the key players of the market. Apple is not considered because its specs are still not clear. These variables govern the FOMs.
Table : Morphological Matrix considering 3 main players
Technical Model Discussion Each of our selected FOM’s have distinct governing equations and four to five variables within each equation that influence each FOM’s. In each equation, both display resolution and latency play a critical role and for added interest / insight we provided a regression analysis and sensitivity analysis to show the impact on these specific variables on cost of the VR headset in the consumer marketplace for each of these variables. For building the model, the below parameters were shortlisted. Apart from the Display resolution and latency, other factors that impact the VR Education have been considered. Beyond the supplementary and interesting analysis of display resolution and latency, our technical model is focused on Display Quality and Educational Output. We have highlighted the parameters influencing these FOM’s and derived equations.
Display Quality The model was built to identify the various combinations and possible outputs based on these parameters. A Tradespace was generated. Various combinations of the parameters are considered. This FOM assesses the total display quality experience by the trainee / student immersed in the VR experience (rooted in tangible parameters related to hardware / software of the VR headset)
Display Quality = (Display Resolution * Screen Diagonal^2) / [(Screen Area * Viewing distance^2) * (1 – Latency factor)]
Educational Output
This FOM assesses the total educational outcome experience by the trainee / students immersed in the VR experience (rooted in the user experience and the parameters influencing the educational outcomes / desired knowledge retention of the trainee. This FOM is quite unique and is based on actual feedback that NORCAT, the VR company that Don Duval works for, from data and insight about educational outcomes of students using the VR immersive headset training experience. We recognize there subjectivity with this FOM, but for this assignment and our technology roadmap we felt it was important to include this given our focus is on VR for Education).
Educational Output = [(Content Quality Factor * Display Resolution) + (Immersion Factor * Screen Area)] * (Interaction Factor – Latency factor)
Due to the use of constants in computing, we will assume that the FOM is a dimensionless quantity as the units will get cancelled out by the use of the constants which will counteract on the units.
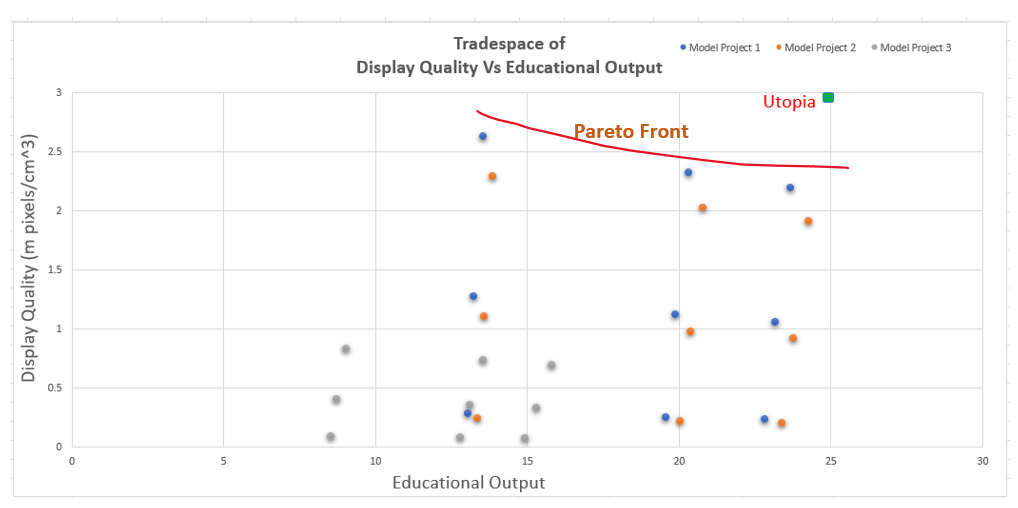
Figure : Tradespace for VR for Education
With that information, we identified which variables are fixed and which were modified – feeding into the creation of three unique models (Model 1, Model 2, and Model 3). Using that information, we developed an initial definition of our tradespace that analyzed the tension between our two selected FOM’s for each of Model 1, 2, and 3) and highlighted our utopia front and an estimation of our pareto front. As you would expect, our utopia point is where the display quality is “high”, and the corresponding education output is “high” (top right corner of our chart).
Sensitivity Analysis and Normalized Sensitivities
The sensitivity analysis was performed by making derivatives for the equation. For the sensitive parameters, normalization was applied to understand how 1% increase in the parameters impact the performance of the overall VR Education itself. In our normalized sensitivity analysis outlined in our technical model, we assessed the impact on each FOM by modifying each parameter by 1% (arbitrary for illustrative purposes) and then calculated the impact using partial derivatives for each variable based on our FOM equations. As can be seen in our Tornado Charts, the key parameters impacting each FOM is unique:
Figure : Tornado Diagram of Display Quality
The primary parameter that has the most impact on display quality is screen area. Rationale behind this makes sense, as if we fixed the pixelation / display resolution and increase the screen area, the overall display quality will be reduced impacting the overall experience.
Figure : Tornado Diagram of Educational Output
The primary parameter that has the most impact on educational output is interaction factor – the responsiveness and engagement of the VR experience by the trainee – measured from direct feedback and interaction with the educational journey the student / trainee is on.
Discussion
Based on these FOMs, it is possible to understand the way the VR Educational output will change based on the different features of the VR Headset. To understand the impact deeper, more detailed evaluation is necessary. The factors influencing the Educational output like Immersion, Interaction and Content Quality have been derived based on a research at NORCAT. More samples may result in the values for specific subjects and specific age groups. This will help in finetuning the performance to reach better results. It is also needed to further enhance our variables to better understand the key functions and form of forthcoming VR headsets that are driving market share and meeting customer expectations.
One of the more interesting analysis, using the Tornado diagrams, relates to the real-life market entry strategy of Apple’s Vision Pro – which is being sold at $3,500 USD and yet the latency and display resolution improvements over the incumbent market share leading products is seemingly very modest…if at all (fully specifications details are still being revealed). Given that, using our exclusively these two FOM’s, it makes absolutely no sense for the Apple Vision Pro to be priced at $3,500 USD. Therefore, the specifications driving the significant valuation / consumer product cost of the Apple Vision Pro must be rooted in FOM’s other than latency and display resolution. Based on our research, we believe the combined AR / VR functionality, access to content from Apple, and other variables are driving their pricing and market positioning strategy.
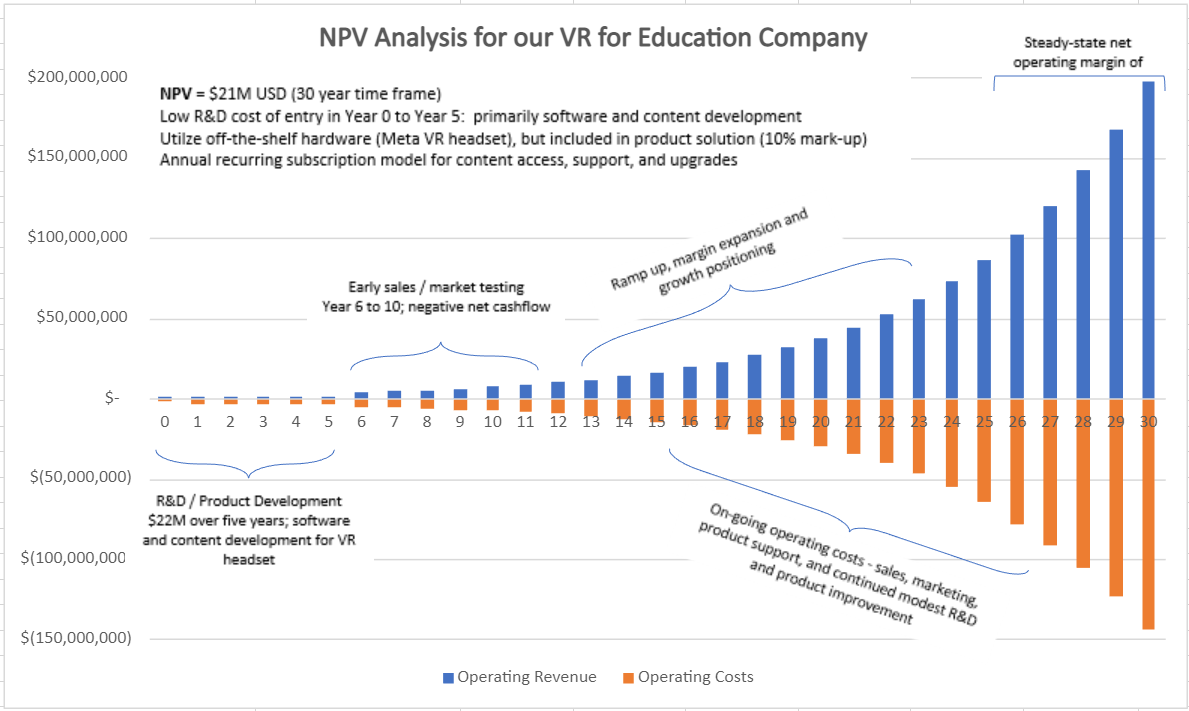
Financial Model
Key Publication and Patents
Assessment of Augmented Reality Technology’s Impact on Speed of Learning and Task Performance in Aeronautical Engineering Technology Education[1]
In this paper the study compared the learning and skill transfer among University students using AR vs traditional paper-based instructions. The study resulted in showing how AR users had significantly reduced task execution times. Pre-task “gamification and play” were also observed among the AR users, which could impact how educators and the industry assess and leverage learning strategies when using AR for job task training.
A Systematic Review of AR and VR Enhanced Language Learning [2]
This paper provides a systematic review of previous Augmented Reality (AR) and Virtual Reality (VR) studies on language learning. The analysis was conducted according to the approaches of integrating AR and VR in language learning, the main users of AR and VR technologies, research findings, ways of AR and VR in improving language proficiency and research implications of previous research. In terms of research findings, most of the studies found AR and VR tools were effective in promoting learning, enhancing motivation and students held positive attitudes towards using those tools. Due to the effectiveness of AR and VR tools, there was an inevitable trend of integrating these tools in education. Direct manipulation is better than passive viewing for learning anatomy in a three-dimensional virtual reality environment The goal of this paper was to investigate the impact of direct manipulation in virtual reality on anatomy learning. Building upon prior research showing mixed findings for the role of direct manipulation in spatially-intensive learning environments they showed 1. how the hand-held VR controller was designed to be highly intuitive and enable movements that were spatially congruent with the actions that would be taken to manipulate a physical model. 2. This study incorporated a realistic anatomical structure, with a specific learning task, rather than a more abstract, “anatomy-like” structure. The results of the study demonstrate that 1) participants are capable of successfully embodying virtual representations of internal anatomical structures if they can control the presentation; 2) participants who passively view the movement of this structure are most successful when presented with a limited number of canonical viewpoints; and 3) where the VR environment is designed to be intuitive and similar to the physical interaction in the real world, it is the participants with low spatial ability who tend to benefit most from the advantages of manipulation and interactivity, as compared with those with high spatial ability.
Challenges and strategies for educational virtual reality[3]
This qualitative study invited experts from a range of disciplines and sectors to identify common challenges in the visualization and analysis of 3D data, and the management of VR programs, for the purpose of developing a national library strategy. In this paper major challenges identified are (1) interest and awareness for the emerging technology among faculty, students, and administrators (2) locating necessary expertise in VR within their communities when knowledge is unevenly distributed (3) getting enough buy-in from administrators to support the allocation of necessary resources (4) encouraging researchers to share their projects and research outputs for the benefit of the larger community.
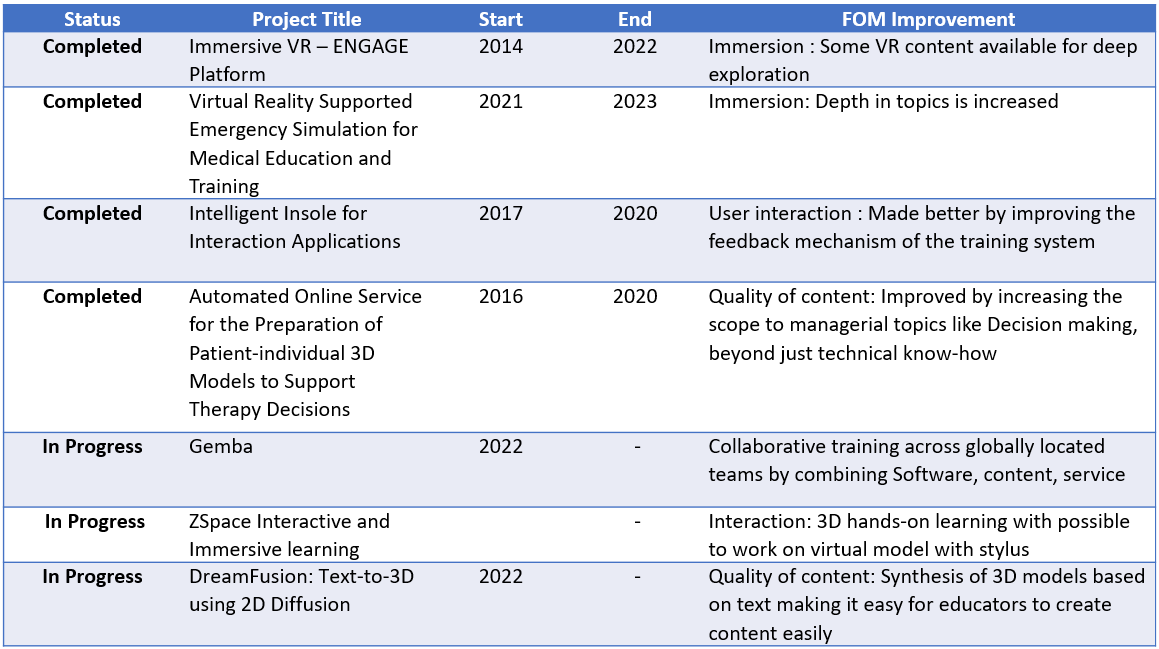
List of R&D projects
The R&D projects that are based on Educational output through VR Based education and VR Headset quality are listed below.
Currently VR Headset based education is being prototyped though we do not have exact results on how the quality of VR Headset and the quality of the content impact the learning experience.
Demonstrator project
Virtual Reality for Training in Volvo Trucks Volvo Trucks has embarked on a pioneering venture into the realm of Virtual Reality (VR) for training, placing a distinct emphasis on the intricacies of electromobility and Liquified Natural Gas (LNG). This strategic move enables training sessions without the need for the physical presence of products, leading to significant cost savings, particularly in industries dealing with substantial and costly equipment like trucks. The adoption of Oculus 2 headsets facilitates seamless remote participation in trainer-led sessions, enhancing flexibility and inclusivity in the learning process. Moreover, the safety considerations intrinsic to VR training provide employees with a secure environment for mastering skills, especially in contexts where real-world training might pose potential risks. Currently, a pilot program is underway within Volvo Trucks in the UK, reflecting a commitment to active testing and refinement of VR training initiatives. The in-house production of VR environments by Volvo Group Digital & IT, in collaboration with preferred suppliers, ensures a bespoke approach, allowing for greater control over content creation. The focus extends beyond content, encompassing the secure management of VR devices and support for end-users utilizing Oculus Headsets. As interest in VR training techniques grows, Volvo is strategically planning an expanded implementation across various brands and employee categories, signaling a transformative shift in training methodologies. The positive outcomes observed in cost savings, accessibility, and safety considerations position VR as a cornerstone in Volvo Trucks' evolving training landscape.
Technology Strategy Statement
References
[1] Kristoffer B. Borgen, Timothy D. Ropp & William T. Weldon (2021) Assessment of Augmented Reality Technology’s Impact on Speed of Learning and Task Performance in Aeronautical Engineering Technology Education, The International Journal of Aerospace Psychology, 31:3, 219-229, DOI: 10.1080/24721840.2021.1881403
[2] Josef Wolfartsberger, Jan Zenisek, Norbert Wild, Supporting Teamwork in Industrial Virtual Reality Applications, Procedia Manufacturing, Volume 42,2020, Pages 2-7, ISSN 2351-9789, https://doi.org/10.1016/j.promfg.2020.02.016.
[3] Cook, M. ., Lischer-Katz, Z., Hall, N., Hardesty, J., Johnson, J., McDonald, R., & Carlisle, T. (2019). Challenges and Strategies for Educational Virtual Reality: Results of an Expert-led Forum on 3D/VR Technologies Across Academic Institutions. Information Technology and Libraries, 38(4), 25–48. https://doi.org/10.6017/ital.v38i4.11075
[4] Marougkas, A.; Troussas, C.; Krouska, A.; Sgouropoulou, C. Virtual Reality in Education: A Review of Learning Theories, Approaches and Methodologies for the Last Decade. Electronics 2023, 12, 2832. https://doi.org/10.3390/electronics12132832
[5] Noble, S.M., Saville, J.D. & Foster, L.L. VR as a choice: what drives learners’ technology acceptance?. Int J Educ Technol High Educ 19, 6 (2022). https://doi.org/10.1186/s41239-021-00310-w
[6] Helsel, Sandra. “Virtual Reality and Education.” Educational Technology, vol. 32, no. 5, 1992, pp. 38–42. JSTOR, http://www.jstor.org/stable/44425644. Accessed 22 Oct. 2023.
[7] Cochrane, Thomas. "Mobile VR in Education: From the Fringe to the Mainstream." IJMBL vol.8, no.4 2016: pp.44-60. http://doi.org/10.4018/IJMBL.2016100104
[8] Y. Slavova and M. Mu, "A Comparative Study of the Learning Outcomes and Experience of VR in Education," 2018 IEEE Conference on Virtual Reality and 3D User Interfaces (VR), Tuebingen/Reutlingen, Germany, 2018, pp. 685-686, doi: 10.1109/VR.2018.8446486.
[9] Rojas-Sánchez, M.A., Palos-Sánchez, P.R. & Folgado-Fernández, J.A. Systematic literature review and bibliometric analysis on virtual reality and education. Educ Inf Technol 28, 155–192 (2023). https://doi.org/10.1007/s10639-022-11167-5
[10] Kuna, P.; Hašková, A.; Borza, Ľ. Creation of Virtual Reality for Education Purposes. Sustainability 2023, 15, 7153. https://doi.org/10.3390/su15097153
[11] Burov, O.Y. and Pinchuk, O.P., 2023. A meta-analysis of the most influential factors of the virtual reality in education for the health and efficiency of students’ activity. Educational Technology Quarterly [Online], 2023(1), pp.58–68. Available from: https://doi.org/10.55056/etq.435 [Accessed 22 October 2023].
