Difference between revisions of "Energy Storage via Battery"
| (4 intermediate revisions by 2 users not shown) | |||
| Line 18: | Line 18: | ||
==Design Structure Matrix (DSM) Allocation== | ==Design Structure Matrix (DSM) Allocation== | ||
[[File: | [[File:DSMbattery.PNG|1000px]] | ||
''Figure 2.1: DSM of the battery and technology hierarchy'' | ''Figure 2.1: DSM of the battery and technology hierarchy'' | ||
| Line 46: | Line 46: | ||
[[File:Equation for battery.png|800px]] | [[File:Equation for battery.png|800px]] | ||
''Note:'' basic reminders (as we rediscovered them) about the units and relationships: | ''Note:'' basic reminders (as we rediscovered them) about the units and relationships: | ||
| Line 204: | Line 191: | ||
'''Our target is to increase our research and development effort to develop an upgraded Li-ion battery suitable for Electric Vehicles, positioning ourselves amongst the market leaders by 2030, with an entry-into-market in 2023, a ramp-up period until 2025, and the ability to scale up our production from 5% up to 10% of the electric vehicle market. To achieve this target, we will invest in 3 R&D projects: NRJ, aiming to increase the specific energy density to 235 kWh/kg by 2030, and MATER and SCALE, aiming to decrease our cost to 100$/kWh respectively through reducing rare material consumption and capturing effect of scale in our manufacturing processes.''' | '''Our target is to increase our research and development effort to develop an upgraded Li-ion battery suitable for Electric Vehicles, positioning ourselves amongst the market leaders by 2030, with an entry-into-market in 2023, a ramp-up period until 2025, and the ability to scale up our production from 5% up to 10% of the electric vehicle market. To achieve this target, we will invest in 3 R&D projects: NRJ, aiming to increase the specific energy density to 235 kWh/kg by 2030, and MATER and SCALE, aiming to decrease our cost to 100$/kWh respectively through reducing rare material consumption and capturing effect of scale in our manufacturing processes.''' | ||
[[Electric_Vehicle_Charging_Technologies]] | |||
[[Battery_Electric_Vehicle_Platforms]] | |||
[[Category:3E]] | |||
Latest revision as of 21:08, 12 January 2024
Technology Roadmap Sections and Deliverables
- 3ESB - Energy Storage via Battery
Our chosen Technology is that of electricity storage via battery for the purpose of vehicle mobility. We will refer to it within our descriptions as "battery" This is a level 3 technology. It serves the major subsystems found in electric vehicles
Roadmap Overview
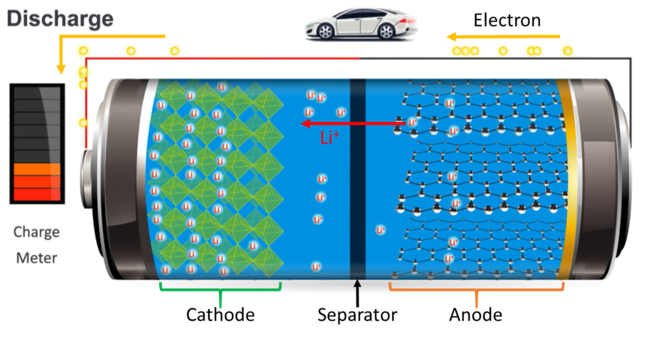
The working principle and architecture of an electrical battery are depicted in the below.
Figure 1.1: Lithium-Ion Battery (Technology ID# 1.000) working principle and architecture
An electrical battery can store and use energy by chemical reaction. It is composed of an anode (-), a cathode (+), the electrolyte, and separator. The chemical reaction is a redox reaction caused by an electrical difference between the anode and the cathode. That is, electrons are expelled from the anode to the cathode via an external circuit and metal ion in the electrolyte receives the electrons on the cathode. This redox reaction lasts until electrical equilibrium. Although the primary battery is designed to be used once and discarded, the secondary battery can be recharged with electricity and reused. First secondary batteries based on Ni/Cd and Pd-acid were produced around 1900. After that, Ni/Zn battery which showed higher specific density appeared in the 1950s. In 1990, Lithium-ion battery (LIB) which is a major rechargeable battery today was released. The capabilities of LIB such as specific density, volumetric density, and cycle durability have improved more and more by developing new materials and the energy price is going down. These trends contribute to the growing availability of Electric vehicles.
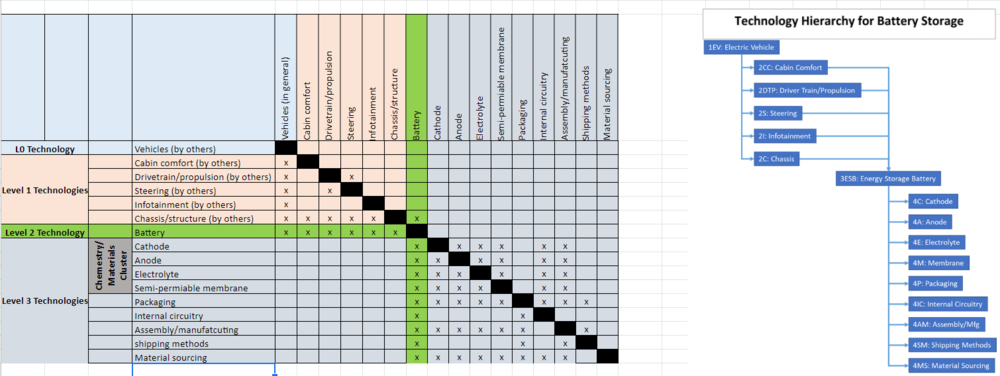
Design Structure Matrix (DSM) Allocation
Figure 2.1: DSM of the battery and technology hierarchy
Our technology of interest is identified in the DSM above with green highlighting. it is portrayed in the context of the consuming technology of interest, electric vehicles, where we identified the typical consuming technology systems for reference. The diagram on the right is a dependency tree that has been extracted from the DSM. The battery storage technology consumes technology related to battery chemistry, including cathode, anode, catalyst, and semi-permeable membrane technologies. Battery technology also consumes technology related to the design of the shipping, manufacturing, material supply chain, and internal circuitry technologies
Roadmap Model using OPM
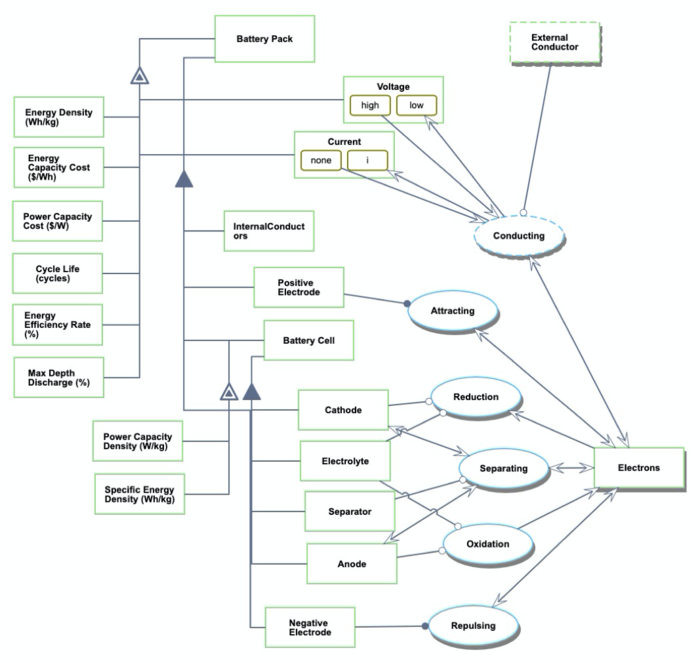
We provide an Object-Process-Diagram (OPD) of the Battery technology in the figure below. This diagrams captures the main object of the technology (Battery), the value-generating processes and different instruments associated with their characterization by Figures of Merit (FoM).
Figure 3.1: OPD representation of a battery pack
An Object-Process-Language (OPL) description of the roadmap scope is auto-generated and given in OPL_Battery. It reflects the same content as the previous figure, but in a formal natural language.
Figures of Merit
We identify several Figures of Merit (FOMs) for the energy storage via battery technology shown in a table below:
The first two (shown in bold) are mainly used to assess the battery itself. These FOMs are often used for evaluation of the battery performance. The other rows represent additional FOMs for a rechargeable battery.
Besides defining what the FOMs are, some of the key governing equations are described in a table below:
Note: basic reminders (as we rediscovered them) about the units and relationships:
- we used traditional units of power and energy for electricity, yet in order to compare across different energy storage technologies, a reminder that Wh and J are two units measuring energy (1Wh = 3600 J).
- Electric power: P = V * I where V is the electric potential (volts, V) and I the current (Ampere, A). Battery’s charge capacity is the amount of current delivered per unit of time (A*h, or in SI units A*s or Coulomb). The battery's power capacity is the rate at which the current I is doing electrical work by flowing through the electric potential (in W or J/s).
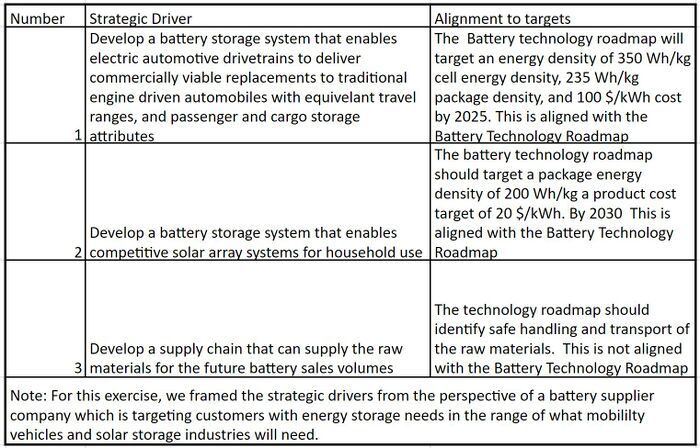
Alignment to Strategic Drivers
Table 4.1: Alignment to Strategic Drivers
Positioning of Company vs. Competition
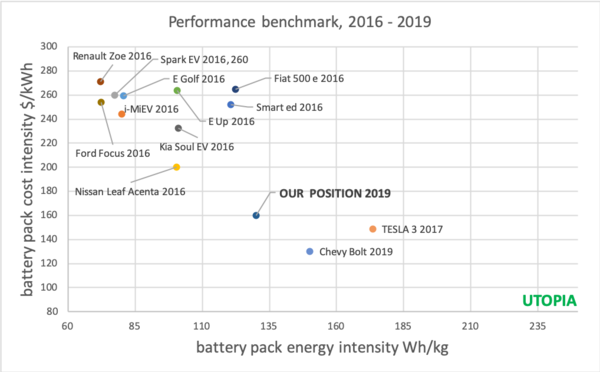
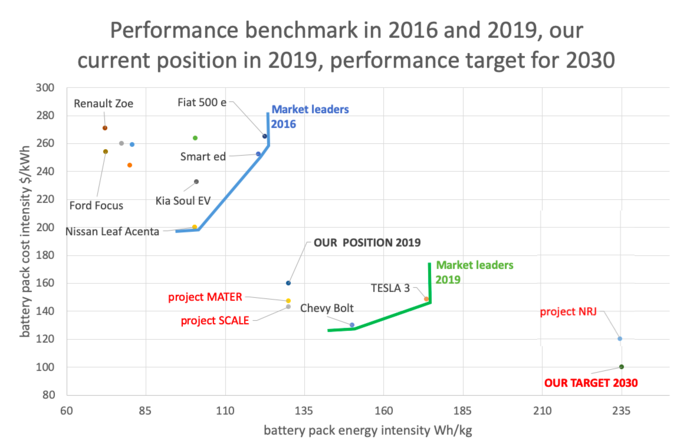
We position ourselves as a battery supplier of a mid-market, non dominant electric vehicle. We explore the performance of our competitors in 2016-2019 across our two fundamental FOMs of our battery pack: Energy intensity (Wh/kg) and Cost Intensity of energy ($/kWh). The graph provided below is based on this benchmark of battery packs performance used in different medium-size electric vehicles on the market.
Figure 5.1: Benchmark of performance of battery packs for various mid-size electric vehicles, in 2016-2019
Comparing with different other sources, we observe over time that Lithium Ion technologies seem to be improving energy density at a rate of about 5% per year and improving in cost at a rate of about 20% per year. We note a range of ambitious targets, that might seem over-optimistic: CATL, a leading battery manufacturer for electric vehicles, has roadmap diagrams citing energy densities at 400 Wh/kg at around 2020. A posting discussing a "Dry Battery Electrode" technology which was purchased by Tesla speaks of allowing the current 300 Wh/kg batteries and improving them to about 500 Wh/kg. Pricing data and were not available with this article, but the author was speculating at a timeframe for deployment of about 2021. We will reevaluate more appropriate targets based on our technical model.
Tesla has stated that their current cathode technology in production is a Nickel-Cobalt-Aluminum (NCA) mixture and they state that the typical competition battery is utilizing Nickel-Manganese-Cobalt (NMC). They have also stated that Cobalt prices are the key driver of cost with the battery technologies overall. They have stated that they are experimenting with reduced amounts of Cobalt as a pathway to reduced costs. It has also been reported that Chinese battery manufacturer CATL is tranistioning from a 20% Cobalt formulation to a 10% Cobalt formulation in 2019.
Technical Model
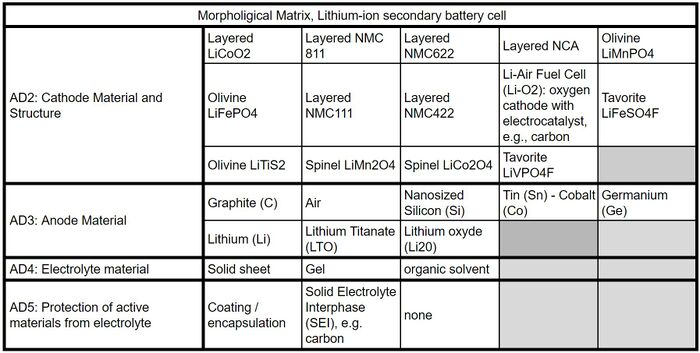
In order to assess the feasibility of technical targets, at the level of the battery roadmap, we develop a technical model. The purpose of this model is to evaluate the sensitivity of each technology development and its feasibility. As a first step, we develop a morphological matrix that shows architectural decisions for the next Lithium-Ion battery.
Figure 6.1: Morphological matrix, Lithium-ion secondary battery cell
The morphological matrix for the battery technology is provided above illustrating the current known materials and methods for several of the key design decisions. The projects stemming from this roadmap could include these options or could identify additional options for exploration.
As a second step, let us show the equation which shows one of our important FOMs, Specific Density [Wh/kg]. This FOM can be calculated with an equation as below:
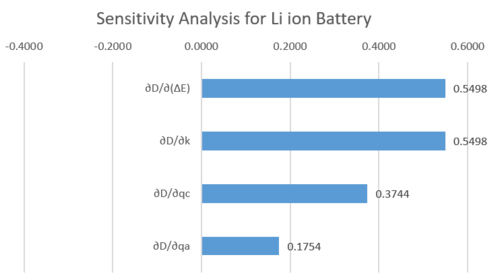
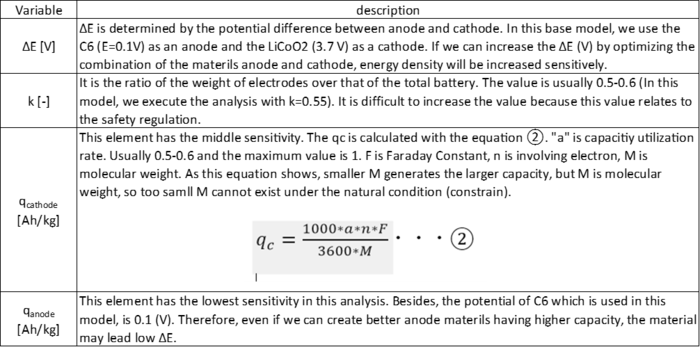
The results of the sensitivity analysis are shown in the figure below and summarized the result in a table below:
Figure 6.2: Sensitivity_analysis_for_specific_energy
Table 6.1: Summary of Sensitivity_analysis
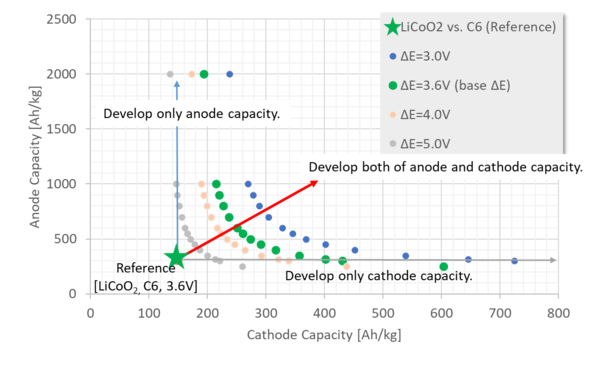
To check the feasibility if which technology development can achieve our objective energy density (350 Wh/kg) we analyze the parameters of ΔE, qc and qa.
Figure 6.3: Feasibility Analysis
From the feasibility analysis, we can say if the ΔE is less than 5V (usual ΔE is about 3.6V like a reference), it is difficult to achieve the target D (350 Wh/kg) only by developing an anode. Also, according to equation②, the less molecular weight (M) contributes to the higher cathode capacity. However, to improve the cathode capacity over 400 [Ah/kg], the molecular weight of the cathode material must be less than 67 [g/mol] even if the value of "a" ideally equals to 1. This result definitely limits the design of the cathode material. Therefore, our suggestion from the technical perspective is to develop not only cathode but also anode to increase their capacity by considering their combination for high ΔE.
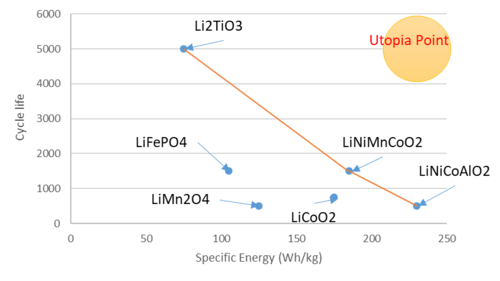
Note: As a historical data, the more energy density shows the less lifecycle shown in the graph below. Interestingly, these two parameters look like a tradeoff, so we have to evaluate the electrode materials in terms of lifecycle even if these shows desired performances (high ΔE and capacity).
Figure 6.4: Tradespace clustered by architectural decision about the cathode, Lithium-ion secondary battery cell
Keys Publications and Patents
Since the Nobel Prize in Chemistry 2019 was awarded jointly to John B. Goodenough, M. Stanley Whittingham and Akira Yoshino “for the development of lithium-ion batteries”, we select some of their publications. The three articles we chose give a general overview of the electrochemical batteries history and future challenges (Whittingham 2012), a more specific vision of the Lithium-ion battery by its inventor (Yoshino 2012), and eventually one of the current area of innovation with all-solid state battery system (Braga et al. 2017). For the patents, we recommend two direct applications in the vehicle industry with two patents assigned to Toyota (Abe et al. 2017) and to Ford Global Technology (Vann Decker et al. 2014), and an “accompanying” type of patent related to battery housing, jointly assigned to Bosh and Samsung (Woehrle and Leuthner 2017).
A detailed review is provided in Li-Ion Key publications and patents.
- Braga, M. H., N. S. Grundish, A. J. Murchison, and J. B. Goodenough. 2017. “Alternative Strategy for a Safe Rechargeable Battery.” Energy and Environmental Science 10 (1): 331–36.
- Whittingham, M. Stanley. 2012. “History, Evolution, and Future Status of Energy Storage.” Proceedings of the IEEE 100
- Yoshino, Akira. 2012. “The Birth of the Lithium-Ion Battery.” Angewandte Chemie - International Edition 51
- Abe, Takeshi, Akira Tsujiko, Tomitaro Hara, Keiko Wasada, and Sachie Yuasa. 2017. Method of charging and maintaining Lithium-ion secondary battery, battery system, vehicle and battery-mounted device. US 9,812,741 B2, issued 2017.
- Vann Decker, Edward, Chi Paik, Dawn Bernardi, and William Moore. 2014. Method For Revitalizing And Increasing Lithium Ion Battery Capacity. US 9,358,899 B2, issued 2014.
- Woehrle, Thomas, and Stephan Leuthner. 2017. Battery Housing For Lithium-ion Cells. US 9,806,325 B2, issued 2017.
Financial Model
Figure 8.1: Battery value chain. We assume we are a supplier of battery packs for Electric Vehicles. Image from [1]: Schmuch, R., Wagner, R., Hörpel, G., Placke, T. & Winter, M. Performance and cost of materials for lithium-based rechargeable automotive batteries. Nat. Energy 3, 267–278 (2018).
We are an existing battery supplier targeting electric vehicle market, with a product equivalent today (2020) with the performance of the “Renault Zoe” battery, i.e. we are not market leader, we have today a 5% market share on the global electric vehicles market [2] with a market strategy targeting increasing our market share to 10% of the electric vehicles market worldwide, equivalent of today’s Nissan Leaf. As a reference, Tesla Model 3 captures the biggest market share with 19% of electric vehicles sales worldwide [2].
As a general context, we evaluate that the sales of electric vehicles, which today represent less than 1% of the number of cars sold worldwide [3], will exponentially increase in the next decade, from 0.8 million today up to 25 millions or more of EV vehicles sold in 2030 [4]. We conservatively assume that the number of electric vehicles sold per year will be annually multiplied by 1.4, reaching 23 million in 2030.
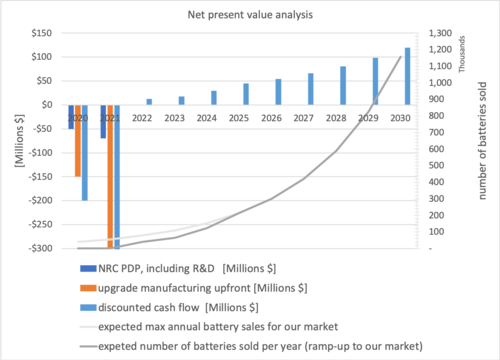
In this context, we carry on a baseline NPV analysis with a 10-year period of observation. We assume that our product is reaching and maintaining a share of 5% of the EV Market based (“free-riding” on the R&D, no additional investment) with a battery pack cost of 160$/kWh [5, 6], and an energy capacity per battery of 55 kWh (with a density of 130 Wh/kg). We use a discount rate of 15%. We include upfront expanses to upgrade manufacturing facilities, and non-recurring cost of the product development which include R&D expenditures. We allow 2 years of project development and start the sales in 2023 with a ramp-up to our full estimated market share from 2023 to 2025.
An illustration of the discounted cash-flow over the period of observation is provided below, the detailed assumptions and results, with references, are presented in detailed_NPV_Battery.
Under this set of assumptions, our project is estimated to have a net present value (NPV) of $3.25Million.
Figure 8.2: NPV analysis, base-line scenario
R&D Portfolio
We position ourselves in the current market in terms of performance and set our target for a research and development projects portfolio to enable us to increase our market share from 5% to 10% by reaching a battery pack cost of 100$/kWh with a specific energy density of 235 Wh/kg (equivalent to a 72 kWh battery pack instead of 55 kWh today, keeping our current battery total weight constant at 305 kg).
Figure 9.1: Performance benchmark and target 2030, with single contribution of each of our selected R&D projects individually ("MATER", "SCALE", and "NRJ").
Based on this assessment, we plan to combine the 3 following projects to improve our lithium-ion battery packs and meet our 2030 target:
- project NRJ: increase the battery pack specific energy from 130 to 235 kWh/kg by 2030. This target is consistent with observed target [1] for Electric Vehicles penetration in the personal vehicles market and shall enable us to position ourselves as market leaders in the future. This project will be allocated to the cathodes and anodes materials exploration team, in charge specifically of the electrode design (related to architectural decisions 2, 3 and 7)
- project MATER: minimize the use of costly, rare materials identified as potential bottlenecks such as cobalt[2], to decrease the material cost per battery pack from $1,000/battery pack today to $950/battery in 2030. This material costs is the sum of the costs of cathode, anode, electrolyte, separator and other materials. This project will also be allocated to the cathodes and anodes materials exploration team.
- project SCALE: improve the overhead cost of manufacturing and labor cost per battery, from $2,900/battery today to $2,050/battery in 2030, based on economies of scale in the manufacturing process at the cell level (e.g. improving the ion intercalation process) as well as at the assembly level. This project will be allocated to the process exploration team (and is mainly related to architectural decisions 1, 8, 9 and also 4, 5, 6).
The different targets are set consistently so the combination of the three R&D projects will enable us to reach our 2030 target.
Figure 9.2: Project Milestones for "MATER", "SCALE", and "NRJ". Specific references for our R&D portfolio:
- 1. US Drive. Electrochemical Energy Storage Technical Team Roadmap. (2017).
- 2. Olivetti, E. A., Ceder, G., Gaustad, G. G. & Fu, X. Lithium-Ion Battery Supply Chain Considerations: Analysis of Potential Bottlenecks in Critical Metals. Joule 1, 229–243 (2017).
Potential delta NPV impact for each project
Using the financial model, we approximate the potential added NPV resulting from each R&D Project. We assume the following effects for each project:
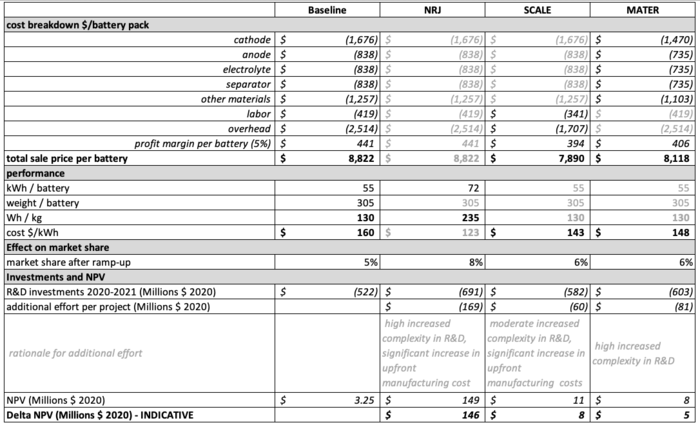
- project NRJ is crucial to increase our market share from 5% (business as usual) to 8%. This project does not change our production cost and margin per battery pack, but increases the performance. It thus requires significant additional effort in the NRC PDP (technical complexity to achieve cutting-edge technological performance) and in the upfront manufacturing cost (anticipating the additional market share and supply required).
- projects MATER and SCALE would separately moderately increase our market share up to 6%, decreasing the production cost of selected components in the cost breakdown (see table below). This decreases our production cost per battery, as well as our margin per battery (assuming a 5% fixed margin). However, we would benefit from the higher sales volume, overall increasing our expected profit.
- We estimate that project SCALE would require a moderate increase in NRC PDP, and significant effort in upfront manufacturing cost. Project MATER would require significant effort in NRC PDP, including testing laboratories and efforts.
Table 10.1 below summarizes the different effects of each project taken separately, and the delta NPV from our perspective of battery suppliers. We observe a very high sensitivity to the increased market share at high profit margin (NRJ), with a significant positive delta NPV (estimate +$146 Millions 2020), we would need to refine this value adequately with lower profit margin, which would be more realistic and in phase with our cost reduction strategy.
Table 10.1: Change in assumptions and results in terms of delta NPV for each selected R&D project
Overall, this analysis provides additional insights to determine the possible allocation of resources and expected returns for each project. We highlight the project NRJ as a crucial project to increase our sales volume and market share: this is synergetic with SCALE and MATER.
Technology Strategy Statement
Our target is to increase our research and development effort to develop an upgraded Li-ion battery suitable for Electric Vehicles, positioning ourselves amongst the market leaders by 2030, with an entry-into-market in 2023, a ramp-up period until 2025, and the ability to scale up our production from 5% up to 10% of the electric vehicle market. To achieve this target, we will invest in 3 R&D projects: NRJ, aiming to increase the specific energy density to 235 kWh/kg by 2030, and MATER and SCALE, aiming to decrease our cost to 100$/kWh respectively through reducing rare material consumption and capturing effect of scale in our manufacturing processes.
Electric_Vehicle_Charging_Technologies Battery_Electric_Vehicle_Platforms
