Difference between revisions of "Space Booms"
Howdybrowdy (talk | contribs) |
|||
| (108 intermediate revisions by 3 users not shown) | |||
| Line 1: | Line 1: | ||
=Technology Roadmap Sections and Deliverables= | =Technology Roadmap Sections and Deliverables= | ||
This technology's unique identifier is: | This technology's unique identifier is: | ||
| Line 5: | Line 6: | ||
==Roadmap Overview== | ==Roadmap Overview== | ||
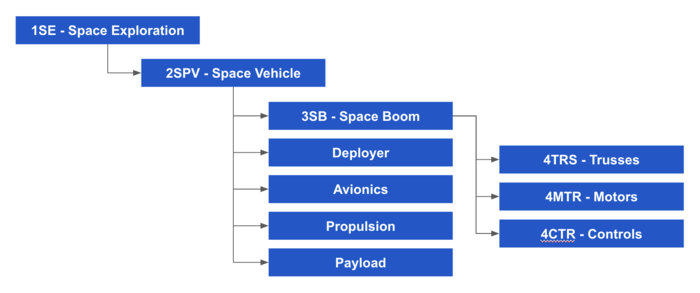
This roadmap is a level 3 (subsystem) assessment of space booms. | This roadmap is a level 3 (subsystem) assessment of space booms. As illustrate in the technology hierarchy tree below, space booms are structures used to position space instruments in relationship to the primary mission vehicle. The vehicles are the level 2 (system) for this roadmap and the hardware and software elements (and other components) of the booms are level 4 (components). Space booms could fall into many L1 ecosystems, but the focus here will be on using space booms as enabling infrastructure for space exploration. Booms may not seem like glamorous pieces of technology, but they have a glamorous history of enabling space instrumentation by providing the right geometry, relationships, support and protection. On the International Space Station alone, Northrup Grumman's FAST Mast allows the station's solar panels to be extended and retracted as needed, while Canadarm 2 captures incoming resupply vehicles and conducts critical robotic repair on the exterior of the station. Some booms are as simple as a single metal rod, but others are transforming apparatuses that launch in compact forms, while still supporting instruments over great distances once deployed. For this research, primary vehicle and instrument are relative terms; it may be a satellite is the primary vehicle with space boom attached, but the satellite can also be an instrument relative to a larger primary mission vehicle. | ||
[[File:SpaceBoom Hierarchy Tree.png|700px]] | |||
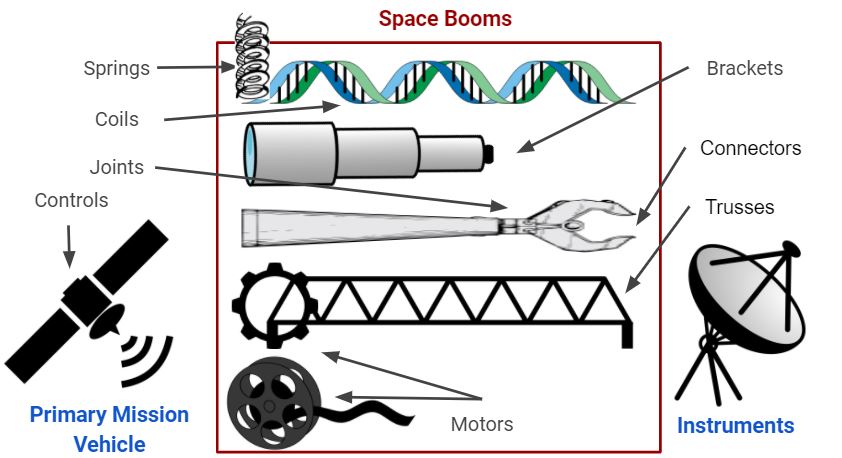
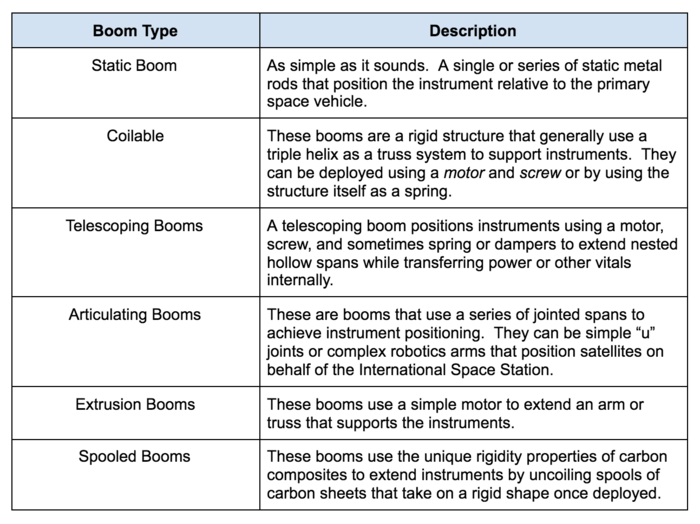
There are several types of booms that have appeared in our research, each with varying degrees of complexity | There are several types of booms that have appeared in our research, each with varying degrees of complexity. Static Booms are not depicted in the graphical representation as they are simply straight support with no moving parts. | ||
[[File:BoomTypes.png| | [[File:BoomTypePicture.jpg|600px|frame|left|Graphical Depiction of Boom Types]] | ||
[[File:BoomTypes.png|700px]] | |||
There may be other specific types of booms, but these are space industry standards and encompass the vast majority of space booms used since the 1960. | There may be other specific types of booms, but these are space industry standards and encompass the vast majority of space booms used since the 1960's. It is important to understand that these boom categories are large and encompass quite a diversity of booms. For example, robotic arms are encased in the articulating booms category despite the fact that they are bundled with relatively rudimentary articulating supports. Generally, space booms rely on innovation and technological advances to fit within small spaces, but allow instruments to conduct tests well away from the primary mission vehicle. This leads to a value function for booms: to take up as little space, to use as little mass, and to maintain affordability, allowing the maximization of spacecraft features and instruments. | ||
The research into booms is ongoing, but there is already a celebrity list of booms that are both interesting and demonstrate great engineering. CanadaArms 1 and 2, the Magnetometer Boom that crashed with Cassini into Saturn, and | The research into booms is ongoing, but there is already a celebrity list of booms that are both interesting and demonstrate great engineering. CanadaArms 1 and 2, the Magnetometer Boom that crashed with Cassini into Saturn, and the Able Engineering ADAM Mast that supported the Space Shuttle Topography Mapping in 2000 all supported unique missions and enabled human utilization of space. From our growing list of research subjects, a reasonably complete list of boom parts is available; enabling a consistent decomposition across the various types. The decomposition is listed in the OPM and allows for Level 4 (component) analysis to be accomplished. | ||
Space booms are not the lead actors for the space movie. However, they are critical infrastructure and enable significant improvements in capability. | Space booms are not the lead actors for the space movie. However, they are critical infrastructure and enable significant improvements in capability. Making gains in the space boom technology arena means taking advantage of component technology and advanced material sciences to reduce cost, mass, and launch volume compared to the desired span. Doing so increases overall mission effectiveness and user benefit. | ||
==Design Structure Matrix (DSM) Allocation== | ==Design Structure Matrix (DSM) Allocation== | ||
[[File: | [[File:SpaceBoom DSM 3.png|800px]] | ||
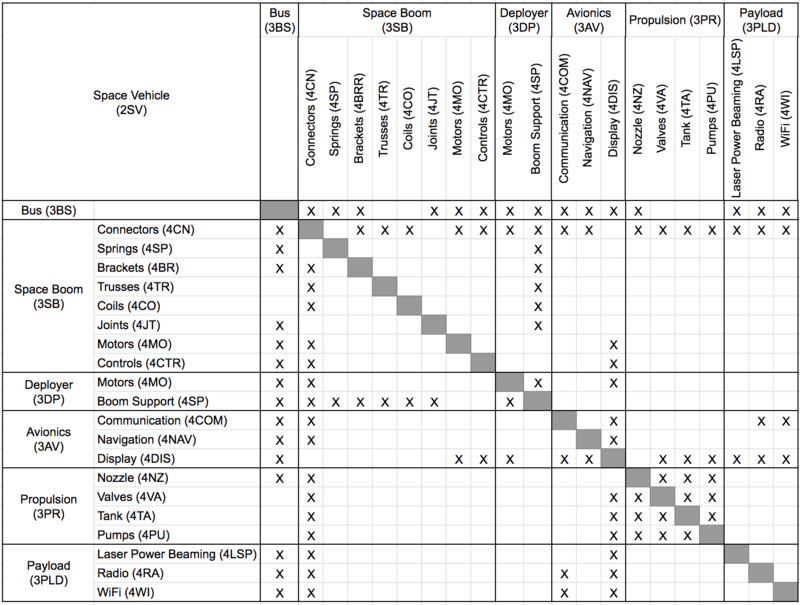
This DSM shows that space booms are part of the larger space vehicle system, where a space vehicle could be a satellite, a rover, or another type of payload. As a L3 technology, space booms rely on other L3 technologies like propulsion | This DSM shows that space booms are part of the larger space vehicle system, where a space vehicle could be a satellite, a rover, or another type of payload. As a L3 technology, space booms rely on other L3 technologies like propulsion and enable other L3 technologies like payloads. Space booms rely on enabling L4 technology such as carbon composites and controls. | ||
==Roadmap Model using OPM== | ==Roadmap Model using OPM== | ||
[[File: | [[File:SpaceBoomOPD.jpg|600px]] | ||
[[File:Space OPL.png|400px]] | [[File:Space OPL.png|400px]] | ||
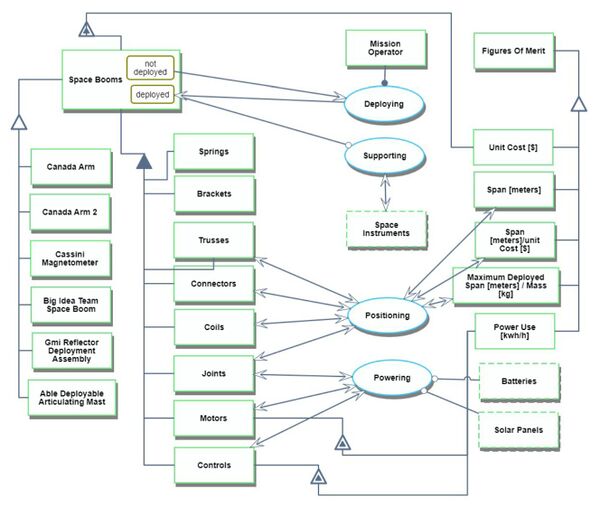
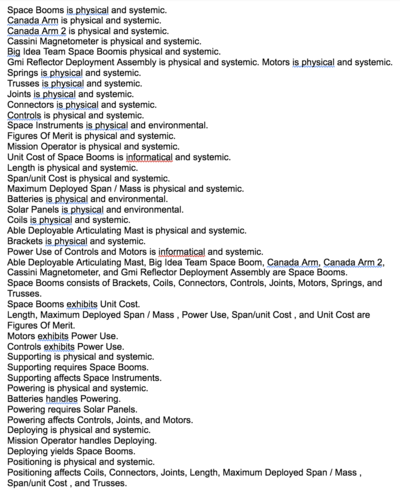
The Object Process Diagram (OPD) captures figures of merit, several examples of space booms, and the main processes and components involved in building and operating a space boom. An Object Process Language (OPL) description of the roadmap scope is auto-generated and shown on the right. This natural language and graphical depiction does an excellent job of communicating the primary processes that space booms perform and support. Additionally, it conveys the key components, key players, and core figures of merit for the domain. | |||
==Figures of Merit== | ==Figures of Merit== | ||
The table | [[File:NewFOM.jpg|800px|frameless|Figures Of Merit]] | ||
[[File: | |||
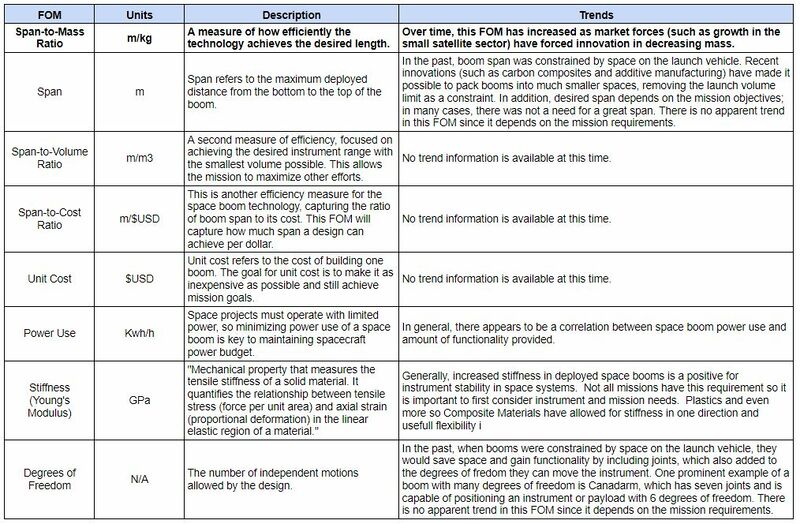
The table above summarizes several figures of merit (FOM) to measure space boom technology. The FOM in bold, span-to-mass ratio, offers a unique perspective about the efficiency with which a space boom performs and is the main FOM used in this roadmap. Optimizing this FOM means making it as large as possible, so that a customer can have the span they need while minimizing the mass they must use to get it. | |||
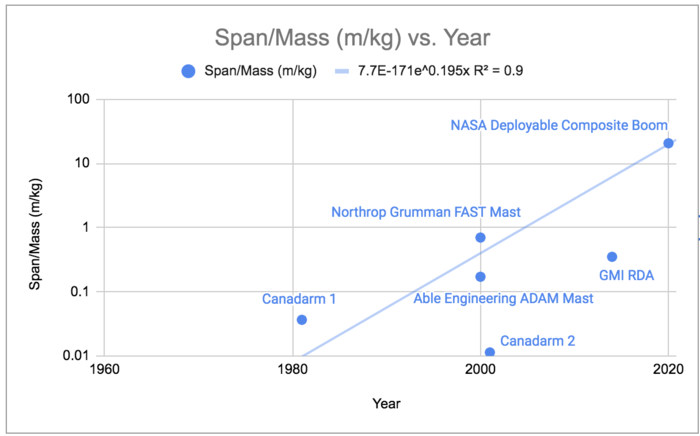
This figure shows the development of the span-to-mass ratio over time. There have been steady improvements since the 1980's and very rapid improvement in the last few years with NASA R&D simultaneously identifying a few geometric and material improvements. | |||
[[File:SpantoMassOverTime Log.png|700px|Span to Mass Raito]] | |||
==Alignment of Strategic Drivers== | |||
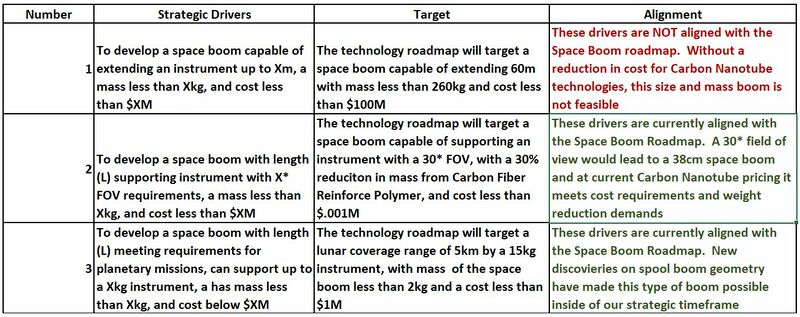
Based on the displayed FOMs, our team can define our strategies, set targets for success, and then use our roadmap to determine if they are feasible now or require patience before execution. The below chart depicts the strategies we considered, the targets associated based on roadmap FOMs, and whether or not they are currently viable: | |||
[[File:StratDriverFinal.jpg|800px|frameless|center|Strategic Drivers]] | |||
Strategic driver number one is an idea to build the longest mast ever deployed in space, that will fit on market available launch options. 50m plus booms died with the ABLE Engineering Mast that flew on the Space Shuttle, eliminating extremely sensitive sensors as a payload and requiring whole new missions. Filling that gap will require advancements in volume and mass properties. Unfortunately, Carbon Nanotube weight reduction is not offset in this use context by the considerable cost increase. However, Strategic Driver number 2 aims to undercut the current weight standards for much shorter booms. We believe it is accomplishable using Carbon Nanotube Structures, which will take some investment but can still be competitive from a cost position given that it is a relatively small boom application. Finally, Strategic Driver number 3 is targeting a boom that can support planetary instruments support ahead of the Artemis and other lunar or Martian missions. It is atypical for space technology companies to consider planetary missions, but these missions offer an opportunity if our spooling boom technology can be adapted. | |||
==Positioning: Company Versus Competition== | |||
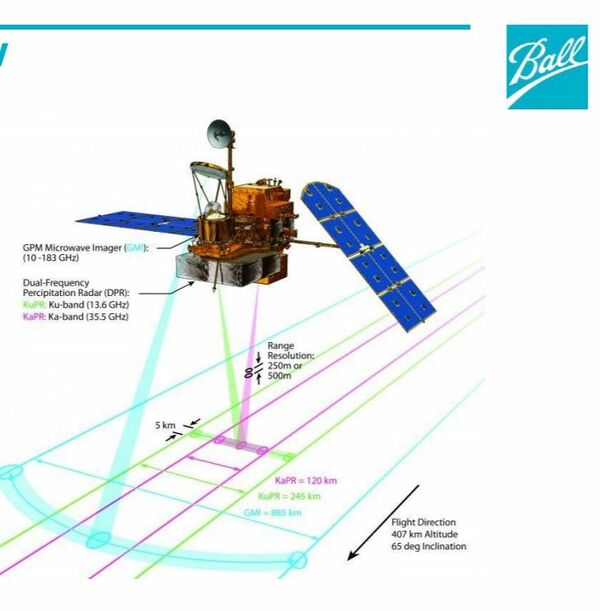
The first step to defining a winning strategy for space boom technology development is to understand the current landscape of companies and government agencies. To do this requires a reference point to base industry assumptions against. Our reference point is the Global Precipitation MEasurement Microwave Imager Dish. It uses an articulating boom, to cover a relatively short span, has a complex deployment process, does not deliver electricity to the dish, and has high stability (stiffness) requirements. It is approximately an average boom, given that mission requirements are typically unique. Here is a graphic of the boom in action: | |||
[[File:Gmidish.jpg|600px|GMI Dish]] | |||
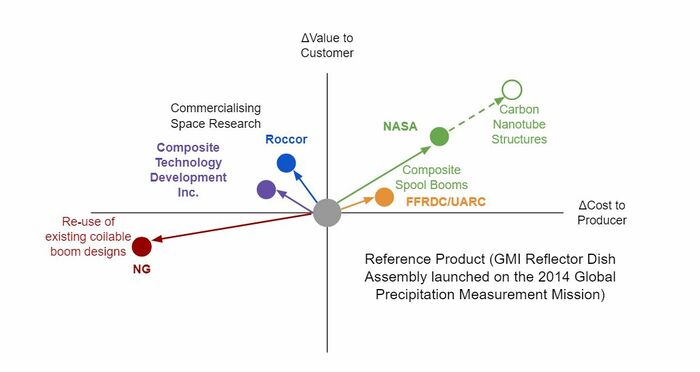
From this reference point, we can plot the industry and competitive landscape for space booms. The following chart highlights the various strategies employed by a couple of distinct groups: | |||
[[File:Space Boom Corporate Strategies.jpg|700px]] | |||
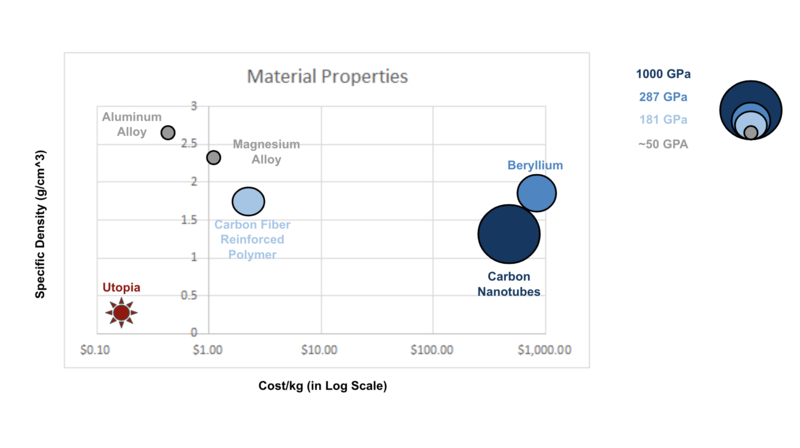
As the chart displays, the landscape for space booms is highly dependent on whether or not there is government funding associated with space missions. Government funding tends to be focused on novel space exploration that requires unique boom solutions. This drives NASA, the United States Space Force, and supporting research laboratories to accept the additional cost to the producer to gain the added value to customers. These groups are pushing the envelope of material sciences, uncovering optimal geometry, and innovating mechanisms to create compact and light launch profiles. Our team conducted a review of NASA’s Carbon Nanotube Materials for Space Structures and they clearly are targeting it as a lighter and stronger next step. The chart below demonstrates where it currently stands in comparison to existing space materials in terms of cost, density, and stiffness: | |||
[[File:SpaceBooms Material Properties.png|800px]] | |||
The previous chart demonstrates that Carbon Nanotube Structure Technology will both make space structures lighter and better at supporting instruments, but currently only does so at a significant increase in cost. | |||
On the commercial side, there are two strategies. One is to try and commercialize, or make profitable, the previously stated novel solutions after they have been successfully demonstrated. Two small space company examples are listed who are working to refine, design for manufacturability, and proliferate a NASA spool boom technology: Roccor and Composite Technology Development (CTD), Inc. The second strategy, favored by large space companies, is to rely on mature, albeit dated technologies. For example, Northrop Grumman has re-used virtually the same coilable boom design, AstroMast, on more than a dozen missions dating back to the 1970’s. Value to the customer is based on an assessment of FOM that particular booms can achieve. | |||
Returning to our strategic drivers the positional comparisons look like this: | |||
*Strategic Driver 1 | |||
[[File:StratDriver2.jpg|700px|frameless|center|Strategic Driver 2]] | |||
*Strategic Driver 2 | |||
[[File:Stratdriver3.jpg|700px|frameless|center|Strategic Driver 3]] | |||
*Strategic Driver 3 | |||
[[File:Stratdriver1.jpg|700px|frameless|center|Strategic Driver 1]] | |||
==Technical Model== | |||
In order to understand the feasibility of strategic targets for space booms, a technical model is required. The first step to building a technical model for space booms is to consider what is “good” for space booms and the environment they operate in. Good in this case is defined as performing their task over the duration of the mission for an affordable cost while adhering to mass and volumetric constraints imposed by the launch vehicle. While cost and durability are relatively easy to understand, the combination of performing its designated mission and fitting inside the rocket fairing poses a challenge for booms. We defined the role of space booms as supporting an instrument in relation to a main body, which brings with it a couple of requirements based on the use context. | |||
The three types of force that space booms may endure while supporting an instrument are compressive loading, torsional forces and angular forces. These often depend on the use case for the system whether it be orbital, lunar, or planetary. The three unique forces could be simultaneously applied, but the assumption for this analysis is that they are mutually exclusive. This creates the requirement to resist forces that may injure the spacecraft or the instrument. Another requirement imposed on space booms is that of length or span as we are defining it for this analysis. Many instruments require a minimum amount of distance from the body given field of view requirements, coverage over a celestial body, or potential for instrument noise. This again depends on the instrument and the use case. | |||
Finally, we must consider the constraints of space systems. Anything we launch into space is constrained in terms of mass by the launch vehicle and volumetrically by the launch fairing. Further constraints can be imposed from the space vehicle itself in terms of mass, volume, and cost budgets. Efficiency is therefore ideal. Gathering these pieces, we begin to develop an idea of utility for a space boom: efficiently achieving the desired span and support requirements. Our analysis assembled a model using these: | |||
[[File:SpaceBooms Model Eq1.png|300px]] | |||
Where L = length of the boom (context dependent minimum length required) [m], S = force (context dependent minimum force required) [N], and M = mass of the boom [kg]. For length and force, the technology designer must make a few choices about goals: | |||
*What is the requirement for selecting a length? There are three potential situations: | |||
**Minimum length needed to clear the field of view (FOV) | |||
**Length needed to achieve a sufficient coverage range on a celestial body | |||
**Minimum length needed to prevent interference with instruments that may cause noise | |||
*What are the forces acting on the boom? There are three potential forces that are not mutually exclusive: | |||
**Compressive force | |||
**Torsional force | |||
**Angular force | |||
The next step in analysis is considering a simplified use case. For this analysis, we focus on boom designed for use on the Moon, where the boom will vertically support an instrument. In this scenario, we want to achieve sufficient coverage of the lunar surface. This makes defining equations and conducting a sensitivity analysis simpler because the forces expected (compressive loading) and the length requirement (based on range coverage of the Moon) form the utility function, with mass working to keep them efficient. In this case, critical load refers to the maximum load the space boom can carry when it is used as a tower, which is calculated with Euler’s critical load formula. Coverage range refers to the distance a payload on top of the space boom can see on a planetary surface, which is calculated using Pythagorean theorem. Plugging in the formulas for Euler's critical load and Pythagorean theorem into the utility equation: | |||
[[File:SpaceBooms Model Eq2.png|300px]] | |||
In this composite equation d is coverage range, R_P is the radius of the planetary object, E is the Young’s modulus of the material, I is the moment of inertia, K is the column effective length factor (a constant based on the end condition of the boom, which is free), L is the length of the boom, and r is the radius of the boom. | |||
A sensitivity analysis of two relevant FOM equations, compressive load and coverage range, will reveal which variables have the greatest impact on our total utility function. To start that analysis, we consider the tradespace for space booms. The various choices available given our use case are listed in the following morphological matrix. | |||
[[File:SpaceBoom MorphMatrix.png|700px]] | |||
Now the two FOMs can be analyzed independently to determine which variables impact them the most. The formula for critical compressive load is: | |||
[[File:SpaceBooms TechModel Eq3.png|200px]] | |||
Where E is the Young’s modulus of the material, I is the moment of inertia, K is the column effective length factor (a constant based on the end condition of the boom, which is free), L is the length of the boom, and r is the radius of the boom. In this formula, I was replaced with the moment of inertia for a circle (roughly representative of the boom geometry): | |||
[[File:SpaceBooms TechModel Eq4.png|100px]] | |||
For operations on the Moon, this equation would still apply. One consideration to keep in mind is lunar gravity, which is ~⅙ Earth gravity. This would affect the maximum mass that can be supported by the boom. | |||
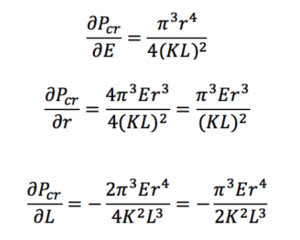
Calculating the partial derivatives of the critical compressive load with respect to variables E, r and L (K is a constant, so no partial derivative is calculated for it): | |||
[[File:SpaceBooms Model Eq5.png|300px]] | |||
The design vector of the existing NASA GCD boom is shown in Table 6. | |||
[[File:SpaceBoom DesignVector.png|600px]] | |||
Plugging in these values into the partial derivatives: | |||
[[File:PartialDerivitives.jpg|500px|]] | |||
Normalizing: | |||
[[File:Compression normalized.jpg|500px|]] | |||
The normalized values are plotted in Figure 4 to show how a 1% change in the variables (which are underlying technologies to the boom) impacts the product performance. This analysis shows that the maximum compressive load is most sensitive to changes in the radius of the boom. Small increases in the radius of our design have a relatively large impact, so investment in optimizing the cross-sectional geometry is wise: | |||
[[File:Compression Tornado.jpg|600px|]] | |||
For the tower use case, conducting a sensitivity analysis of the coverage range is also useful. Coverage range is calculated using the following equation: | |||
[[File:Range Equation.jpg|150px|]] | |||
Where d is coverage range, h is the height of the boom, and R_P is the radius of the planetary object that the boom is on. This case will study the use of a space boom as a lunar tower, so the equation will use the radius of the Moon. | |||
Calculating the partial derivatives of the range equation with respect to variables h and R_P: | |||
[[File:Range derivative.jpg|150px|]] | |||
Plugging in the values from Table 6 into the partial derivative equations: | |||
[[File:Range derivative with values.jpg|300px|]] | |||
Normalizing: | |||
[[File:Range normalized.jpg|350px|]] | |||
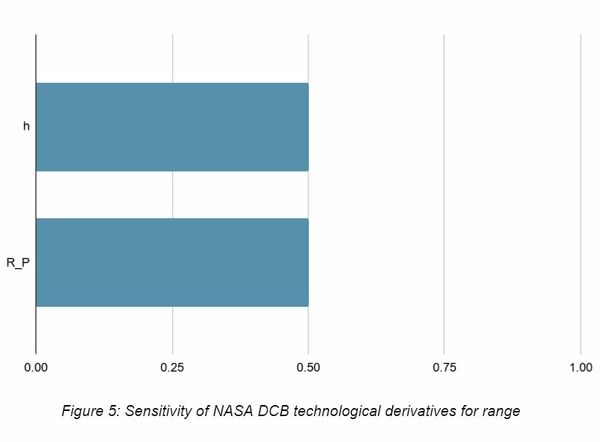
The normalized values are plotted in Figure 5 to show how a 1% change in the variables (which are underlying technologies to the boom) impacts the product performance. This indicates that planet size and height of tower have roughly equal importance in the range equation. While we cannot change the radius of a planet, we can select which planet the boom is used on. | |||
[[File:Range Tornado.jpg|600px|]] | |||
==Potential Research and Development Projects== | |||
WickEhn Clam Browder’s R&D division has incorporated the work done from the technology roadmapping process thus far to craft a list of R&D projects to pursue, as well as how to leverage those R&D investments into two new product offerings. | |||
The overarching goals of our R&D projects are based on three key FOMs: (1) increasing the length to mass ratio, (2) increasing stability, and (3) decreasing price. These elements are essential inside of our technical and financial model, are measurable, and we will be able to compare the results of R&D projects to the current market offerings. Once we can achieve the desired results, we expect to have a market advantage for bidding on contracts for NASA, the United States Space Force, and potentially international space agencies (i.e. JAXA). | |||
[[File:SpaceBooms Model Eq1.png|300px]] | |||
Recalling our utility function (see section on Technical Model) where L = Length of the boom (context dependent minimum length required) [m], S = force [N], and M = mass of the boom [kg], materials investments that improve buckling, torsional, and angular stress properties can be compared and contrasted in order to make sound investments. Additionally, we can invest in materials and structures that maintain those force properties and reduce weight. Finally, creative geometry and transformational characteristics of booms would also be sound investments. For each of these we will look at the change in FOM, the duration it takes to achieve that change, and associated costs based on our financial model. | |||
From our financial model, we can compare net present value, cash flow, and total R&D expenses. Given the technical and financial goals for Clam Browder Inc, R&D investments have been identified: | |||
*Improve space boom capabilities toward the span to mass Pareto front | |||
*Improve space boom capabilities strategically against the market | |||
*Achieve positive cash flow as early as possible | |||
*Achieve either positive Net Present Value or increased market dominance through our R&D portfolio''' | |||
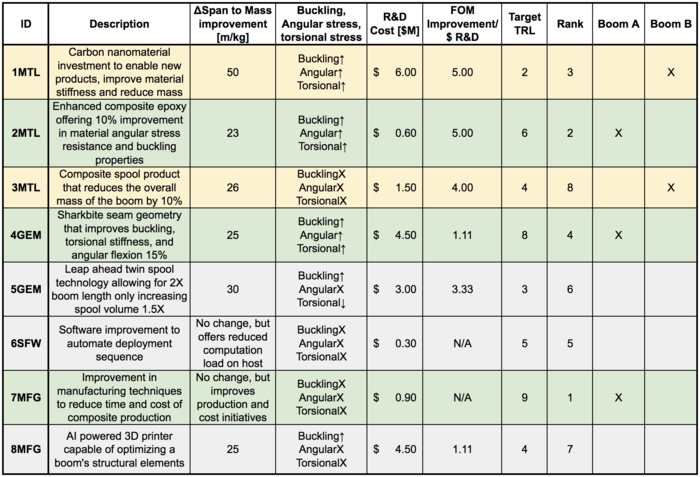
The WickEhn Clam Browder R&D department took these goals and defined a series of possible R&D projects, outlined in the table below. The project IDs designate the type of project: | |||
*MTL = materials | |||
*GEM = geometry | |||
*SFW = software | |||
*MFG = manufacturing | |||
[[File:R&D Projects Table 3.png|700px]] | |||
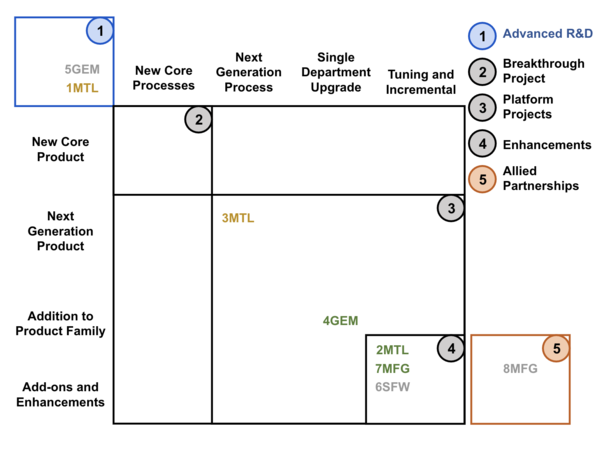
These projects focus on improving the FOM span to mass ratio, which has a baseline of 20 m/kg. The NPV estimate is based on the development time needed for each investment. The rank was determined using a combination of target TRL, FOM improvement per R&D cost, and total NPV. Rank will be used to prioritize the projects. These R&D projects are not included in the previously discussed financial model, which focused on development of lunar towers for NASA. Boom A is a near term target and the green color indicated R&D projects that have been chosen to feed that boom development. Boom B is a longer term goal, so the yellow color has been applied to technologies that link to its development. Space Boom B should also benefit the technology improvements applied to Space Boom A. Grey technologies are not going to be pursued given our R&D budget at this time. These projects can be mapped to the type of technology breakthrough we expect to get from them: | |||
[[File:SpaceBooms RDTaxonomy.png|600px]] | |||
Today we have a product ready for market that achieves 20m/kg, at a very competitive price point compared to existing NASA solutions and shorter but lighter competitor booms. We have identified several R&D projects that fit our portfolio dynamics and complement each other when building out future projects. Leveraging these eight R&D projects, WickEhn Clam Browder will develop two new product offerings: SharkByte and BoomWerx. | |||
===SharkByte [Boom A]=== | |||
Using our existing spool boom and three R&D projects (2MTL, 4GEM, and 7MFG), we can enhance composite material properties and our manufacturing efficiency. 2MTL and 7MFG are both enhancement projects, but what really separates this product from our baseline is 4GEM, the addition of a sharkbite seam. This new product is the brainchild of WickEhn Clam Browder's Chief Creative Officer, Eric Ehn, and will require us to re-engineer portions of the spool and develop new composite molds. The R&D costs for this project are $6M. This approach both connects our offerings to the technical model’s defined Pareto Frontier and outpaces similar products on the market in overall span and stress resistance. These technologies can also be carried through to other future offerings. | |||
===BoomWerx [Boom B]=== | |||
We will use 1MTL and 3MTL in conjunction with earlier maturing R&D projects to make a substantial improvement on spoolable boom technologies. Leveraging improvements in carbon nanostructures (1MTL), our spoolable boom concept can improve in all stress areas and achieve a significant reduction in weight while maintaining our industry-leading span distance. Further reducing the weight, project 3MTL is working to re-engineer the spool out of composite materials rather than metal. This is a next-generation manufacturing process that will achieve a dynamic shape. The expected cost for R&D is $7.5M, which will result in a position as the first carbon nanostructure boom available on the market. | |||
At the end of the day, the emphasis for our products is to enable exploration and provide services in all sectors of the space industry. This focused R&D approach maximizes space boom utility, financial return, and market advantages. | |||
==Financial Model== | |||
A net present value analysis was conducted for space booms based on a company vision of developing a lunar tower infrastructure network while also supplying space booms for low Earth orbit. This financial model incorporates the following assumptions: | |||
*Developing a lunar tower using a space boom as part of the Artemis Program; will establish a tower network on the surface of the Moon. NASA would match company R&D investment. We’d sell 2 lunar booms to NASA per year while also selling LEO booms, moving from 0 to 8 booms sold per year over a 20-year period | |||
*Discount rate of 10%, which was deemed appropriate for a medium-risk technology like space booms | |||
*Company R&D investment incorporates projects two develop two new boom products, SharkByte and BoomWerx. SharkByte is a short-term project, with R&D investment spread over six years. BoomWerx is a longer-term project, with R&D investment spread over 10 years. The two projects briefly overlap. | |||
*Using the MIT MELLTT project’s 2m and 6m booms as a baseline price point, the estimated sale price of a 16m lunar space boom is $2M and the estimated sale price of LEO space booms is $100k (in reality, LEO space booms would vary in cost depending on the requirements for each mission) | |||
*Assumed 100% markup from production cost to sales price | |||
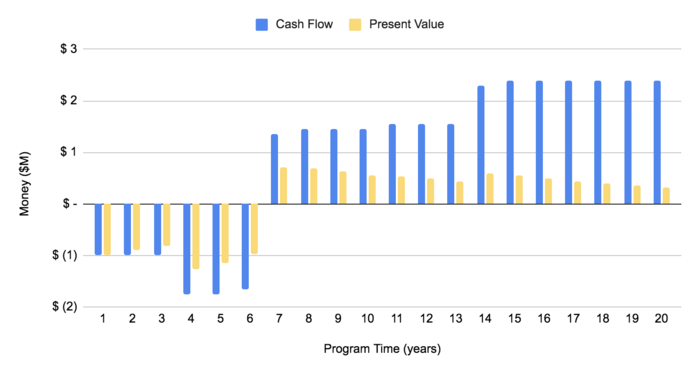
Incorporating these assumptions results in the financial model shown in the figures below. This model results in a payback period of 11 years, meaning that the company breaks even on its investment after 11 years. The return on investment (using the non-discounted value of money) is 0.256, whereas the discounted return on investment (incorporating the discount rate) is -0.969. Despite a low return, the company may still choose to work on this project because it would result in state of the art technology and a strong relationship with NASA, as well as prestige and global attention from participating in the Artemis Program. | |||
[[File:Boom NPV 2.png|700px]] | |||
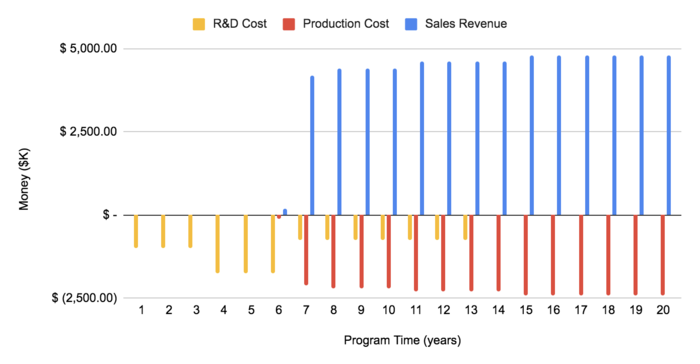
The figure above shows how the net cash flow and the net present value of the space boom program change over the course of a 20-year period. The line items included in cash flow are R&D cost, production cost and sales revenue, which are broken out in the next figure. | |||
[[File:Boom Cash Flow 2.png|700px]] | |||
==Key Publications and Patents== | |||
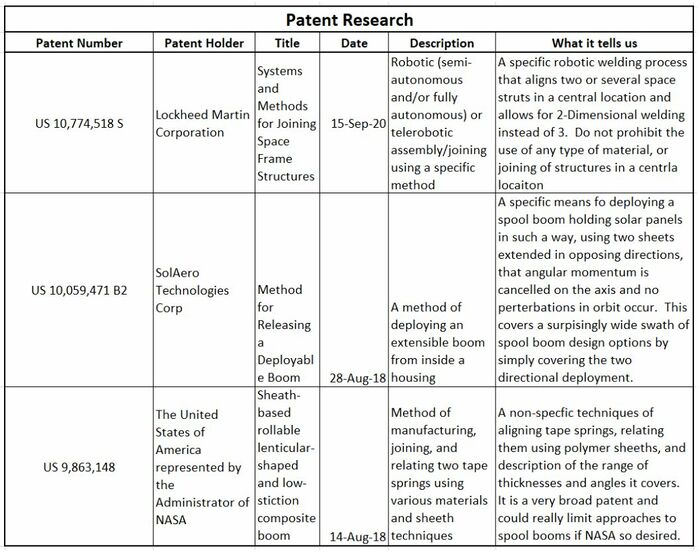
An investigation into patents for space boom technology reveals a lot of patents pertinent to any future boom work. The major theme that stands out is that types of booms are not limited, but methods for releasing or applying the technologies are what companies aim to protect. So if a development requires a boom the team is likely free to use the one that fits their needs best, but will need to check intellectual property and patents before implementing to be sure the method of use isn’t protected. Three key patents relevant to space booms are summarized below: | |||
[[File:Patent Table.jpg|700px]] | |||
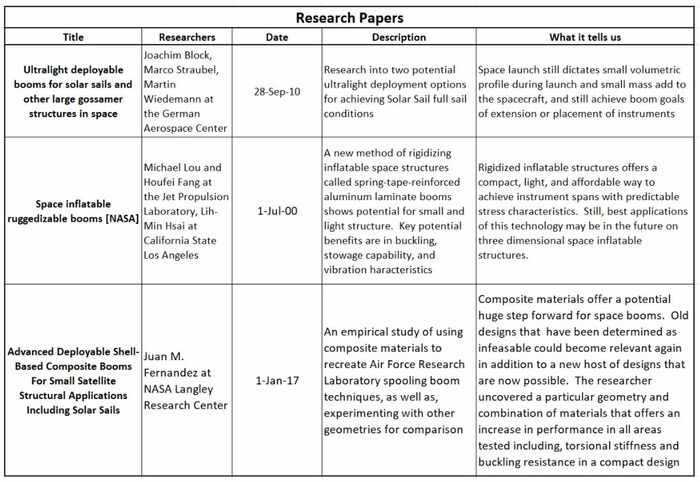
In addition to patents, another area with valuable information about space boom technology is publications from research centers. Many researchers are working to improve the performance of space booms by reducing cost, mass, volume, deflection, buckling resistance, and torsional stiffness while increasing the distances these booms can safely span. It appears in the last 20 years that there has been significant progress away from Earth-crafted circular metal structures toward the utilization of tape spring shapes, space-based assembly, and composite materials. The cutting-edge technologies displayed in this research are swiftly improving spool booms, space applications in additive manufacturing, and autonomy to support robotic fabrication. In the coming years, there will likely be some impressive and dynamic applications to study. Three key research papers on this topic are summarized in the table below: | |||
[[File:Research Table.jpg|700px]] | |||
==Technology Strategy Statement== | |||
[[File:SpaceBooms Swoosh Chart.png|800px]] | |||
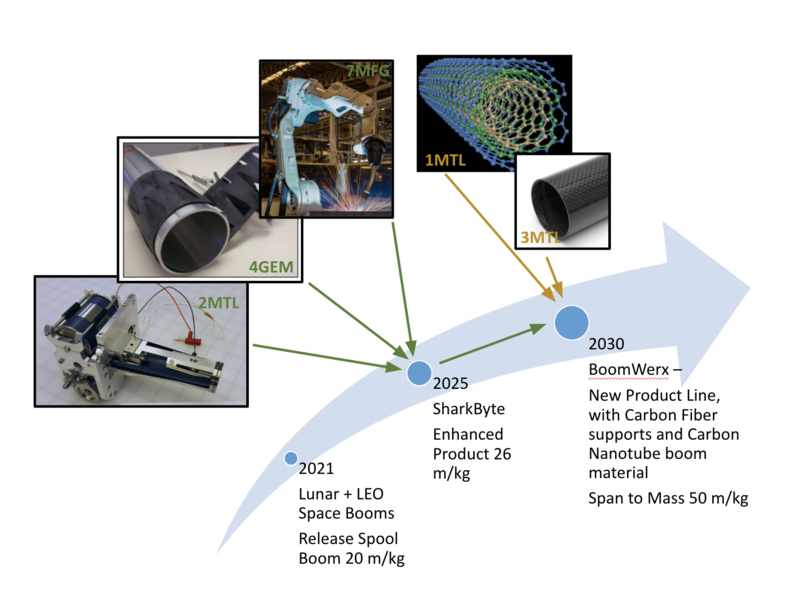
Over the next ten years, WickEhn Clam Chowder will focus on four product offerings: 1) standard lunar booms, 2) standard LEO booms, 3) an enhanced boom called SharkByte, and 4) BoomWerx, which leverages material advances. Based on our financial model and R&D portfolio laid out above, this timeline will allow us to achieve strategic goals while working with a reasonable timeline and scope of work. | |||
==References== | |||
1. Canadarm. (n.d.). Retrieved October 01, 2020, from https://cc-space.weebly.com/canadarm.html | |||
2. Spacecraft Components. (n.d.). Retrieved October 01, 2020, from https://www.northropgrumman.com/space-old/spacecraft-components/ | |||
3. Shaker, J. F., & Acquaviva, T. H. (1995). Static stability of the Space Station solar array FASTMast structure. Retrieved from https://ntrs.nasa.gov/citations/19960000328 | |||
4. NASA Jet Propulsion Laboratory. (n.d.). Shuttle Radar Topography Mission MAST Instrument. Retrieved September 30, 2020, from NASA Jet Propulsion Laboratory website: https://www2.jpl.nasa.gov/srtm/mast.html | |||
5. NASA. (n.d.). Deployable Composite Booms (DCB) | Space Technology: Game Changing Development. Retrieved September 30, 2020, from NASA website: https://gameon.nasa.gov/projects/deployable-composite-booms-dcb/ | |||
6. Roccor. (n.d.). Boom Products. Retrieved September 30, 2020, from Roccor website: https://www.roccor.com/boom_products/ | |||
7. Composite Technology Development, I. (n.d.). Composite Booms and Boom Deployers. Retrieved September 30, 2020, from Composite Technology Development, Inc. website: https://www.ctd-materials.com/home/composite-booms-and-boom-deployers/?doing_wp_cron=1601518689.0840399265289306640625 | |||
8. Euler's critical load. (2020, November 28). Retrieved November 30, 2020, from https://en.wikipedia.org/wiki/Euler's_critical_load | |||
9. More, H.N. (2019, November 16). Antenna: Its coverage area formula, calculation of coverage area. Retrieved November 30, 2020, from https://thefactfactor.com/facts/pure_science/physics/antenna/5117/ | |||
10. West, R. (2018, February 07). Carbon Fiber Grades: It's all About Tensile Modulus. Retrieved November 30, 2020, from https://www.rockwestcomposites.com/blog/carbon-fiber-grades-its-all-about-tensile-modulus/ | |||
11. K. Wilkie et al., “An Overview of NASA’s Advanced Composite Solar Sail System (ACS3) Low-Earth Orbit Technology Demonstration Project,” in Fifth International Symposium on Solar Sailing, 2019, pp. 1–26. | |||
12. Moon Fact Sheet. (n.d.). Retrieved November 30, 2020, from https://nssdc.gsfc.nasa.gov/planetary/factsheet/moonfact.html | |||
13. CTD Materials (2020) Website. https://www.ctd-materials.com/ | |||
14. Roccor (2020, October 29). Roccor. Retrieved November 30, 2020, from https://www.roccor.com/ | |||
15. AstroMast Booms. (2020, September 23). Retrieved November 30, 2020, from https://www.northropgrumman.com/space/astro-aerospace-products-astromast-booms/ | |||
16. Carbon fiber reinforced polymer. (2020, November 10). Retrieved November 30, 2020, from https://en.wikipedia.org/wiki/Carbon_fiber_reinforced_polymer | |||
17. Beryllium (n.d.). Retrieved November 30, 2020, from https://www.bing.com/search?q=specific+density+beryllium | |||
18. Youngs Modulus is a Measure of Stiffness. (n.d.). Retrieved November 30, 2020, from https://www.christinedemerchant.com/youngmodulus.html | |||
19. Strategic Metals Prices January 2020 Institute for Rare Earths and Strategic Metals eV. (n.d.). Retrieved November 30, 2020, from https://en.institut-seltene-erden.de/prices-for-strategic-metals-in-february-2020/ | |||
20. Nguyen, Dinh; Abdullah, Mohammad Sayem Bin; Khawarizmi, Ryan; Kim, Dave; Kwon, Patrick (2020). "The effect of fiber orientation on tool wear in edge-trimming of carbon fiber reinforced plastics (CFRP) laminates". Wear. Elsevier B.V. 450–451: 203213. | |||
21. Hall, L. (2015, April 29). 2015 NASA Technology Roadmaps (Archive). Retrieved November 30, 2020, from https://www.nasa.gov/offices/oct/home/roadmaps/index.html | |||
22. NASA (2020) Wikipedia. https://en.wikipedia.org/wiki/Space_Shuttle_design_process | |||
23. Report to the President by the Presidential Commission on the Space Shuttle Challenger Accident aka Rogers Commission Report (1986), https://spaceflight.nasa.gov/outreach/SignificantIncidents/assets/rogers_commission_report.pdf | |||
24. Berberich, M. (2018). Ball Aerospace. Leveraging the GPM Microwave Imager (GMI) Calibration Standard For Next Generation Defense Weather Missions. https://digitalcommons.usu.edu/cgi/viewcontent.cgi?article=1299&context=calcon | |||
25. Young's modulus. (2020, November 10). Retrieved November 30, 2020, from https://en.wikipedia.org/wiki/Young's_modulus# | |||
[[ | [[Satellite_Data_Communication]] | ||
Latest revision as of 03:15, 3 February 2024
Technology Roadmap Sections and Deliverables
This technology's unique identifier is:
- 3SB - Space Boom
This indicates that we are dealing with a “level 3” roadmap at the subsystem level, where “level 1” would indicate a market level roadmap, "level 2" would be at the product level, and “level 4” would be at the component level.
Roadmap Overview
This roadmap is a level 3 (subsystem) assessment of space booms. As illustrate in the technology hierarchy tree below, space booms are structures used to position space instruments in relationship to the primary mission vehicle. The vehicles are the level 2 (system) for this roadmap and the hardware and software elements (and other components) of the booms are level 4 (components). Space booms could fall into many L1 ecosystems, but the focus here will be on using space booms as enabling infrastructure for space exploration. Booms may not seem like glamorous pieces of technology, but they have a glamorous history of enabling space instrumentation by providing the right geometry, relationships, support and protection. On the International Space Station alone, Northrup Grumman's FAST Mast allows the station's solar panels to be extended and retracted as needed, while Canadarm 2 captures incoming resupply vehicles and conducts critical robotic repair on the exterior of the station. Some booms are as simple as a single metal rod, but others are transforming apparatuses that launch in compact forms, while still supporting instruments over great distances once deployed. For this research, primary vehicle and instrument are relative terms; it may be a satellite is the primary vehicle with space boom attached, but the satellite can also be an instrument relative to a larger primary mission vehicle.
There are several types of booms that have appeared in our research, each with varying degrees of complexity. Static Booms are not depicted in the graphical representation as they are simply straight support with no moving parts.
There may be other specific types of booms, but these are space industry standards and encompass the vast majority of space booms used since the 1960's. It is important to understand that these boom categories are large and encompass quite a diversity of booms. For example, robotic arms are encased in the articulating booms category despite the fact that they are bundled with relatively rudimentary articulating supports. Generally, space booms rely on innovation and technological advances to fit within small spaces, but allow instruments to conduct tests well away from the primary mission vehicle. This leads to a value function for booms: to take up as little space, to use as little mass, and to maintain affordability, allowing the maximization of spacecraft features and instruments.
The research into booms is ongoing, but there is already a celebrity list of booms that are both interesting and demonstrate great engineering. CanadaArms 1 and 2, the Magnetometer Boom that crashed with Cassini into Saturn, and the Able Engineering ADAM Mast that supported the Space Shuttle Topography Mapping in 2000 all supported unique missions and enabled human utilization of space. From our growing list of research subjects, a reasonably complete list of boom parts is available; enabling a consistent decomposition across the various types. The decomposition is listed in the OPM and allows for Level 4 (component) analysis to be accomplished.
Space booms are not the lead actors for the space movie. However, they are critical infrastructure and enable significant improvements in capability. Making gains in the space boom technology arena means taking advantage of component technology and advanced material sciences to reduce cost, mass, and launch volume compared to the desired span. Doing so increases overall mission effectiveness and user benefit.
Design Structure Matrix (DSM) Allocation
This DSM shows that space booms are part of the larger space vehicle system, where a space vehicle could be a satellite, a rover, or another type of payload. As a L3 technology, space booms rely on other L3 technologies like propulsion and enable other L3 technologies like payloads. Space booms rely on enabling L4 technology such as carbon composites and controls.
Roadmap Model using OPM
The Object Process Diagram (OPD) captures figures of merit, several examples of space booms, and the main processes and components involved in building and operating a space boom. An Object Process Language (OPL) description of the roadmap scope is auto-generated and shown on the right. This natural language and graphical depiction does an excellent job of communicating the primary processes that space booms perform and support. Additionally, it conveys the key components, key players, and core figures of merit for the domain.
Figures of Merit
The table above summarizes several figures of merit (FOM) to measure space boom technology. The FOM in bold, span-to-mass ratio, offers a unique perspective about the efficiency with which a space boom performs and is the main FOM used in this roadmap. Optimizing this FOM means making it as large as possible, so that a customer can have the span they need while minimizing the mass they must use to get it.
This figure shows the development of the span-to-mass ratio over time. There have been steady improvements since the 1980's and very rapid improvement in the last few years with NASA R&D simultaneously identifying a few geometric and material improvements.
Alignment of Strategic Drivers
Based on the displayed FOMs, our team can define our strategies, set targets for success, and then use our roadmap to determine if they are feasible now or require patience before execution. The below chart depicts the strategies we considered, the targets associated based on roadmap FOMs, and whether or not they are currently viable:
Strategic driver number one is an idea to build the longest mast ever deployed in space, that will fit on market available launch options. 50m plus booms died with the ABLE Engineering Mast that flew on the Space Shuttle, eliminating extremely sensitive sensors as a payload and requiring whole new missions. Filling that gap will require advancements in volume and mass properties. Unfortunately, Carbon Nanotube weight reduction is not offset in this use context by the considerable cost increase. However, Strategic Driver number 2 aims to undercut the current weight standards for much shorter booms. We believe it is accomplishable using Carbon Nanotube Structures, which will take some investment but can still be competitive from a cost position given that it is a relatively small boom application. Finally, Strategic Driver number 3 is targeting a boom that can support planetary instruments support ahead of the Artemis and other lunar or Martian missions. It is atypical for space technology companies to consider planetary missions, but these missions offer an opportunity if our spooling boom technology can be adapted.
Positioning: Company Versus Competition
The first step to defining a winning strategy for space boom technology development is to understand the current landscape of companies and government agencies. To do this requires a reference point to base industry assumptions against. Our reference point is the Global Precipitation MEasurement Microwave Imager Dish. It uses an articulating boom, to cover a relatively short span, has a complex deployment process, does not deliver electricity to the dish, and has high stability (stiffness) requirements. It is approximately an average boom, given that mission requirements are typically unique. Here is a graphic of the boom in action:
From this reference point, we can plot the industry and competitive landscape for space booms. The following chart highlights the various strategies employed by a couple of distinct groups:
As the chart displays, the landscape for space booms is highly dependent on whether or not there is government funding associated with space missions. Government funding tends to be focused on novel space exploration that requires unique boom solutions. This drives NASA, the United States Space Force, and supporting research laboratories to accept the additional cost to the producer to gain the added value to customers. These groups are pushing the envelope of material sciences, uncovering optimal geometry, and innovating mechanisms to create compact and light launch profiles. Our team conducted a review of NASA’s Carbon Nanotube Materials for Space Structures and they clearly are targeting it as a lighter and stronger next step. The chart below demonstrates where it currently stands in comparison to existing space materials in terms of cost, density, and stiffness:
The previous chart demonstrates that Carbon Nanotube Structure Technology will both make space structures lighter and better at supporting instruments, but currently only does so at a significant increase in cost.
On the commercial side, there are two strategies. One is to try and commercialize, or make profitable, the previously stated novel solutions after they have been successfully demonstrated. Two small space company examples are listed who are working to refine, design for manufacturability, and proliferate a NASA spool boom technology: Roccor and Composite Technology Development (CTD), Inc. The second strategy, favored by large space companies, is to rely on mature, albeit dated technologies. For example, Northrop Grumman has re-used virtually the same coilable boom design, AstroMast, on more than a dozen missions dating back to the 1970’s. Value to the customer is based on an assessment of FOM that particular booms can achieve.
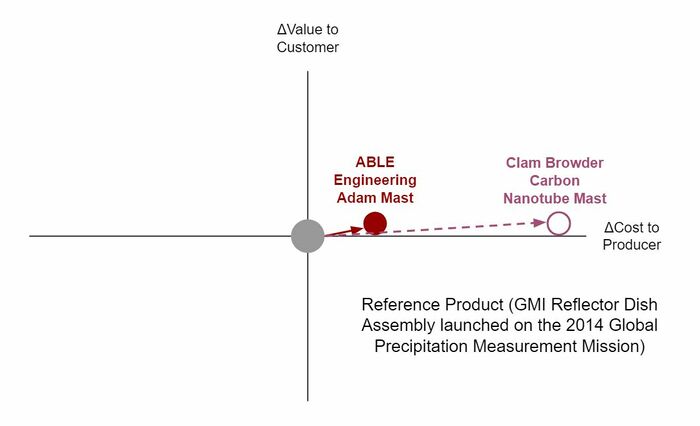
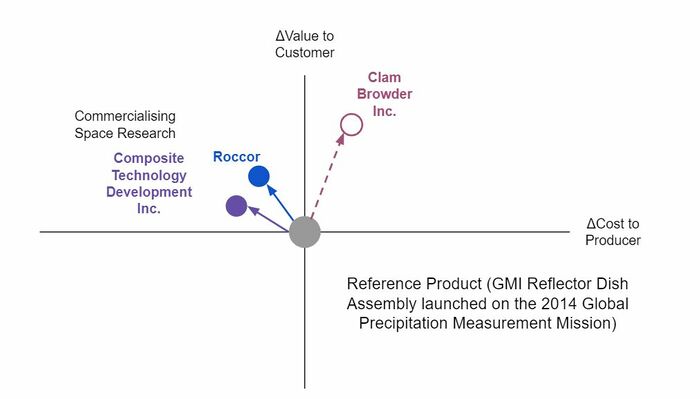
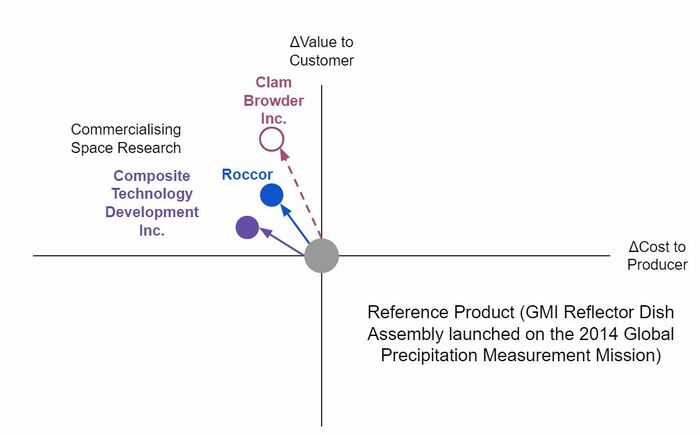
Returning to our strategic drivers the positional comparisons look like this:
- Strategic Driver 1
- Strategic Driver 2
- Strategic Driver 3
Technical Model
In order to understand the feasibility of strategic targets for space booms, a technical model is required. The first step to building a technical model for space booms is to consider what is “good” for space booms and the environment they operate in. Good in this case is defined as performing their task over the duration of the mission for an affordable cost while adhering to mass and volumetric constraints imposed by the launch vehicle. While cost and durability are relatively easy to understand, the combination of performing its designated mission and fitting inside the rocket fairing poses a challenge for booms. We defined the role of space booms as supporting an instrument in relation to a main body, which brings with it a couple of requirements based on the use context.
The three types of force that space booms may endure while supporting an instrument are compressive loading, torsional forces and angular forces. These often depend on the use case for the system whether it be orbital, lunar, or planetary. The three unique forces could be simultaneously applied, but the assumption for this analysis is that they are mutually exclusive. This creates the requirement to resist forces that may injure the spacecraft or the instrument. Another requirement imposed on space booms is that of length or span as we are defining it for this analysis. Many instruments require a minimum amount of distance from the body given field of view requirements, coverage over a celestial body, or potential for instrument noise. This again depends on the instrument and the use case.
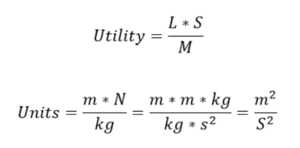
Finally, we must consider the constraints of space systems. Anything we launch into space is constrained in terms of mass by the launch vehicle and volumetrically by the launch fairing. Further constraints can be imposed from the space vehicle itself in terms of mass, volume, and cost budgets. Efficiency is therefore ideal. Gathering these pieces, we begin to develop an idea of utility for a space boom: efficiently achieving the desired span and support requirements. Our analysis assembled a model using these:
Where L = length of the boom (context dependent minimum length required) [m], S = force (context dependent minimum force required) [N], and M = mass of the boom [kg]. For length and force, the technology designer must make a few choices about goals:
- What is the requirement for selecting a length? There are three potential situations:
- Minimum length needed to clear the field of view (FOV)
- Length needed to achieve a sufficient coverage range on a celestial body
- Minimum length needed to prevent interference with instruments that may cause noise
- What are the forces acting on the boom? There are three potential forces that are not mutually exclusive:
- Compressive force
- Torsional force
- Angular force
The next step in analysis is considering a simplified use case. For this analysis, we focus on boom designed for use on the Moon, where the boom will vertically support an instrument. In this scenario, we want to achieve sufficient coverage of the lunar surface. This makes defining equations and conducting a sensitivity analysis simpler because the forces expected (compressive loading) and the length requirement (based on range coverage of the Moon) form the utility function, with mass working to keep them efficient. In this case, critical load refers to the maximum load the space boom can carry when it is used as a tower, which is calculated with Euler’s critical load formula. Coverage range refers to the distance a payload on top of the space boom can see on a planetary surface, which is calculated using Pythagorean theorem. Plugging in the formulas for Euler's critical load and Pythagorean theorem into the utility equation:
In this composite equation d is coverage range, R_P is the radius of the planetary object, E is the Young’s modulus of the material, I is the moment of inertia, K is the column effective length factor (a constant based on the end condition of the boom, which is free), L is the length of the boom, and r is the radius of the boom.
A sensitivity analysis of two relevant FOM equations, compressive load and coverage range, will reveal which variables have the greatest impact on our total utility function. To start that analysis, we consider the tradespace for space booms. The various choices available given our use case are listed in the following morphological matrix.
Now the two FOMs can be analyzed independently to determine which variables impact them the most. The formula for critical compressive load is:
Where E is the Young’s modulus of the material, I is the moment of inertia, K is the column effective length factor (a constant based on the end condition of the boom, which is free), L is the length of the boom, and r is the radius of the boom. In this formula, I was replaced with the moment of inertia for a circle (roughly representative of the boom geometry):
For operations on the Moon, this equation would still apply. One consideration to keep in mind is lunar gravity, which is ~⅙ Earth gravity. This would affect the maximum mass that can be supported by the boom.
Calculating the partial derivatives of the critical compressive load with respect to variables E, r and L (K is a constant, so no partial derivative is calculated for it):
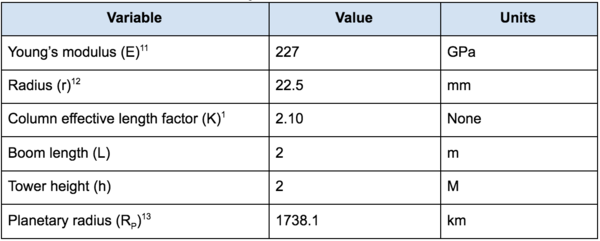
The design vector of the existing NASA GCD boom is shown in Table 6.
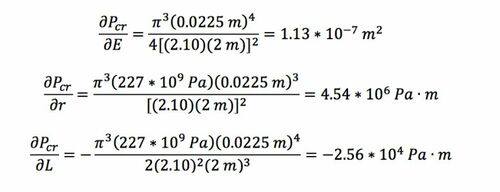
Plugging in these values into the partial derivatives:
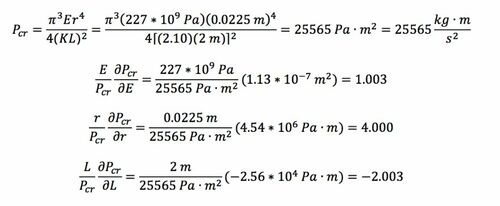
Normalizing:
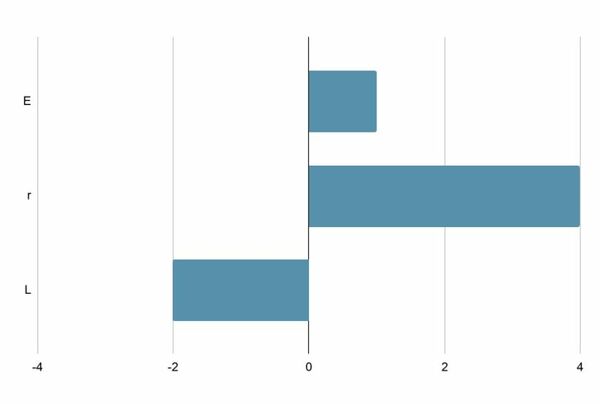
The normalized values are plotted in Figure 4 to show how a 1% change in the variables (which are underlying technologies to the boom) impacts the product performance. This analysis shows that the maximum compressive load is most sensitive to changes in the radius of the boom. Small increases in the radius of our design have a relatively large impact, so investment in optimizing the cross-sectional geometry is wise:
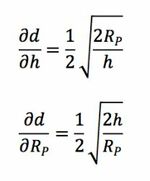
For the tower use case, conducting a sensitivity analysis of the coverage range is also useful. Coverage range is calculated using the following equation:
Where d is coverage range, h is the height of the boom, and R_P is the radius of the planetary object that the boom is on. This case will study the use of a space boom as a lunar tower, so the equation will use the radius of the Moon.
Calculating the partial derivatives of the range equation with respect to variables h and R_P:
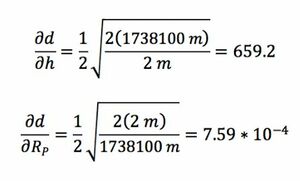
Plugging in the values from Table 6 into the partial derivative equations:
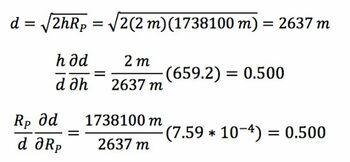
Normalizing:
The normalized values are plotted in Figure 5 to show how a 1% change in the variables (which are underlying technologies to the boom) impacts the product performance. This indicates that planet size and height of tower have roughly equal importance in the range equation. While we cannot change the radius of a planet, we can select which planet the boom is used on.
Potential Research and Development Projects
WickEhn Clam Browder’s R&D division has incorporated the work done from the technology roadmapping process thus far to craft a list of R&D projects to pursue, as well as how to leverage those R&D investments into two new product offerings.
The overarching goals of our R&D projects are based on three key FOMs: (1) increasing the length to mass ratio, (2) increasing stability, and (3) decreasing price. These elements are essential inside of our technical and financial model, are measurable, and we will be able to compare the results of R&D projects to the current market offerings. Once we can achieve the desired results, we expect to have a market advantage for bidding on contracts for NASA, the United States Space Force, and potentially international space agencies (i.e. JAXA).
Recalling our utility function (see section on Technical Model) where L = Length of the boom (context dependent minimum length required) [m], S = force [N], and M = mass of the boom [kg], materials investments that improve buckling, torsional, and angular stress properties can be compared and contrasted in order to make sound investments. Additionally, we can invest in materials and structures that maintain those force properties and reduce weight. Finally, creative geometry and transformational characteristics of booms would also be sound investments. For each of these we will look at the change in FOM, the duration it takes to achieve that change, and associated costs based on our financial model. From our financial model, we can compare net present value, cash flow, and total R&D expenses. Given the technical and financial goals for Clam Browder Inc, R&D investments have been identified:
- Improve space boom capabilities toward the span to mass Pareto front
- Improve space boom capabilities strategically against the market
- Achieve positive cash flow as early as possible
- Achieve either positive Net Present Value or increased market dominance through our R&D portfolio
The WickEhn Clam Browder R&D department took these goals and defined a series of possible R&D projects, outlined in the table below. The project IDs designate the type of project:
- MTL = materials
- GEM = geometry
- SFW = software
- MFG = manufacturing
These projects focus on improving the FOM span to mass ratio, which has a baseline of 20 m/kg. The NPV estimate is based on the development time needed for each investment. The rank was determined using a combination of target TRL, FOM improvement per R&D cost, and total NPV. Rank will be used to prioritize the projects. These R&D projects are not included in the previously discussed financial model, which focused on development of lunar towers for NASA. Boom A is a near term target and the green color indicated R&D projects that have been chosen to feed that boom development. Boom B is a longer term goal, so the yellow color has been applied to technologies that link to its development. Space Boom B should also benefit the technology improvements applied to Space Boom A. Grey technologies are not going to be pursued given our R&D budget at this time. These projects can be mapped to the type of technology breakthrough we expect to get from them:
Today we have a product ready for market that achieves 20m/kg, at a very competitive price point compared to existing NASA solutions and shorter but lighter competitor booms. We have identified several R&D projects that fit our portfolio dynamics and complement each other when building out future projects. Leveraging these eight R&D projects, WickEhn Clam Browder will develop two new product offerings: SharkByte and BoomWerx.
SharkByte [Boom A]
Using our existing spool boom and three R&D projects (2MTL, 4GEM, and 7MFG), we can enhance composite material properties and our manufacturing efficiency. 2MTL and 7MFG are both enhancement projects, but what really separates this product from our baseline is 4GEM, the addition of a sharkbite seam. This new product is the brainchild of WickEhn Clam Browder's Chief Creative Officer, Eric Ehn, and will require us to re-engineer portions of the spool and develop new composite molds. The R&D costs for this project are $6M. This approach both connects our offerings to the technical model’s defined Pareto Frontier and outpaces similar products on the market in overall span and stress resistance. These technologies can also be carried through to other future offerings.
BoomWerx [Boom B]
We will use 1MTL and 3MTL in conjunction with earlier maturing R&D projects to make a substantial improvement on spoolable boom technologies. Leveraging improvements in carbon nanostructures (1MTL), our spoolable boom concept can improve in all stress areas and achieve a significant reduction in weight while maintaining our industry-leading span distance. Further reducing the weight, project 3MTL is working to re-engineer the spool out of composite materials rather than metal. This is a next-generation manufacturing process that will achieve a dynamic shape. The expected cost for R&D is $7.5M, which will result in a position as the first carbon nanostructure boom available on the market.
At the end of the day, the emphasis for our products is to enable exploration and provide services in all sectors of the space industry. This focused R&D approach maximizes space boom utility, financial return, and market advantages.
Financial Model
A net present value analysis was conducted for space booms based on a company vision of developing a lunar tower infrastructure network while also supplying space booms for low Earth orbit. This financial model incorporates the following assumptions:
- Developing a lunar tower using a space boom as part of the Artemis Program; will establish a tower network on the surface of the Moon. NASA would match company R&D investment. We’d sell 2 lunar booms to NASA per year while also selling LEO booms, moving from 0 to 8 booms sold per year over a 20-year period
- Discount rate of 10%, which was deemed appropriate for a medium-risk technology like space booms
- Company R&D investment incorporates projects two develop two new boom products, SharkByte and BoomWerx. SharkByte is a short-term project, with R&D investment spread over six years. BoomWerx is a longer-term project, with R&D investment spread over 10 years. The two projects briefly overlap.
- Using the MIT MELLTT project’s 2m and 6m booms as a baseline price point, the estimated sale price of a 16m lunar space boom is $2M and the estimated sale price of LEO space booms is $100k (in reality, LEO space booms would vary in cost depending on the requirements for each mission)
- Assumed 100% markup from production cost to sales price
Incorporating these assumptions results in the financial model shown in the figures below. This model results in a payback period of 11 years, meaning that the company breaks even on its investment after 11 years. The return on investment (using the non-discounted value of money) is 0.256, whereas the discounted return on investment (incorporating the discount rate) is -0.969. Despite a low return, the company may still choose to work on this project because it would result in state of the art technology and a strong relationship with NASA, as well as prestige and global attention from participating in the Artemis Program.
The figure above shows how the net cash flow and the net present value of the space boom program change over the course of a 20-year period. The line items included in cash flow are R&D cost, production cost and sales revenue, which are broken out in the next figure.
Key Publications and Patents
An investigation into patents for space boom technology reveals a lot of patents pertinent to any future boom work. The major theme that stands out is that types of booms are not limited, but methods for releasing or applying the technologies are what companies aim to protect. So if a development requires a boom the team is likely free to use the one that fits their needs best, but will need to check intellectual property and patents before implementing to be sure the method of use isn’t protected. Three key patents relevant to space booms are summarized below:
In addition to patents, another area with valuable information about space boom technology is publications from research centers. Many researchers are working to improve the performance of space booms by reducing cost, mass, volume, deflection, buckling resistance, and torsional stiffness while increasing the distances these booms can safely span. It appears in the last 20 years that there has been significant progress away from Earth-crafted circular metal structures toward the utilization of tape spring shapes, space-based assembly, and composite materials. The cutting-edge technologies displayed in this research are swiftly improving spool booms, space applications in additive manufacturing, and autonomy to support robotic fabrication. In the coming years, there will likely be some impressive and dynamic applications to study. Three key research papers on this topic are summarized in the table below:
Technology Strategy Statement
Over the next ten years, WickEhn Clam Chowder will focus on four product offerings: 1) standard lunar booms, 2) standard LEO booms, 3) an enhanced boom called SharkByte, and 4) BoomWerx, which leverages material advances. Based on our financial model and R&D portfolio laid out above, this timeline will allow us to achieve strategic goals while working with a reasonable timeline and scope of work.
References
1. Canadarm. (n.d.). Retrieved October 01, 2020, from https://cc-space.weebly.com/canadarm.html
2. Spacecraft Components. (n.d.). Retrieved October 01, 2020, from https://www.northropgrumman.com/space-old/spacecraft-components/
3. Shaker, J. F., & Acquaviva, T. H. (1995). Static stability of the Space Station solar array FASTMast structure. Retrieved from https://ntrs.nasa.gov/citations/19960000328
4. NASA Jet Propulsion Laboratory. (n.d.). Shuttle Radar Topography Mission MAST Instrument. Retrieved September 30, 2020, from NASA Jet Propulsion Laboratory website: https://www2.jpl.nasa.gov/srtm/mast.html
5. NASA. (n.d.). Deployable Composite Booms (DCB) | Space Technology: Game Changing Development. Retrieved September 30, 2020, from NASA website: https://gameon.nasa.gov/projects/deployable-composite-booms-dcb/
6. Roccor. (n.d.). Boom Products. Retrieved September 30, 2020, from Roccor website: https://www.roccor.com/boom_products/
7. Composite Technology Development, I. (n.d.). Composite Booms and Boom Deployers. Retrieved September 30, 2020, from Composite Technology Development, Inc. website: https://www.ctd-materials.com/home/composite-booms-and-boom-deployers/?doing_wp_cron=1601518689.0840399265289306640625
8. Euler's critical load. (2020, November 28). Retrieved November 30, 2020, from https://en.wikipedia.org/wiki/Euler's_critical_load
9. More, H.N. (2019, November 16). Antenna: Its coverage area formula, calculation of coverage area. Retrieved November 30, 2020, from https://thefactfactor.com/facts/pure_science/physics/antenna/5117/
10. West, R. (2018, February 07). Carbon Fiber Grades: It's all About Tensile Modulus. Retrieved November 30, 2020, from https://www.rockwestcomposites.com/blog/carbon-fiber-grades-its-all-about-tensile-modulus/
11. K. Wilkie et al., “An Overview of NASA’s Advanced Composite Solar Sail System (ACS3) Low-Earth Orbit Technology Demonstration Project,” in Fifth International Symposium on Solar Sailing, 2019, pp. 1–26.
12. Moon Fact Sheet. (n.d.). Retrieved November 30, 2020, from https://nssdc.gsfc.nasa.gov/planetary/factsheet/moonfact.html
13. CTD Materials (2020) Website. https://www.ctd-materials.com/
14. Roccor (2020, October 29). Roccor. Retrieved November 30, 2020, from https://www.roccor.com/
15. AstroMast Booms. (2020, September 23). Retrieved November 30, 2020, from https://www.northropgrumman.com/space/astro-aerospace-products-astromast-booms/
16. Carbon fiber reinforced polymer. (2020, November 10). Retrieved November 30, 2020, from https://en.wikipedia.org/wiki/Carbon_fiber_reinforced_polymer
17. Beryllium (n.d.). Retrieved November 30, 2020, from https://www.bing.com/search?q=specific+density+beryllium
18. Youngs Modulus is a Measure of Stiffness. (n.d.). Retrieved November 30, 2020, from https://www.christinedemerchant.com/youngmodulus.html
19. Strategic Metals Prices January 2020 Institute for Rare Earths and Strategic Metals eV. (n.d.). Retrieved November 30, 2020, from https://en.institut-seltene-erden.de/prices-for-strategic-metals-in-february-2020/
20. Nguyen, Dinh; Abdullah, Mohammad Sayem Bin; Khawarizmi, Ryan; Kim, Dave; Kwon, Patrick (2020). "The effect of fiber orientation on tool wear in edge-trimming of carbon fiber reinforced plastics (CFRP) laminates". Wear. Elsevier B.V. 450–451: 203213.
21. Hall, L. (2015, April 29). 2015 NASA Technology Roadmaps (Archive). Retrieved November 30, 2020, from https://www.nasa.gov/offices/oct/home/roadmaps/index.html
22. NASA (2020) Wikipedia. https://en.wikipedia.org/wiki/Space_Shuttle_design_process
23. Report to the President by the Presidential Commission on the Space Shuttle Challenger Accident aka Rogers Commission Report (1986), https://spaceflight.nasa.gov/outreach/SignificantIncidents/assets/rogers_commission_report.pdf
24. Berberich, M. (2018). Ball Aerospace. Leveraging the GPM Microwave Imager (GMI) Calibration Standard For Next Generation Defense Weather Missions. https://digitalcommons.usu.edu/cgi/viewcontent.cgi?article=1299&context=calcon
25. Young's modulus. (2020, November 10). Retrieved November 30, 2020, from https://en.wikipedia.org/wiki/Young's_modulus#
