Orbital Launch Vehicles Roadmap
Roadmap Overview
Orbital launch vehicles (LV) are internally propelled vehicles used to carry payloads from Earth’s surface to Earth orbit or beyond. They are powered by rocket engines that generate large amounts of thrust even in vacuum by means of expelling hot gas through a nozzle. The propellants burnt to generate that gas can be liquid or solid (or hybrids) and are stored inside the LV. Most launch vehicles are divided into stages to discard non-used structure and some of them are reusable.
This roadmap will be an L1 roadmap from the point of view of the LVs as a technology that enables the Human race to transport cargo from the surface of the Earth to outer space. ==
DSM Allocation
Roadmap model using OPM
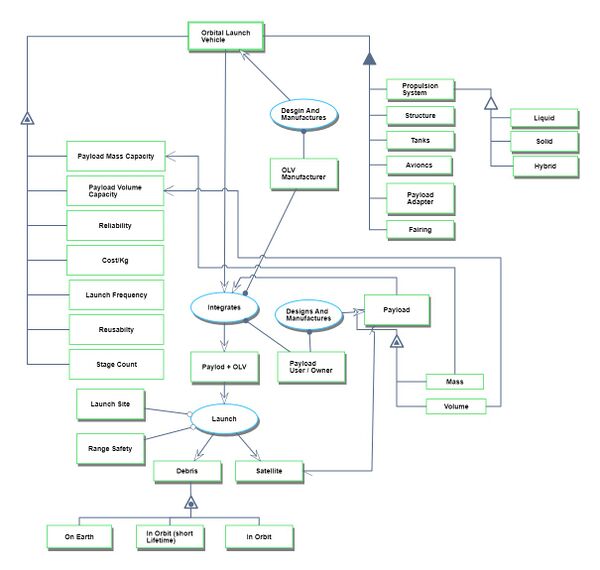
The following Object Process Diagram describes the Orbital Launch Vehicle technology point of view for this roadmap. The main object of the diagram is the different launch vehicles, its decomposition into main components/subsystems like propulsion system, structures, tanks, avionics, payload adapters, and the main attributes. Finally, the processes in the lifecycle are described as the integration of the payloads and the actual launch.
Figures of merit
The table below shows a list of FOMs by which Orbital Launch Vehicles can be assessed.
| Figure of Merit | Units | Description |
|---|---|---|
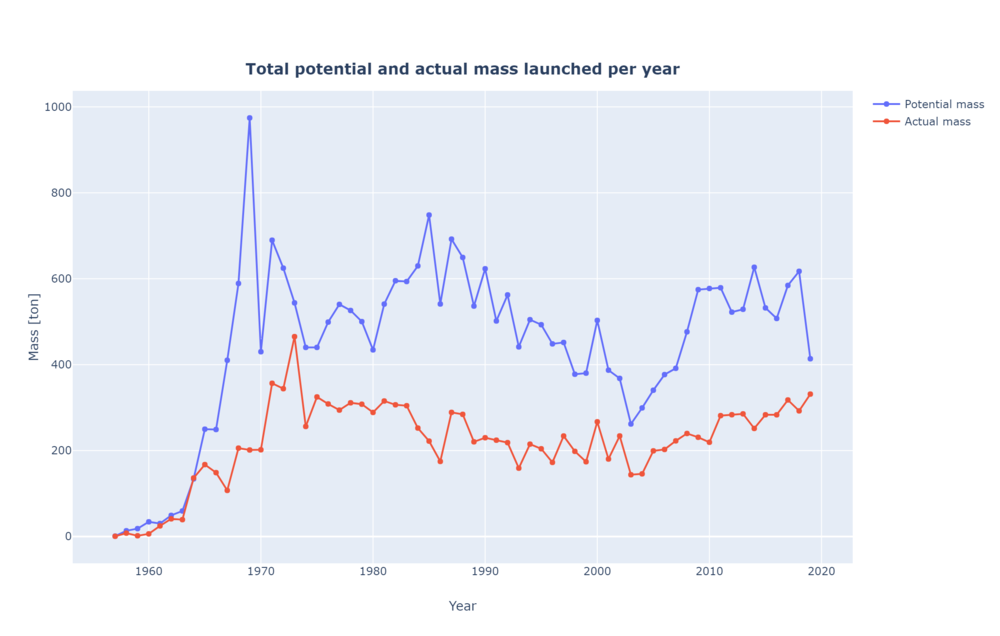
| Payload to LEO | [Kg/Year] | Payload mass that can be put into a 500 Km circular low earth orbit for a specific launch vehicle every year. This takes into account the production rate of the rockets and, if applicable, the reusability. |
| Payload to mass Ratio | [Kg/Kg] | Mass capacity to LEO over total LVs mass (including the payload). |
| Reliability | [non-dimensional] | Successful launches over total launches. |
Cost per Kg as a FOM wasn't considered in this roadmap because of the difficulty of obtaining accurate data.
Physical principles
In order to put a payload in orbit, an OLV needs to accelerate to a certain velocity in a certain direction at a specific altitude from the center of the Earth. This requirement can be derived from Newton’s Universal Gravitational Law and can be approximated for circular orbits as:
Where G is the universal gravitational constant, M the mass of the Earth and r the distance to the center of the planet of the orbit. So for example, a 500km circular orbit around the Earth will require a velocity of approximately 7.61 km/s or 27405 Km/h. A few more km/s are usually needed to account for atmospheric losses and other non-idealities.
In other to achieve that velocity, OLV uses rockets engines that use a combination of fuel and oxidizers (known as propellants) to create a high-pressure gas that is then accelerated by a converging-diverging nozzle to create thrust.
- <math>\Delta v = v_\text{e} \ln \frac{m_0}{m_f} = I_\text{sp} g_0 \ln \frac{m_0}{m_f}</math>
Where ΔV is the change of velocity of the vehicle, m0 is the initial total mass, including propellant, also known as wet mass, mf is the final total mass without propellant, also known as dry mass, ve is the exhaust velocity and is equal to Isp times g0. Here, Isp is the specific impulse in the dimension of time and is a measure of effectively the rocket use the propellant and g0is standard gravity. In other words, this equation relates the total amount of velocity change that a rocket engine can create on a system by means of the initial and final mass (loss of mass of propellant), the efficiency. When multiple stages are present this equation must be considered for each stage.
So, as ΔV is known, then choosing a propulsion system will define the Isp and this will lead to the ratio of the initial and final mass necessary or which is equivalent to the amount of mass for structure tanks and engines, payload and propellant that is needed.
For example, this table shows some figures of merit of different rocket engines.
| OLV | Propellant % of total mass | Payload % of total mass |
|---|---|---|
| Saturn V | 85 | 4 |
| Space Shuttle | 85 | 1 |
| Soyuz | 91 | 2 |
In conclusion, the only FOM that is directly related to a physical principle is the Payload to mass Ratio described above.
Payload to mass Ratio [Kg/Kg]
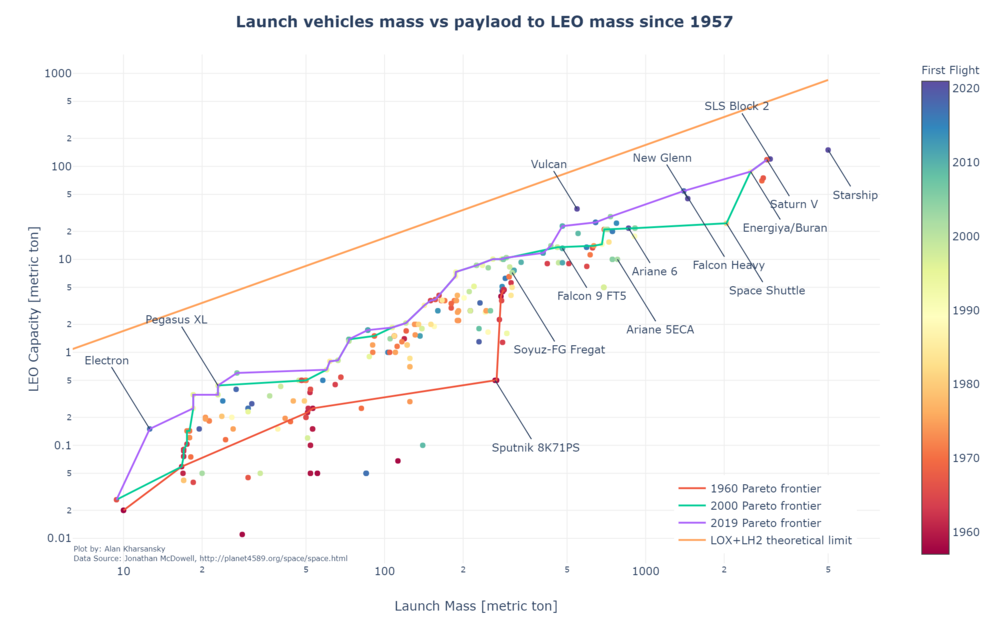
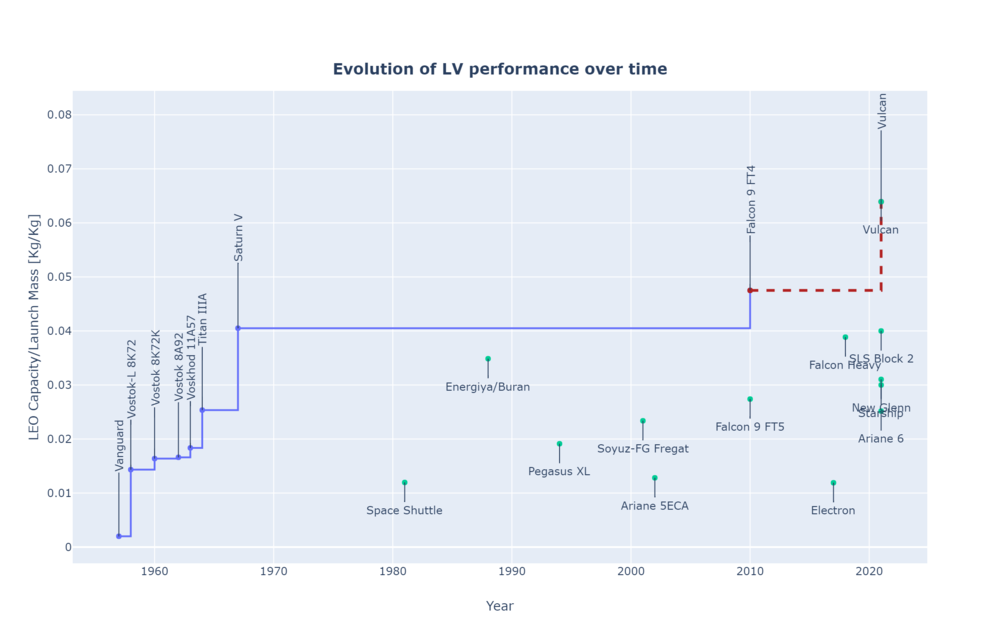
Useful payload to orbit is driven by the Rocket Equation and then affected by the different efficiency factors and non-idealities of the real Launch Vehicles designed and implementation. The trend in the payload to mass ratio is illustrated in the following plot using historical database <ref>McDowell's JSR Database (Links not working)</ref> since 1957. Only those LVs which has successfully achieved orbit at least once and carrying more than 10 Kg of payload were considered. A trend towards bigger LVs and more efficient can be observed.
Caveat: the LEO capacity figure is an approximation and is not normalized to a specific orbit across LVs. A substantial difference might be present if the stated LEO capacity was calculated for a 600 KM SSO orbit instead of a 400 Km equatorial orbit.
The evolution over time of this FOM can be seen in the following plot. In this case, only those LV that are better than the previous ones is plotted.
Payload to LEO [Kg/Year]
Reliability
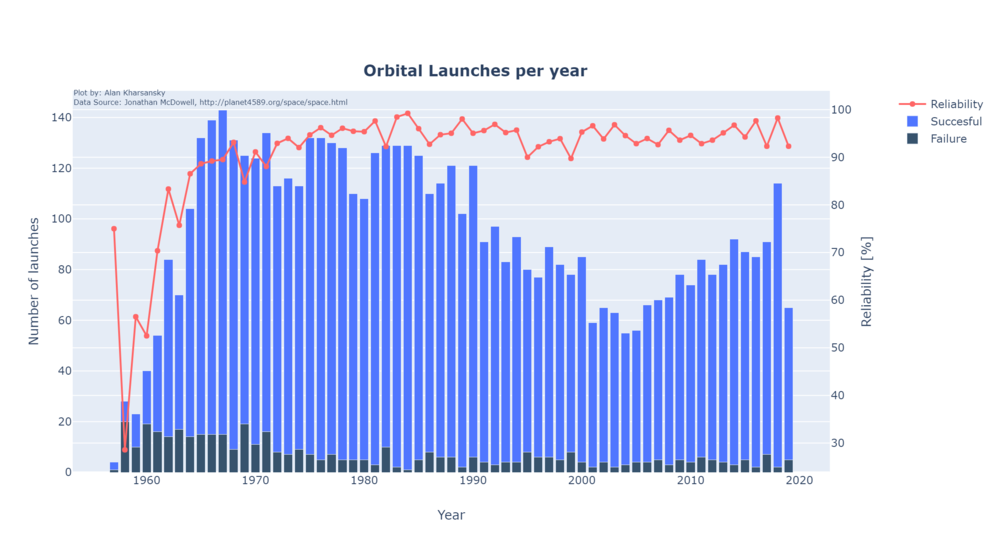
The reliability of LVs has increased significantly during the first 10 years after 1957 reaching levels of above 90% overall. Later years the increment is not that significant and for example, in 2018 the 98.24% of all the launches were successful. This trend and the totals can be seen in the following plot:
